DP-700 Episode 8: Monitoring & Resolving Errors I

PowerBI consultant ·
Welcome to Episode 8 of our DP-700 series. So far we have set up workspaces (Episode 1), managed their lifecycle (Episode 2), secured them (Episode 3), orchestrated work (Episode 4), loaded and ingested data (Episode 5 and Episode 6) and transformed it (Episode 7). Now we move to the third skill area, Monitor and optimize an analytics solution, and start with the question every data engineer gets on a Monday morning: did everything run, and if not, why? These are the seven topics from the session outline:
- Monitor data ingestion
- Monitor data transformation
- Monitor semantic model refresh
- Configure alerts
- Identify and resolve pipeline errors
- Identify and resolve Dataflow Gen2 errors
- Identify and resolve notebook errors
This is Part I. The remaining error topics (Eventhouse, eventstream and T-SQL errors) and the optimization topics come in later episodes.
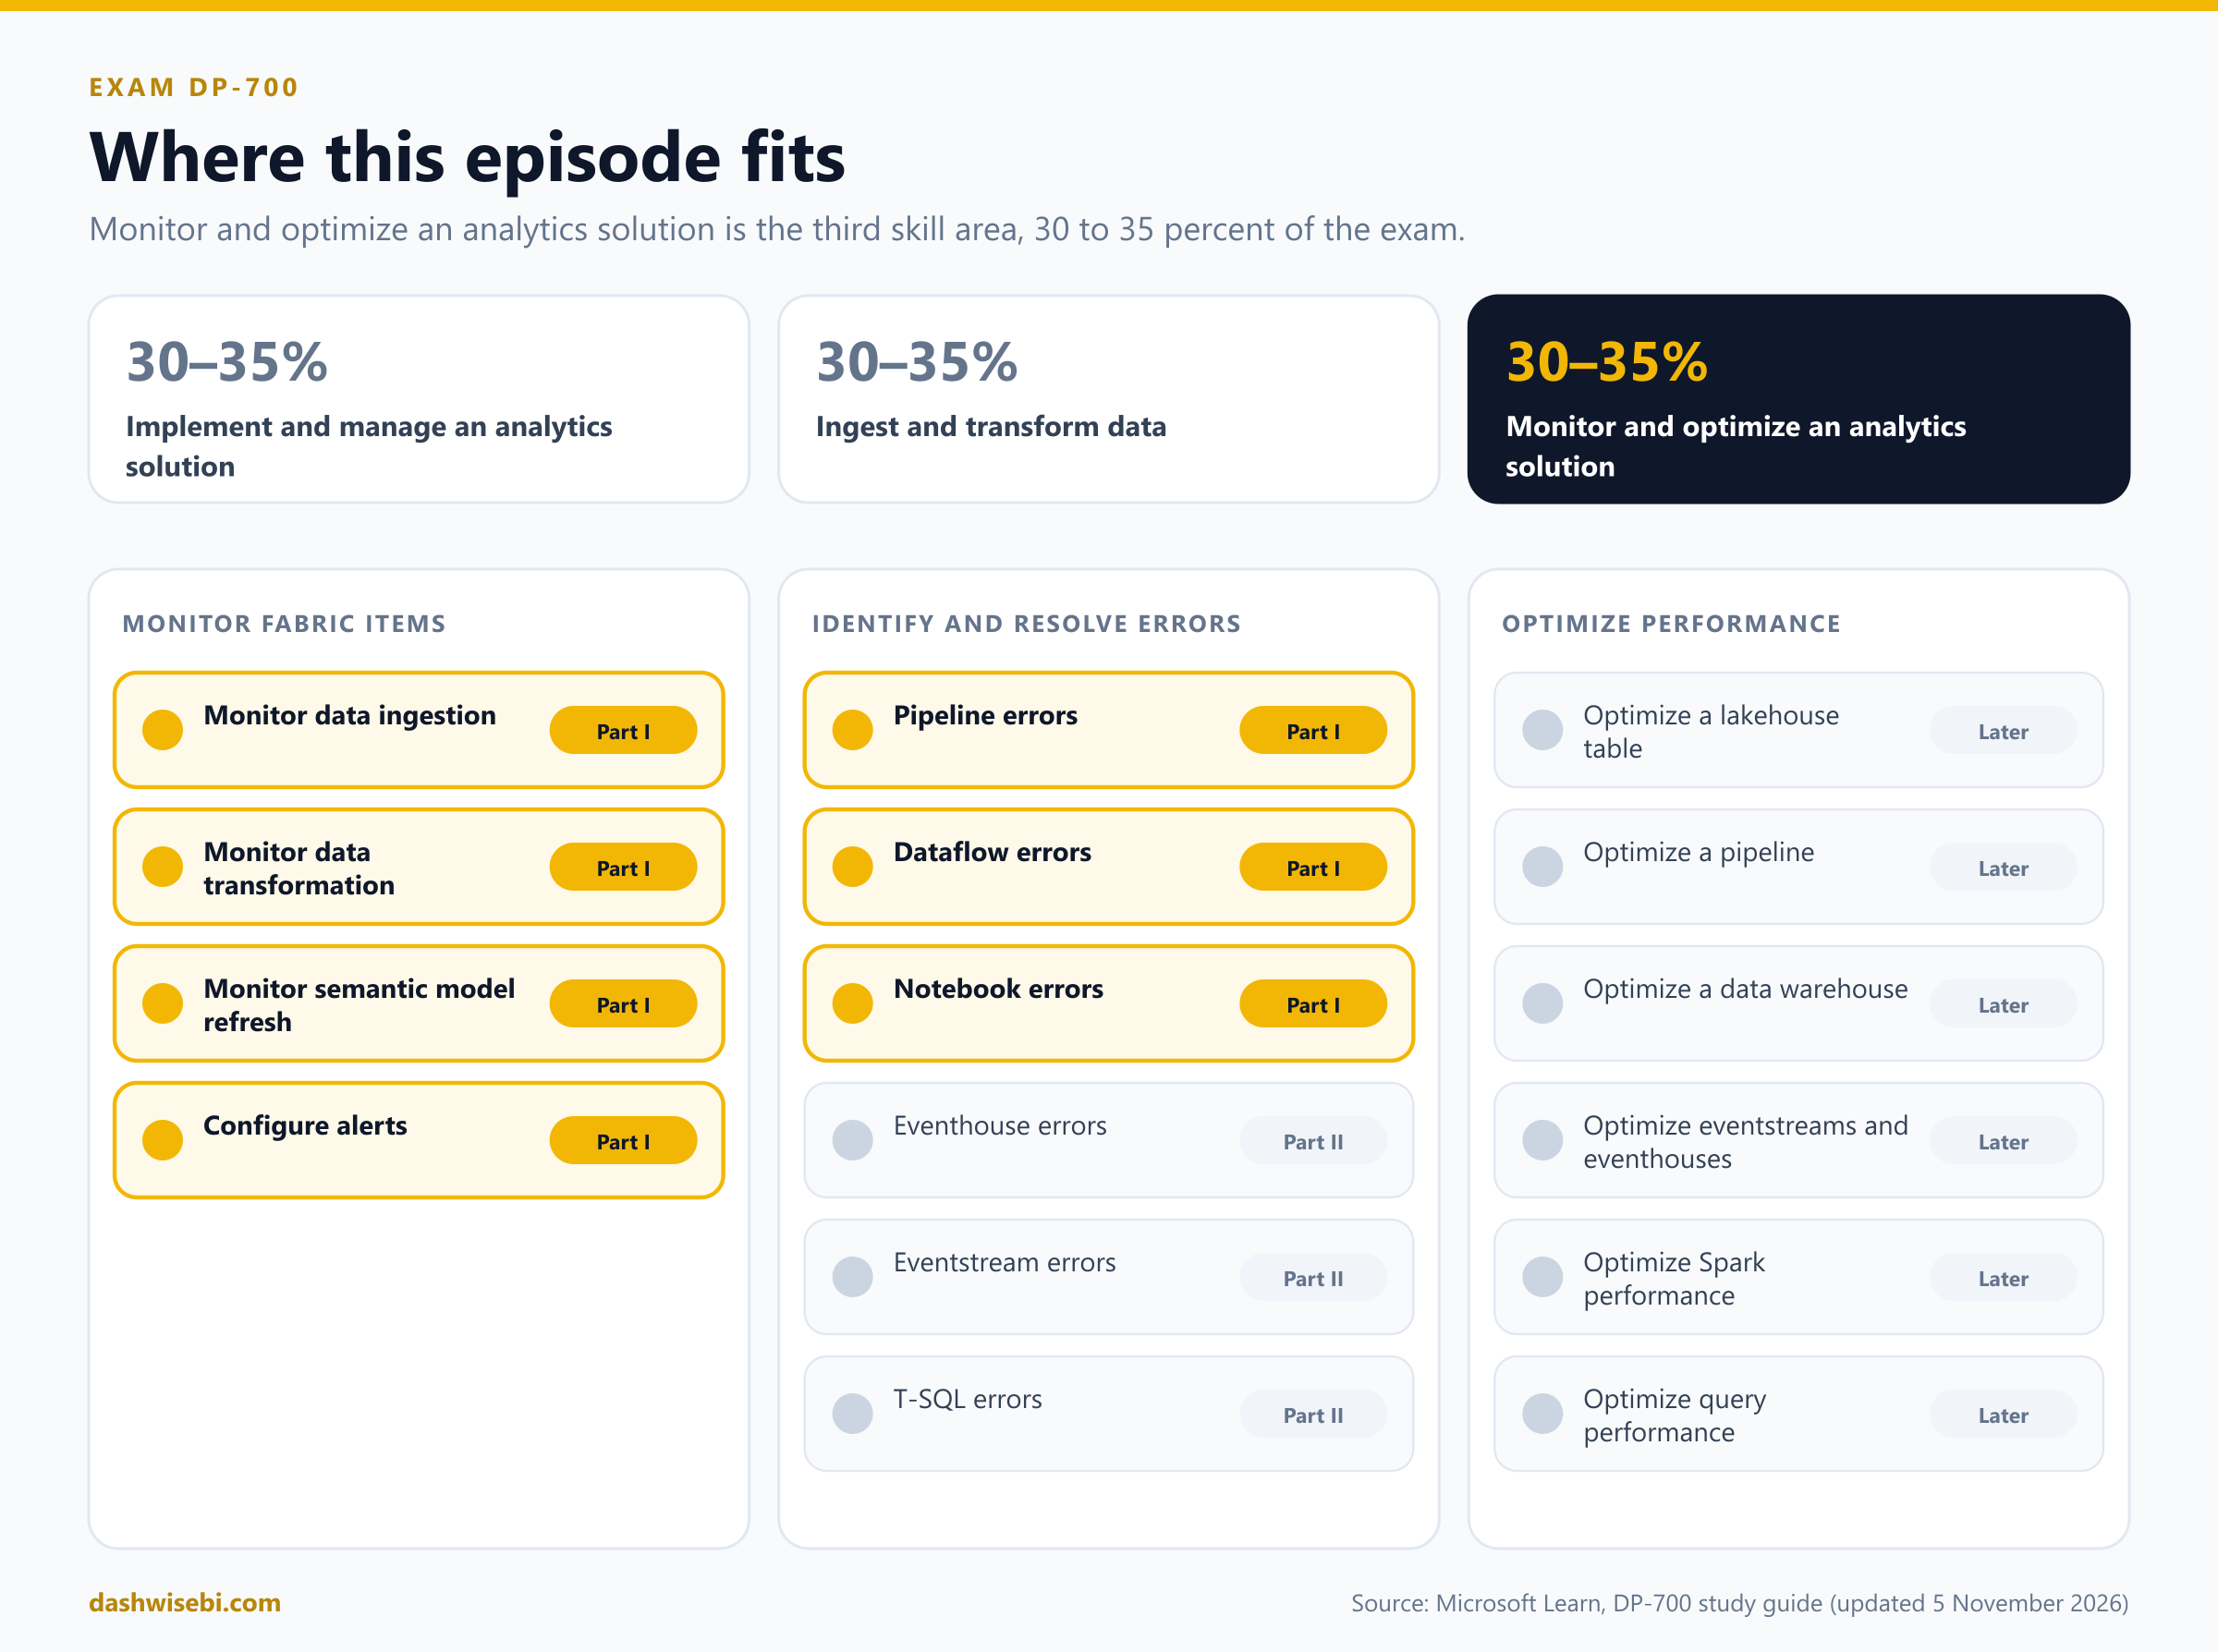
A note on wording. The study guide Microsoft updated on 5 November 2026 puts the first four topics under Monitor Fabric items and the next six under Identify and resolve errors: pipeline, dataflow, notebook, eventhouse, eventstream and T-SQL errors. We cover the first three of those here. Where we mention Dataflow Gen2, that is the dataflow experience the study guide calls "dataflow".
The big picture: ask the question, find the place
Fabric does not have one monitoring screen. It has a central list that tells you whether something ran, and a detailed view in each workload that tells you why it failed. The skill is knowing which one to open.
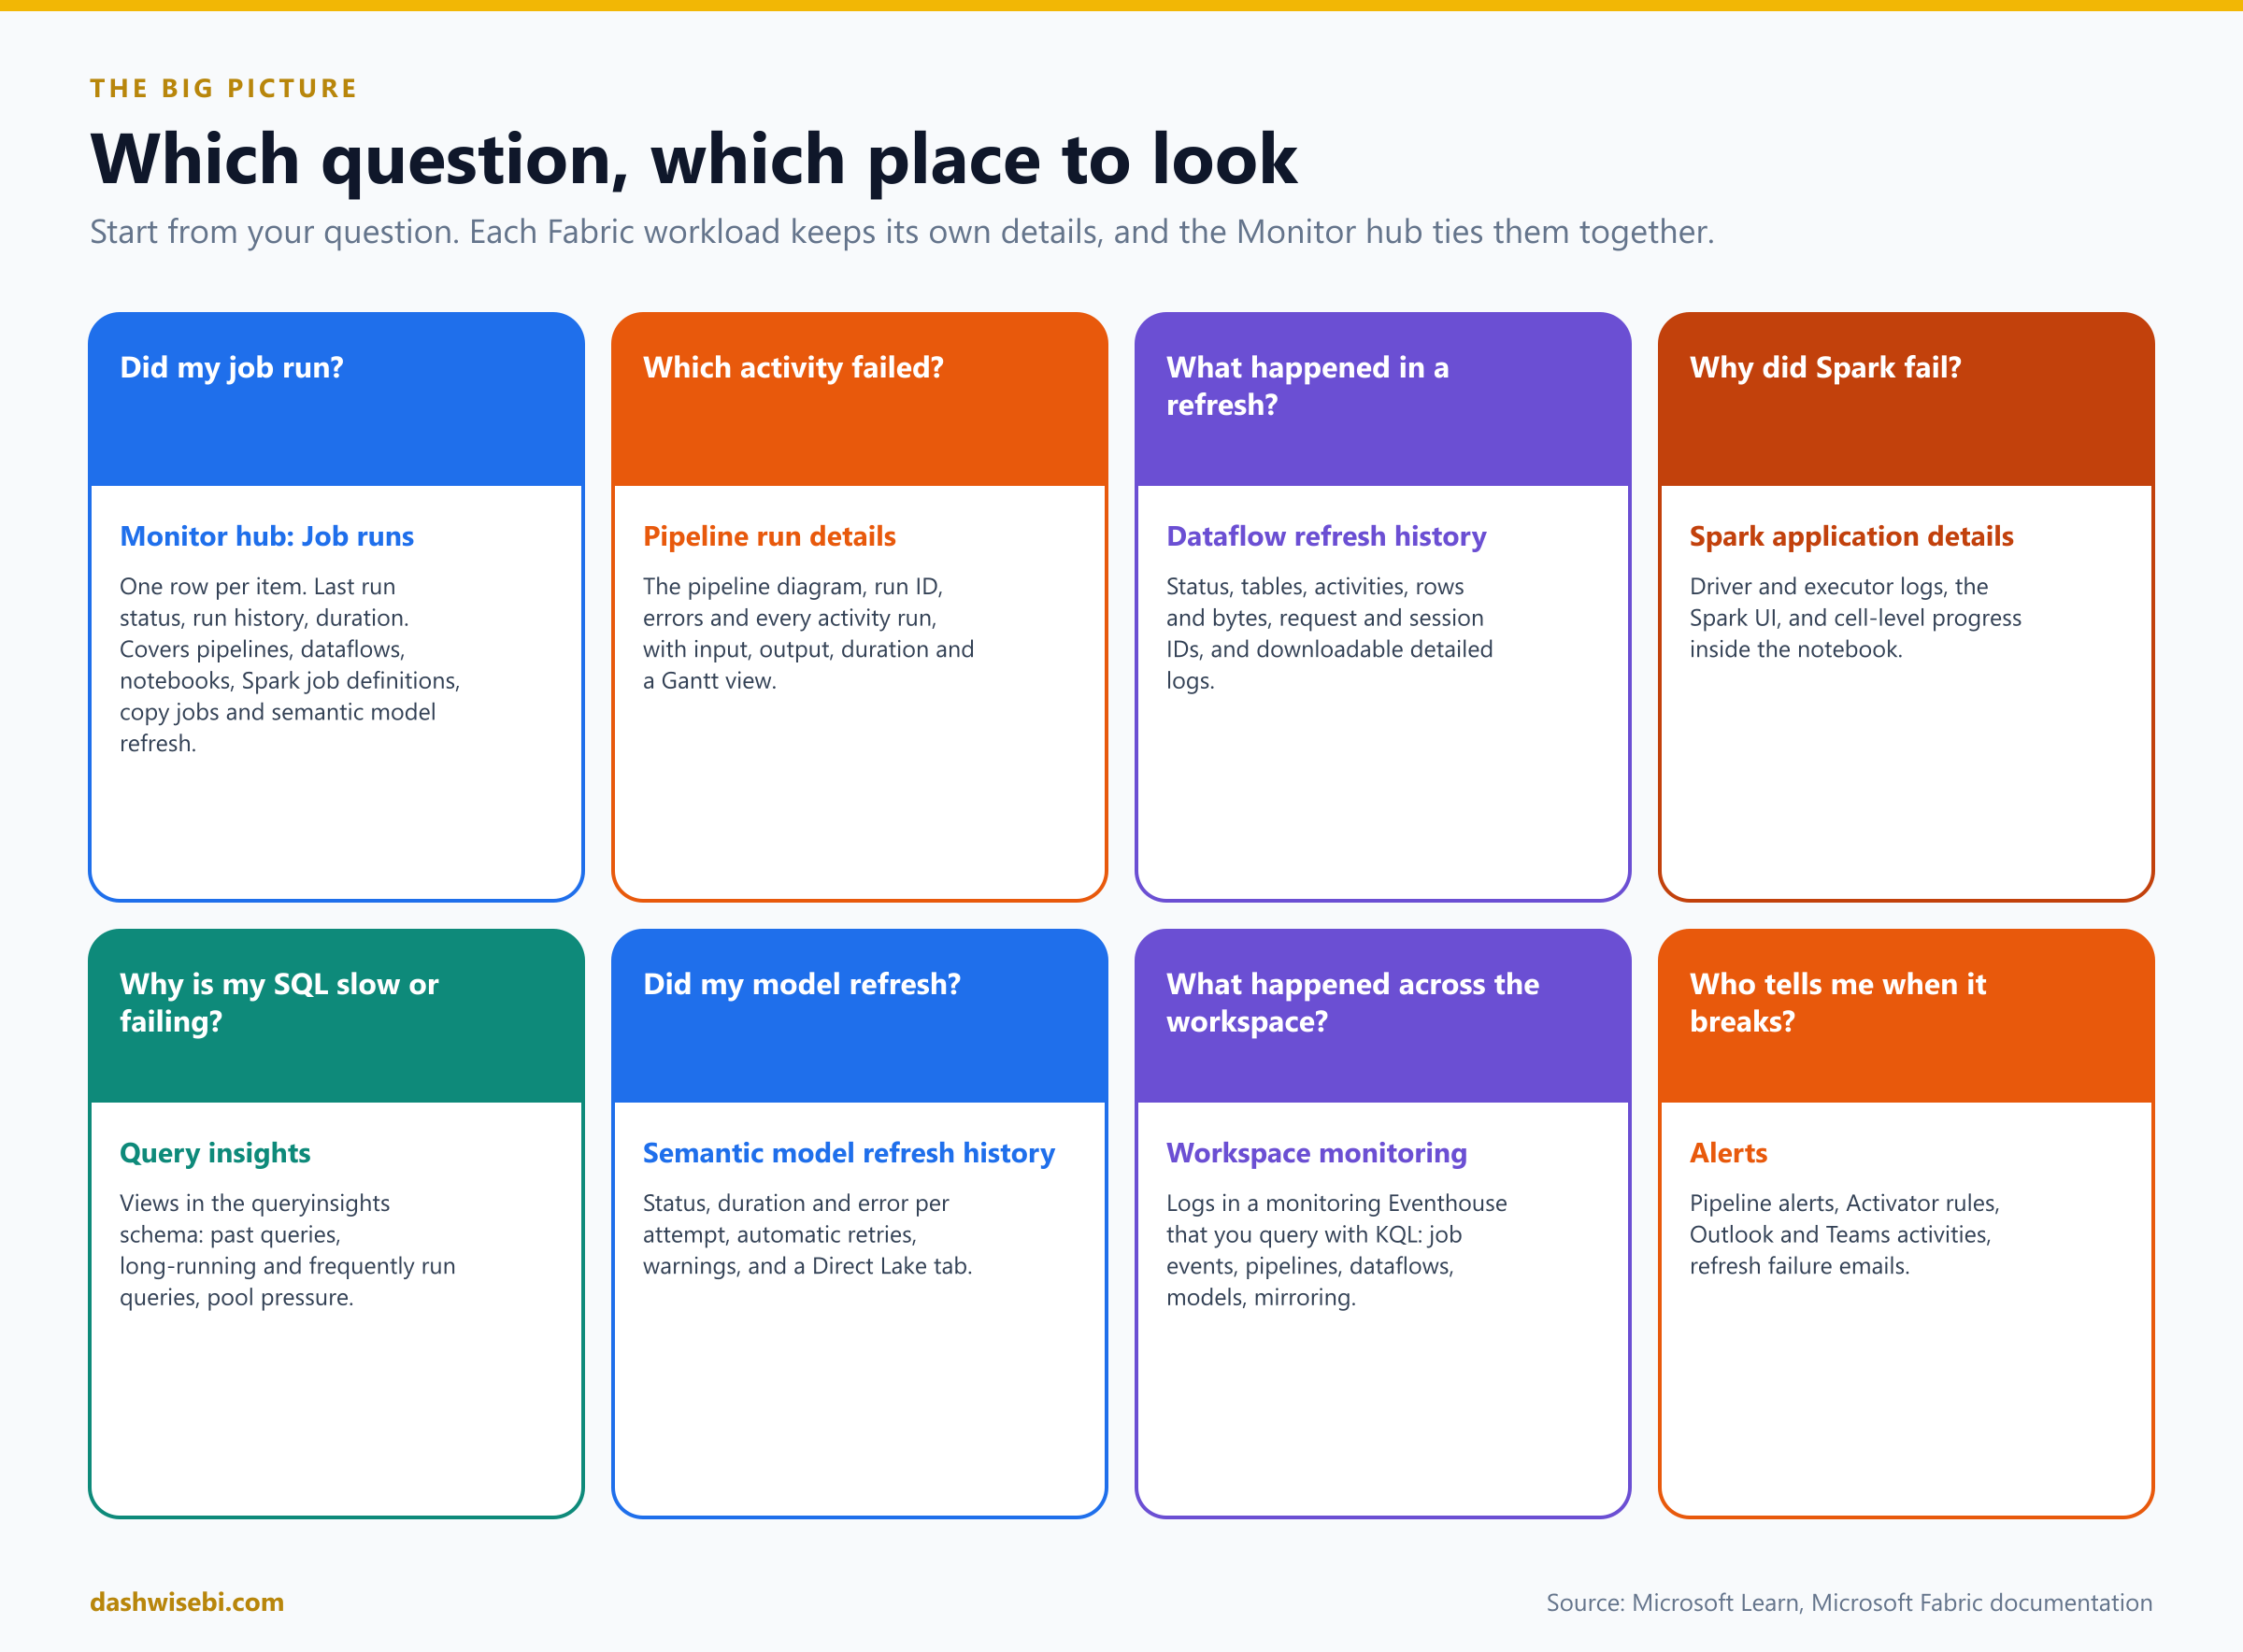
- Did it run? The Monitor hub.
- Why did it fail? The detail view of that workload: the pipeline run, the dataflow refresh, the Spark application, the model refresh history, or the warehouse's query insights.
- What happened across the whole workspace, over time? Workspace monitoring, where logs are stored in an Eventhouse that you query with KQL.
- How do I find out without looking? Alerts.
1. Monitor data ingestion
In Episode 6 you met three ways to bring data in: shortcuts, mirroring and pipelines. Add Copy jobs, dataflows and eventstreams, and you have a lot of moving parts. Monitoring ingestion means being able to answer three things for each of them: did it run, how long did it take, and what did it move.
The Monitor hub
The Monitor hub is the unified observability pane in Fabric. Any Fabric user can open it, but you see only the items you have permission to view. Its Job runs page lists one row per item, with a summary of the last five runs, and a color-coded Last run status.
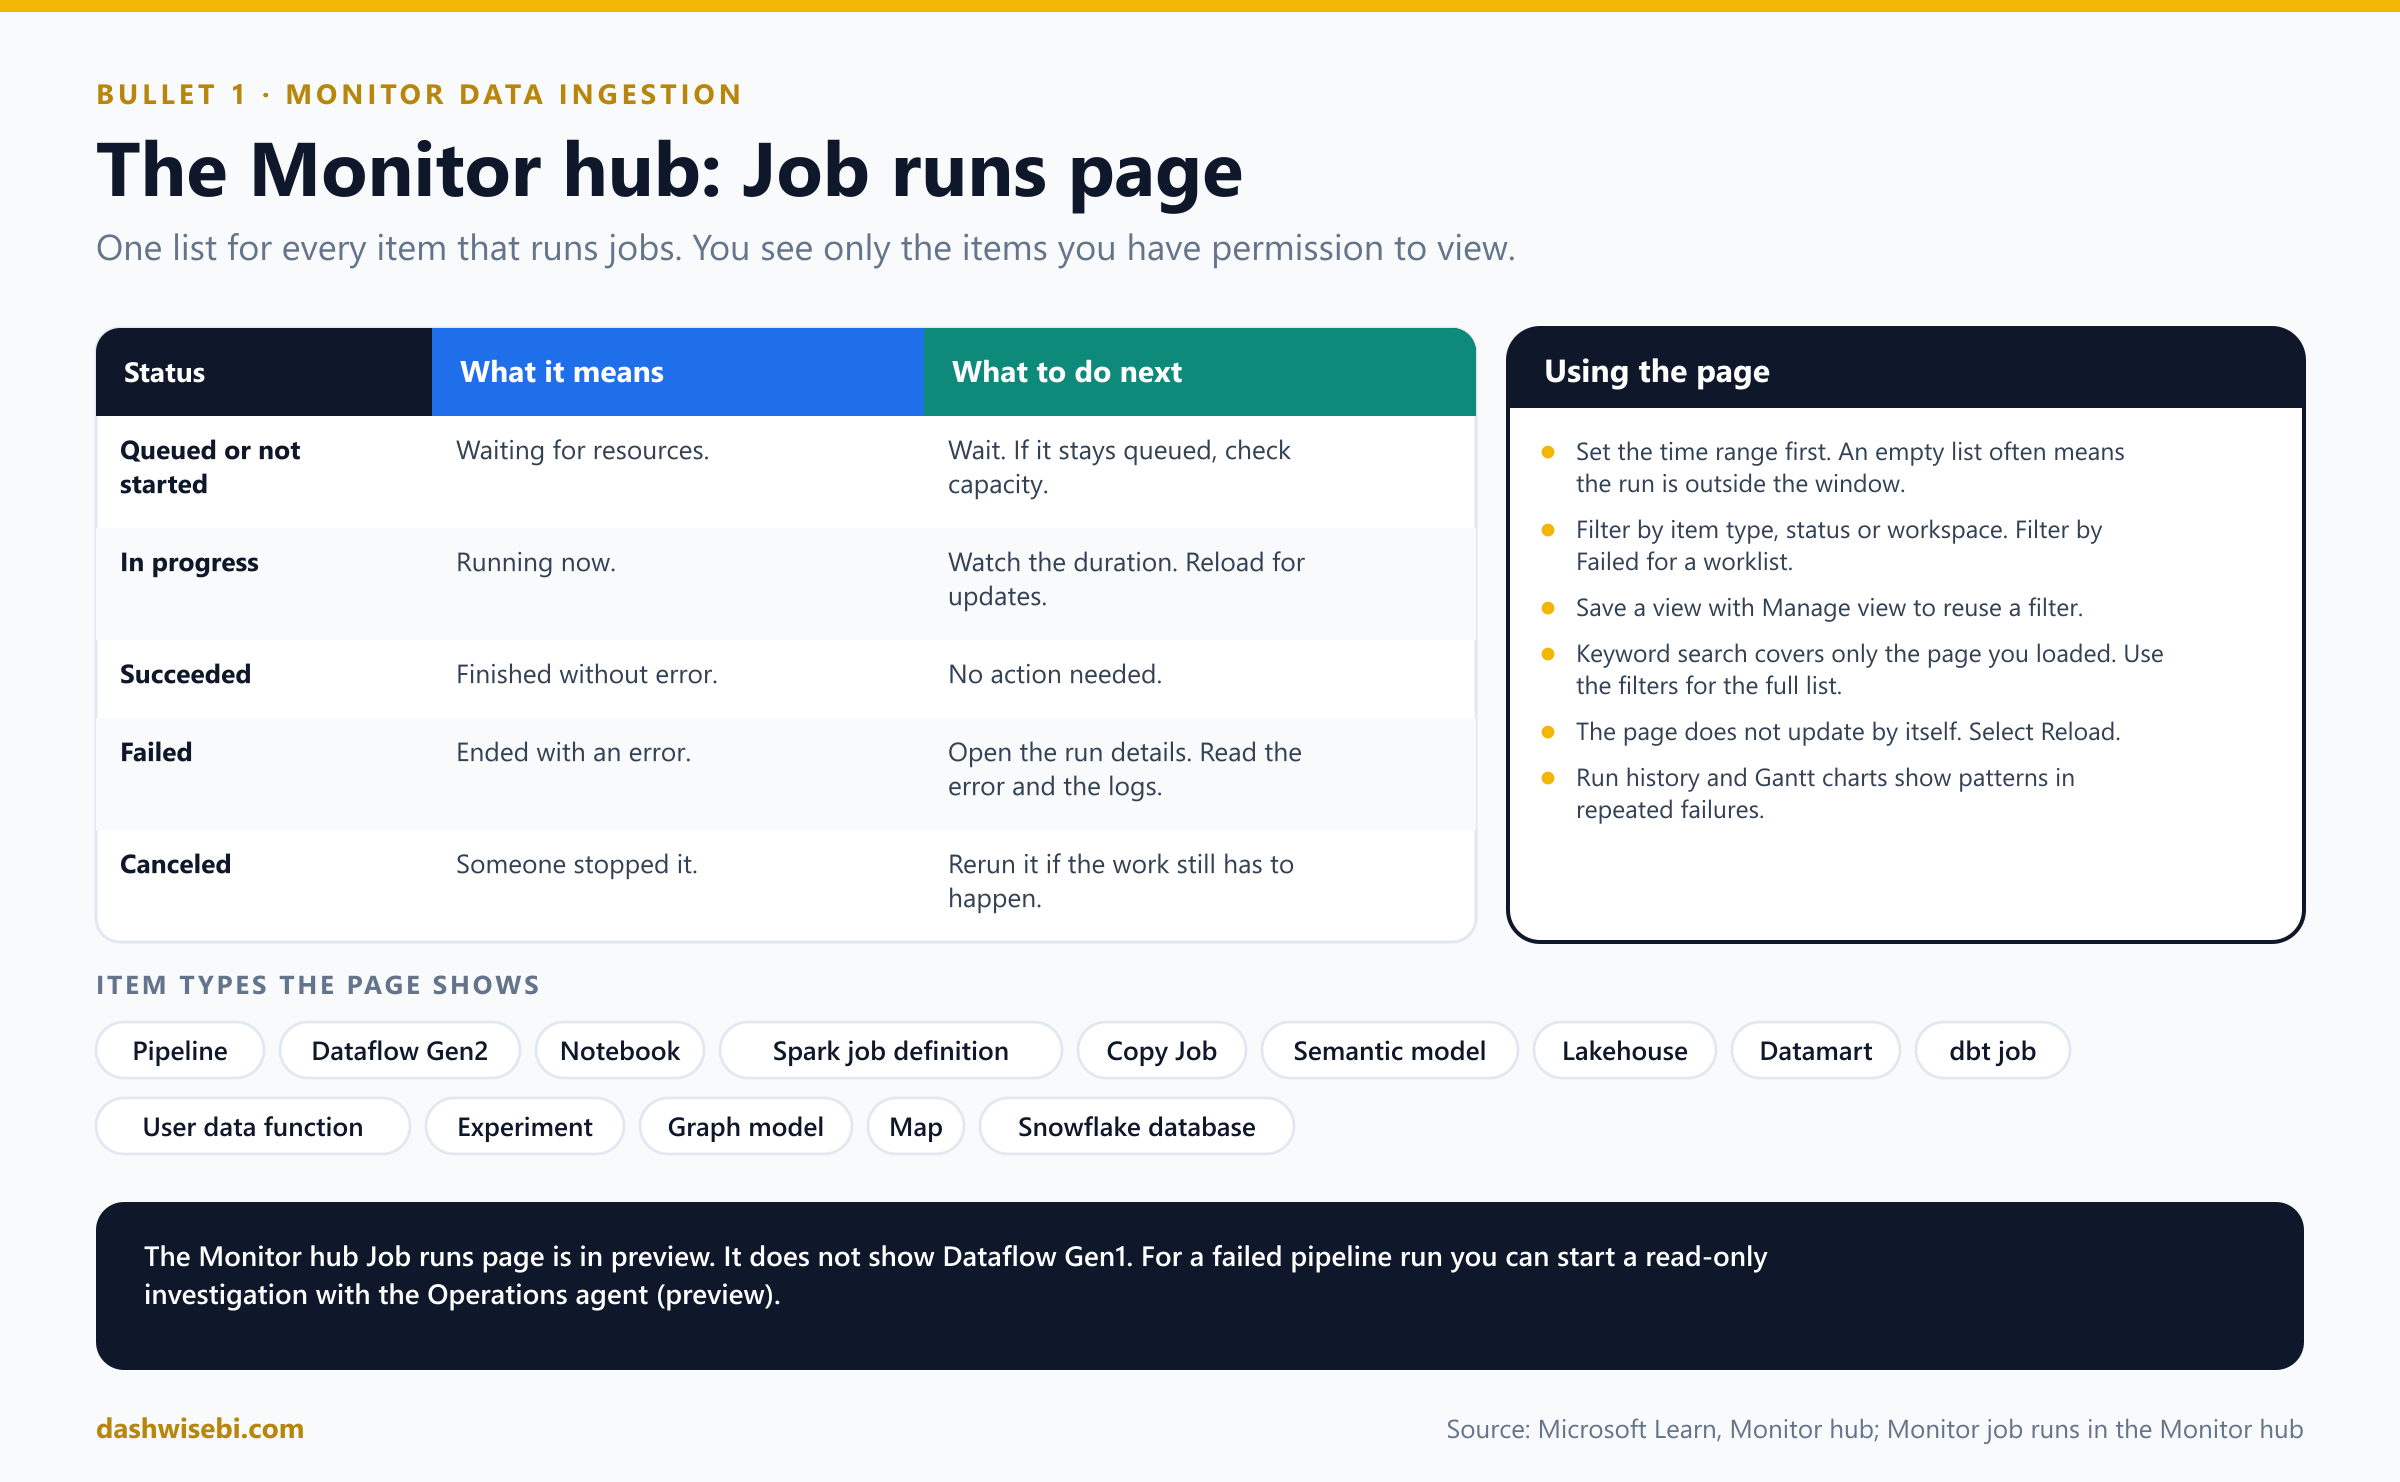
- Statuses. Queued or not started, In progress, Succeeded, Failed and Canceled. A run that stays queued usually means a capacity problem.
- Time range first. The list only shows runs in the selected window. If a run you expect is missing, widen the range.
- Filters and views. Filter by item type, status or workspace. Filtering by Failed gives you a worklist. Manage view, Save view keeps a filter for next time. The keyword box searches only the page already loaded, so use the filters to search everything.
- Not live. The page loads data when you open it. Select Reload to see new runs.
- Details. Select a row to open a side pane with the last run, advanced details (who submitted it and what invoked it) and Run history. For complex items such as pipelines and dataflows you can open a full detail page with the execution flow, an activity table and a Gantt chart.
- Item types. Pipelines, Dataflow Gen2, notebooks, Spark job definitions, Copy jobs, semantic models, lakehouses (such as Load to table), datamarts and more. It does not show Dataflow Gen1. The Job runs page is in preview.
Pipeline runs in detail
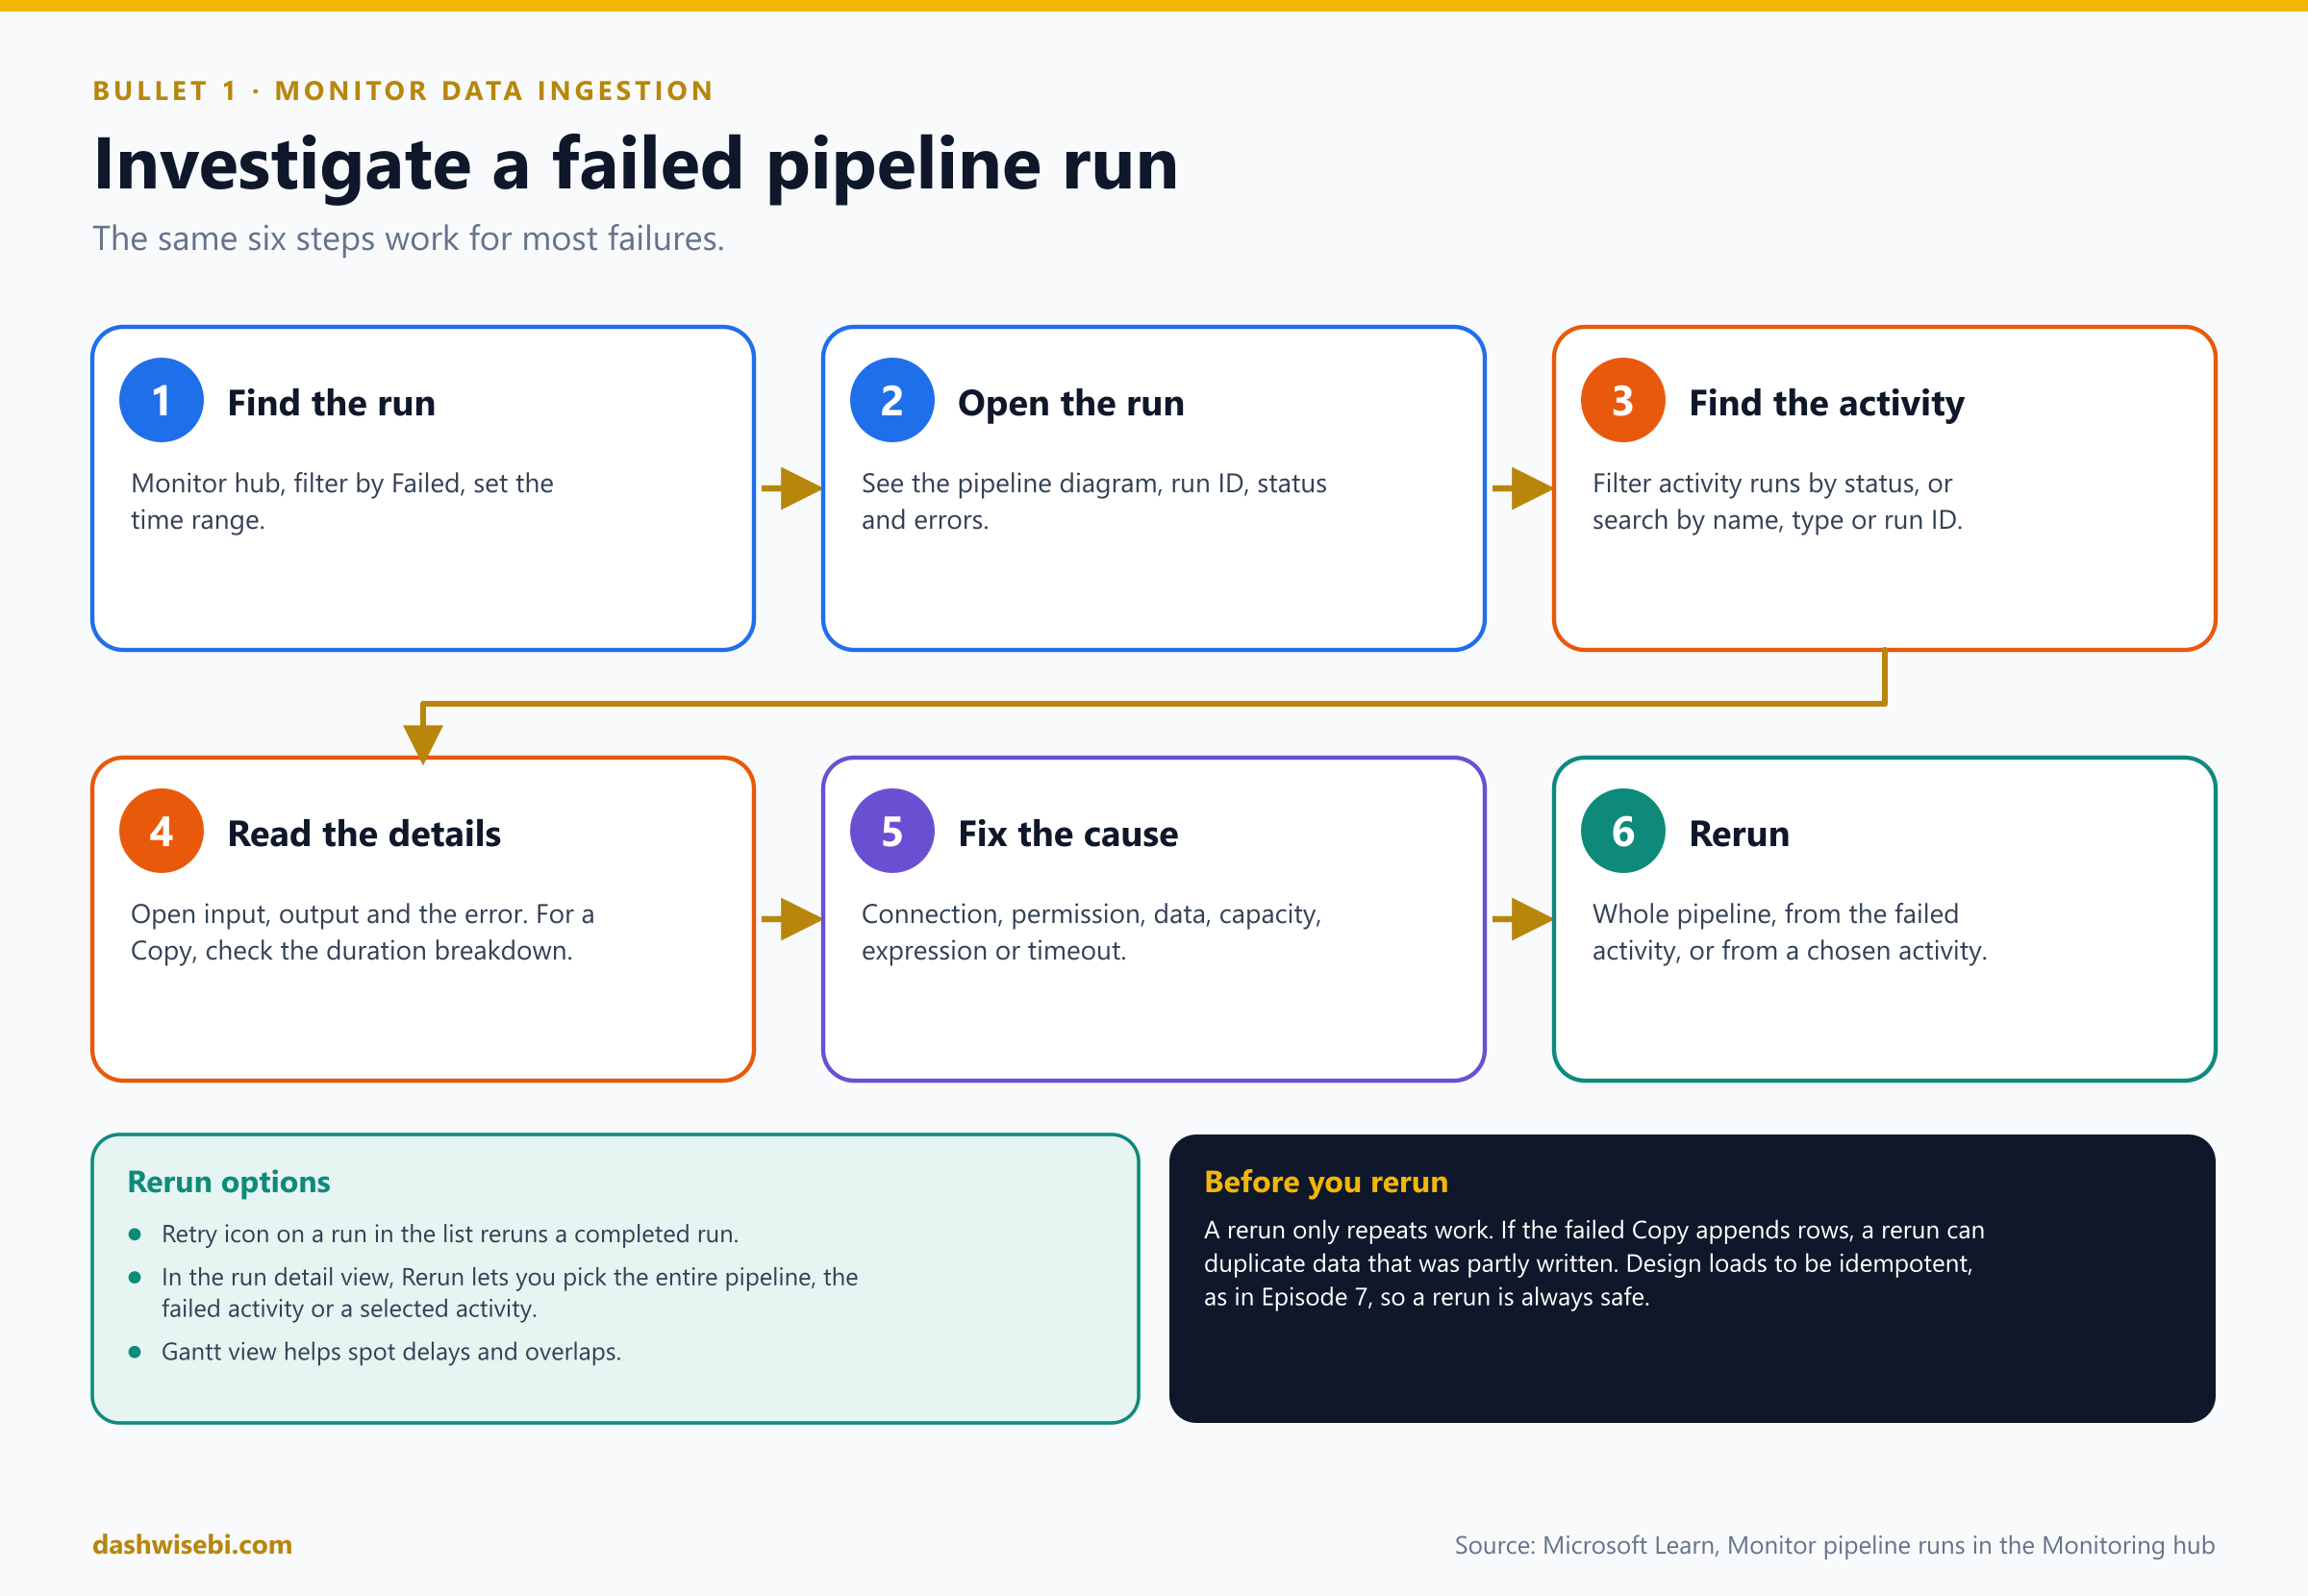
Open a pipeline run to see its diagram, run ID, status, errors and every activity run. You can filter activity runs by status, search by activity name, type or run ID, choose which columns to show, and Export to CSV. Select an input or output link to see exactly what an activity received and returned. For a Copy activity, the performance view has a Duration breakdown and Advanced details that show where the time went. If a run has more than 2,000 activity runs, use Load more.
Two more views help with ingestion. The Gantt chart shows runs as bars grouped by pipeline, so a run that is getting longer, or two runs that overlap, stands out. The hierarchical view (turn on Upstream run and Downstream runs in column options) shows which job triggered a pipeline and which jobs it started.
Every ingestion tool has a home
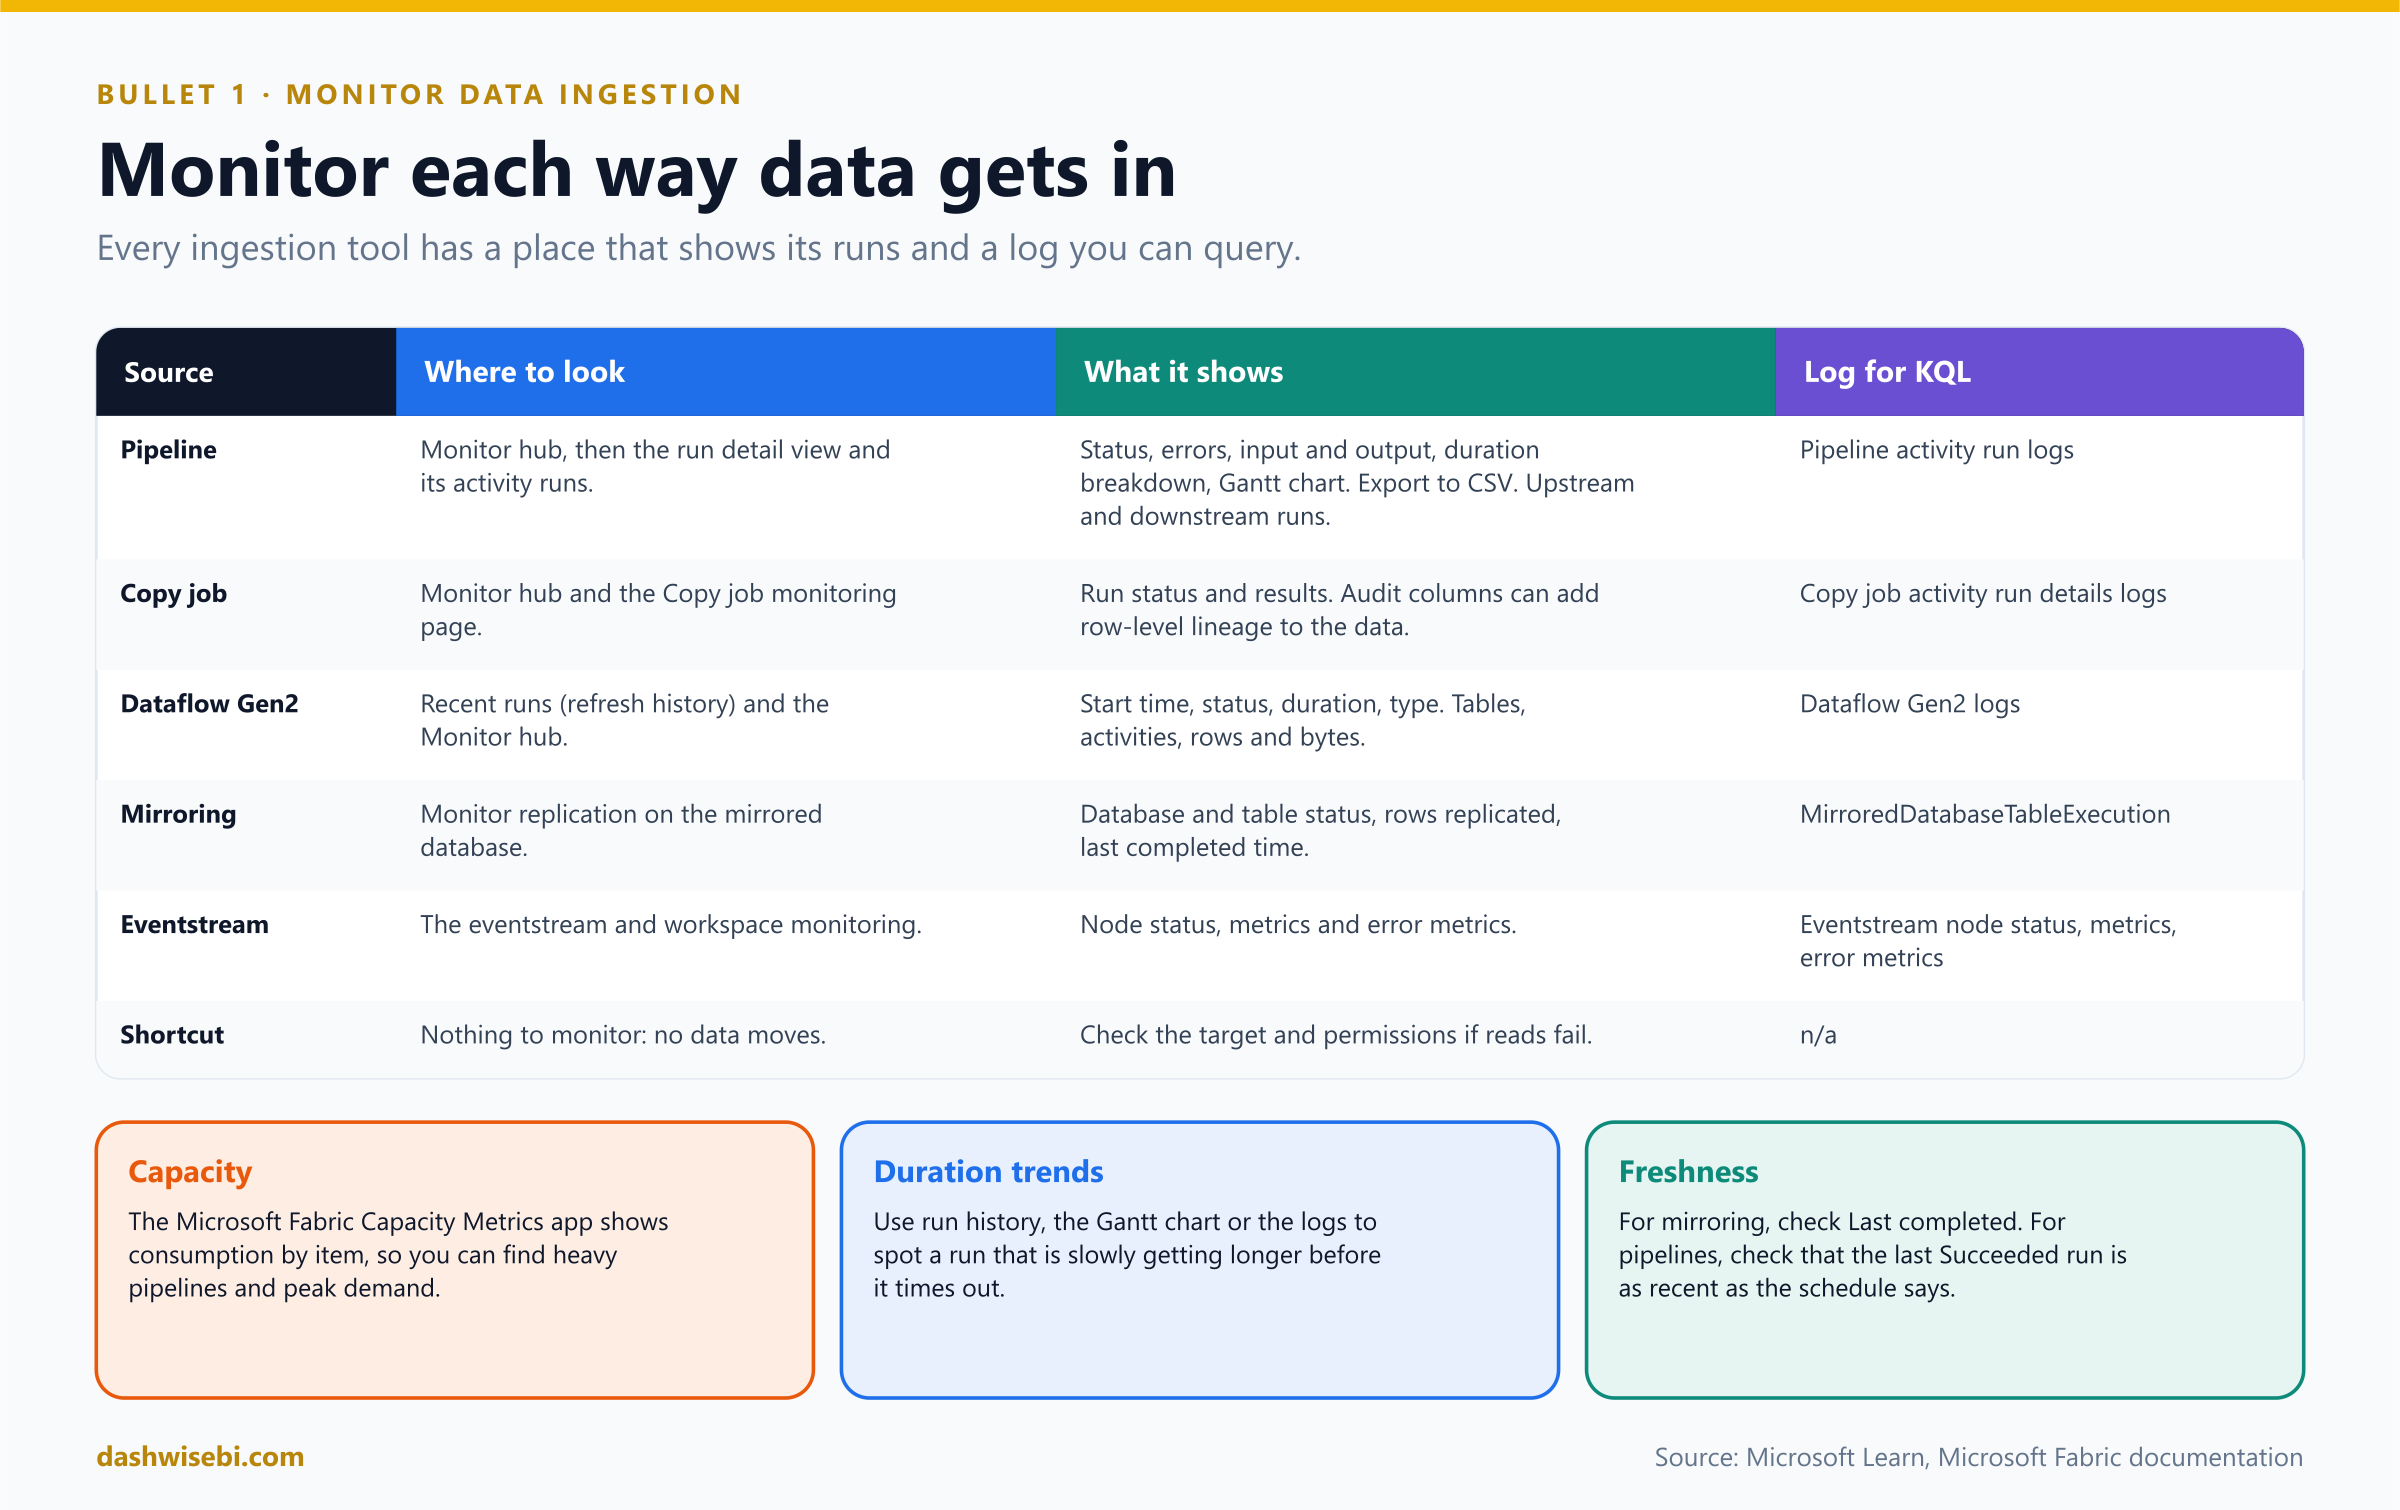
- Pipelines and Copy jobs: the Monitor hub. A Copy job can also write audit columns into the destination rows, such as extraction time, source file path and job run ID, which gives row-level lineage without code.
- Dataflow Gen2: the refresh history (section 2).
- Mirroring: the Monitor replication page, which shows database and table status, rows replicated and the last completed time, as you saw in Episode 6.
- Eventstreams: node status, metrics and error metrics, which flow into workspace monitoring.
- Shortcuts: nothing moves, so there is no run to monitor. If a read fails, check the target and the permissions.
- Capacity: the Microsoft Fabric Capacity Metrics app shows consumption per item, so you can find the pipelines and dataflows that use the most capacity and see peak demand.
Workspace monitoring
The Monitor hub shows recent runs. Workspace monitoring keeps detailed logs you can query. You create a monitoring item in the workspace, and Fabric then sends logs from supported items into an Eventhouse (a KQL database) that belongs to it.
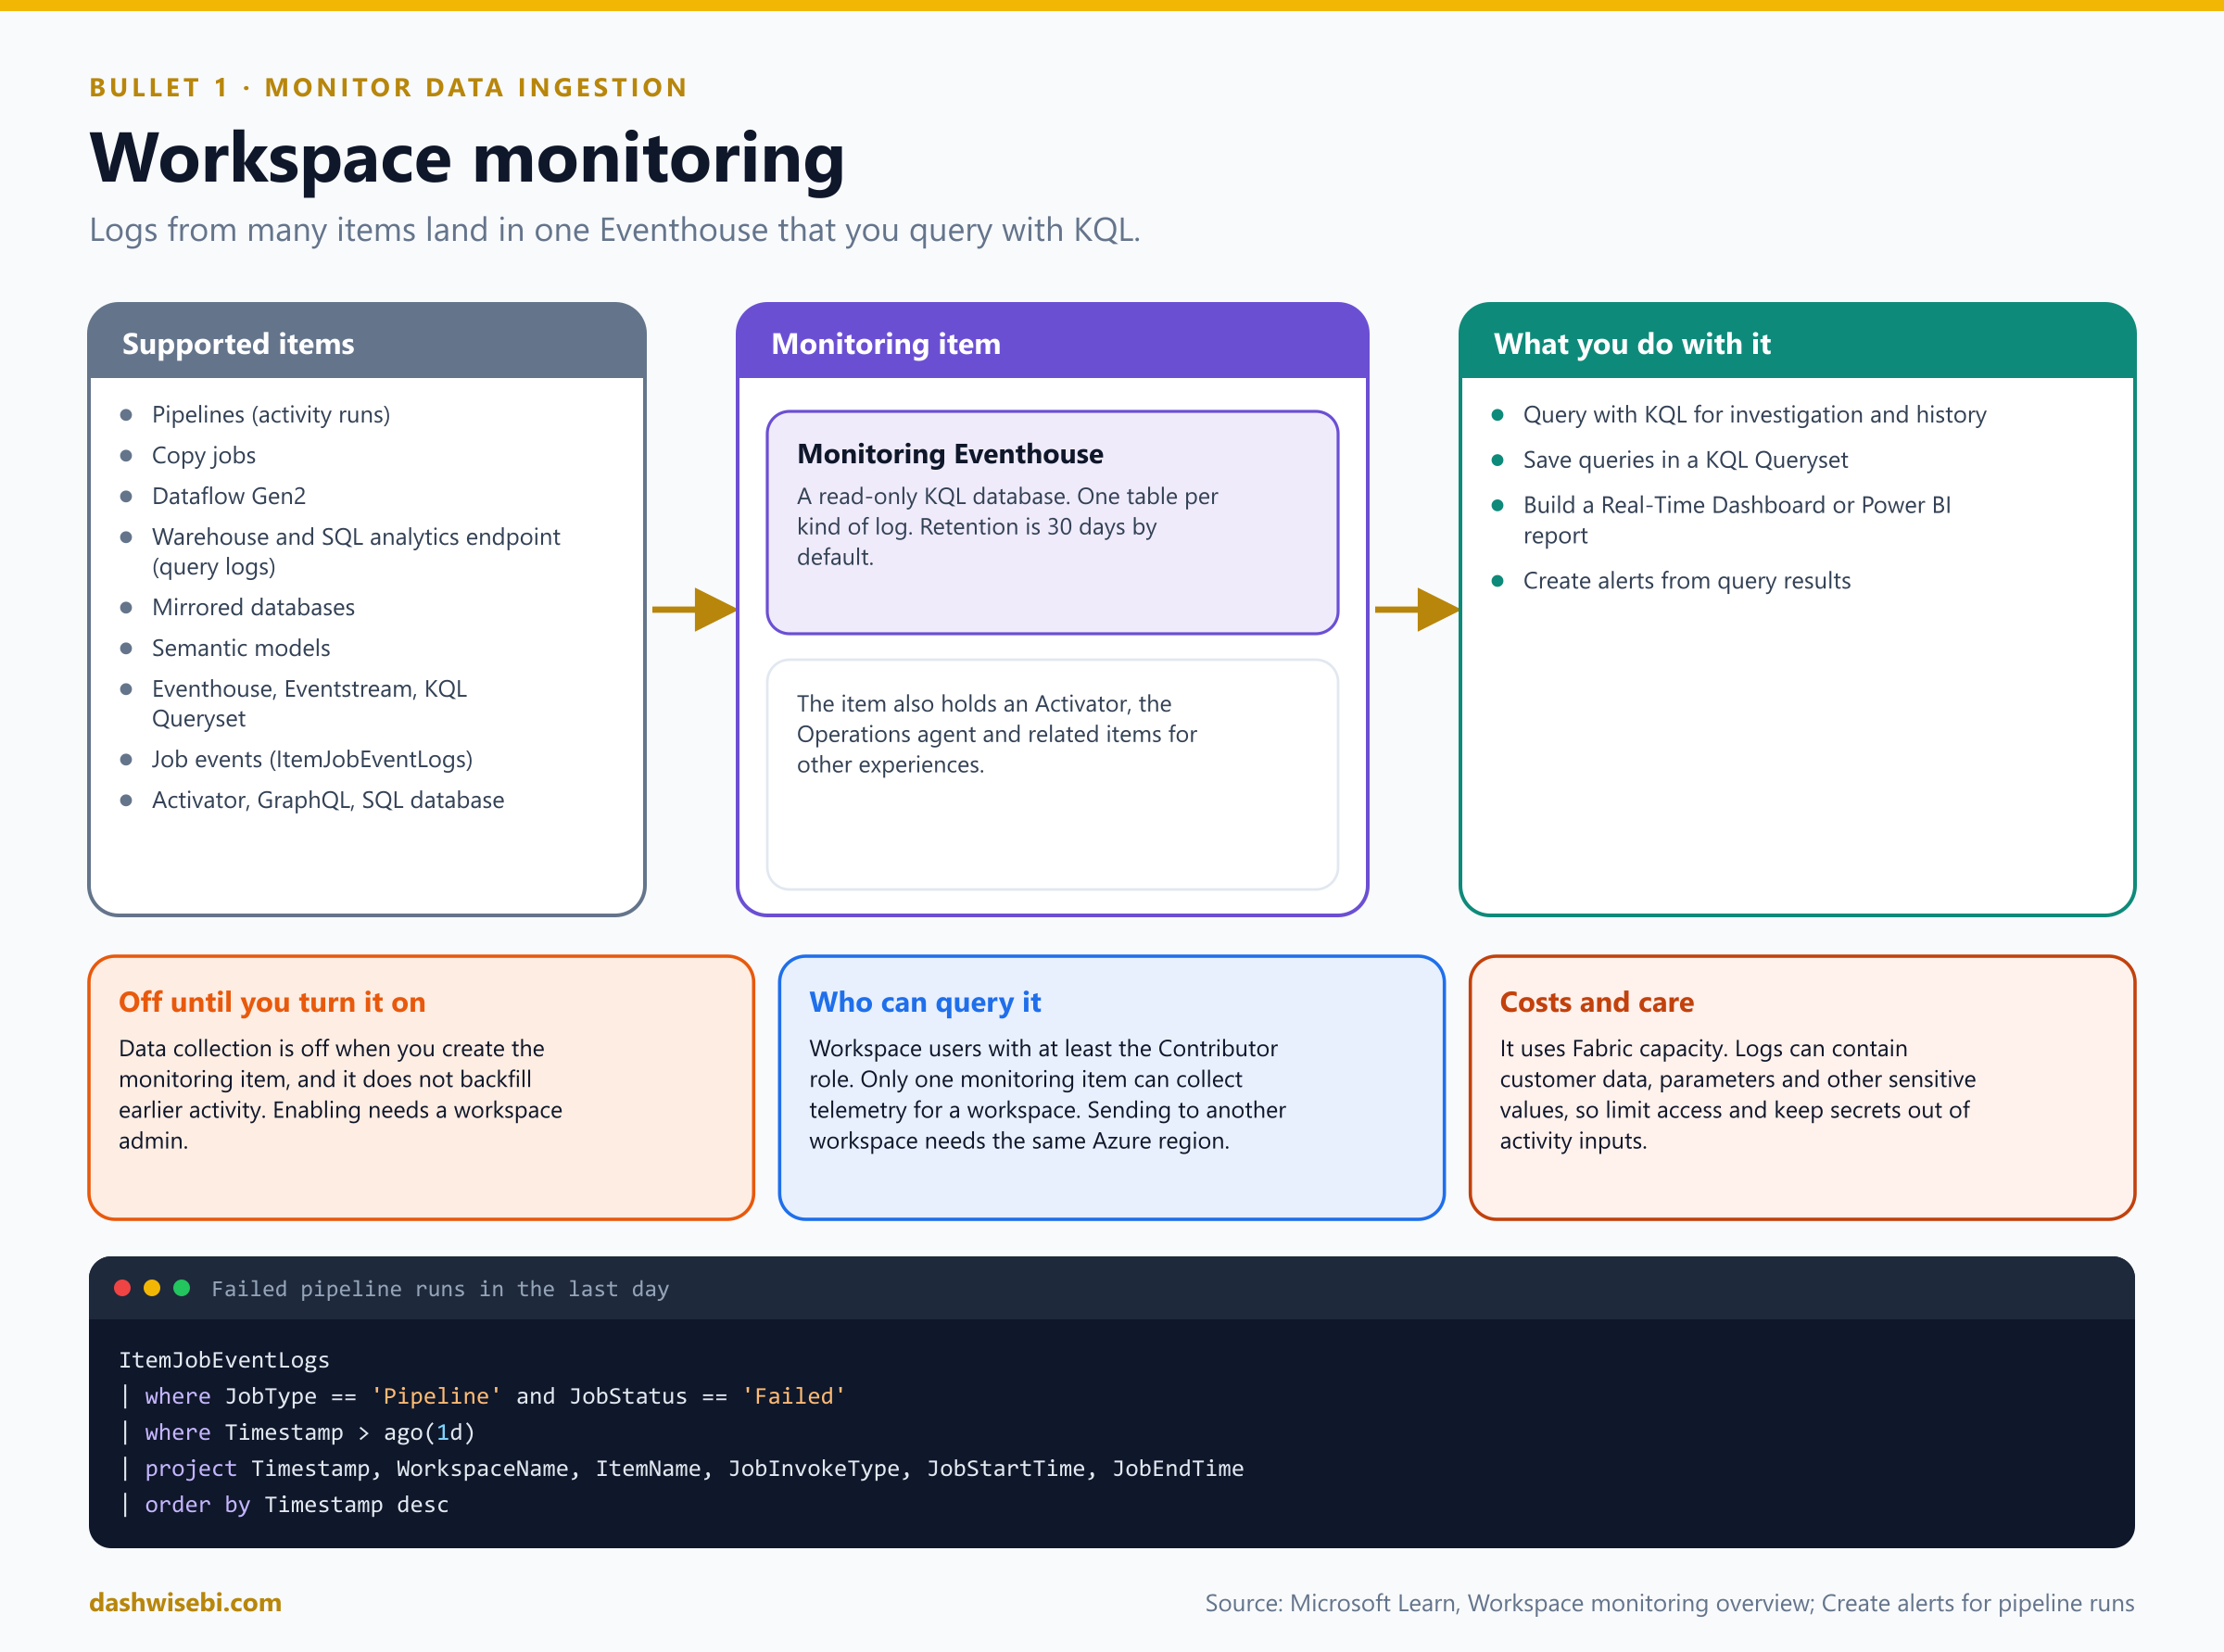
- Off by default. Collection is off when you create the monitoring item and it does not backfill earlier activity. A workspace admin enables it.
- Supported telemetry includes pipeline activity runs, Copy job and Dataflow Gen2 logs, warehouse and SQL analytics endpoint query logs, mirrored database logs, semantic model operation logs, Eventhouse and Eventstream logs, Activator rule notifications, and job event logs (
ItemJobEventLogs). - Who can query. Workspace users with at least the Contributor role. The monitoring database is read-only.
- Retention. 30 days by default. You can change the retention and caching policies in the KQL database under Manage, Data policies, and the caching period must not exceed the retention period.
- Limits. Only one monitoring item can collect telemetry for a workspace. You can send data to another workspace's Eventhouse, but both must be in the same Azure region. The monitoring data uses Fabric capacity.
- Be careful. Logs can contain customer data, input values and parameters. Limit who can read them and keep credentials out of activity inputs. The Secure input and Secure output settings on an activity help.
ItemJobEventLogs
| where JobType == 'Pipeline' and JobStatus == 'Failed'
| where Timestamp > ago(1d)
| project Timestamp, WorkspaceName, ItemName, JobInvokeType, JobStartTime, JobEndTime
| order by Timestamp desc
The same table has JobStatus (Not started, In progress, Completed, Failed), DurationMs, JobInvokeType (on-demand or scheduled) and JobInstanceId, so you can also find long-running jobs and compare a run with its usual duration.
2. Monitor data transformation
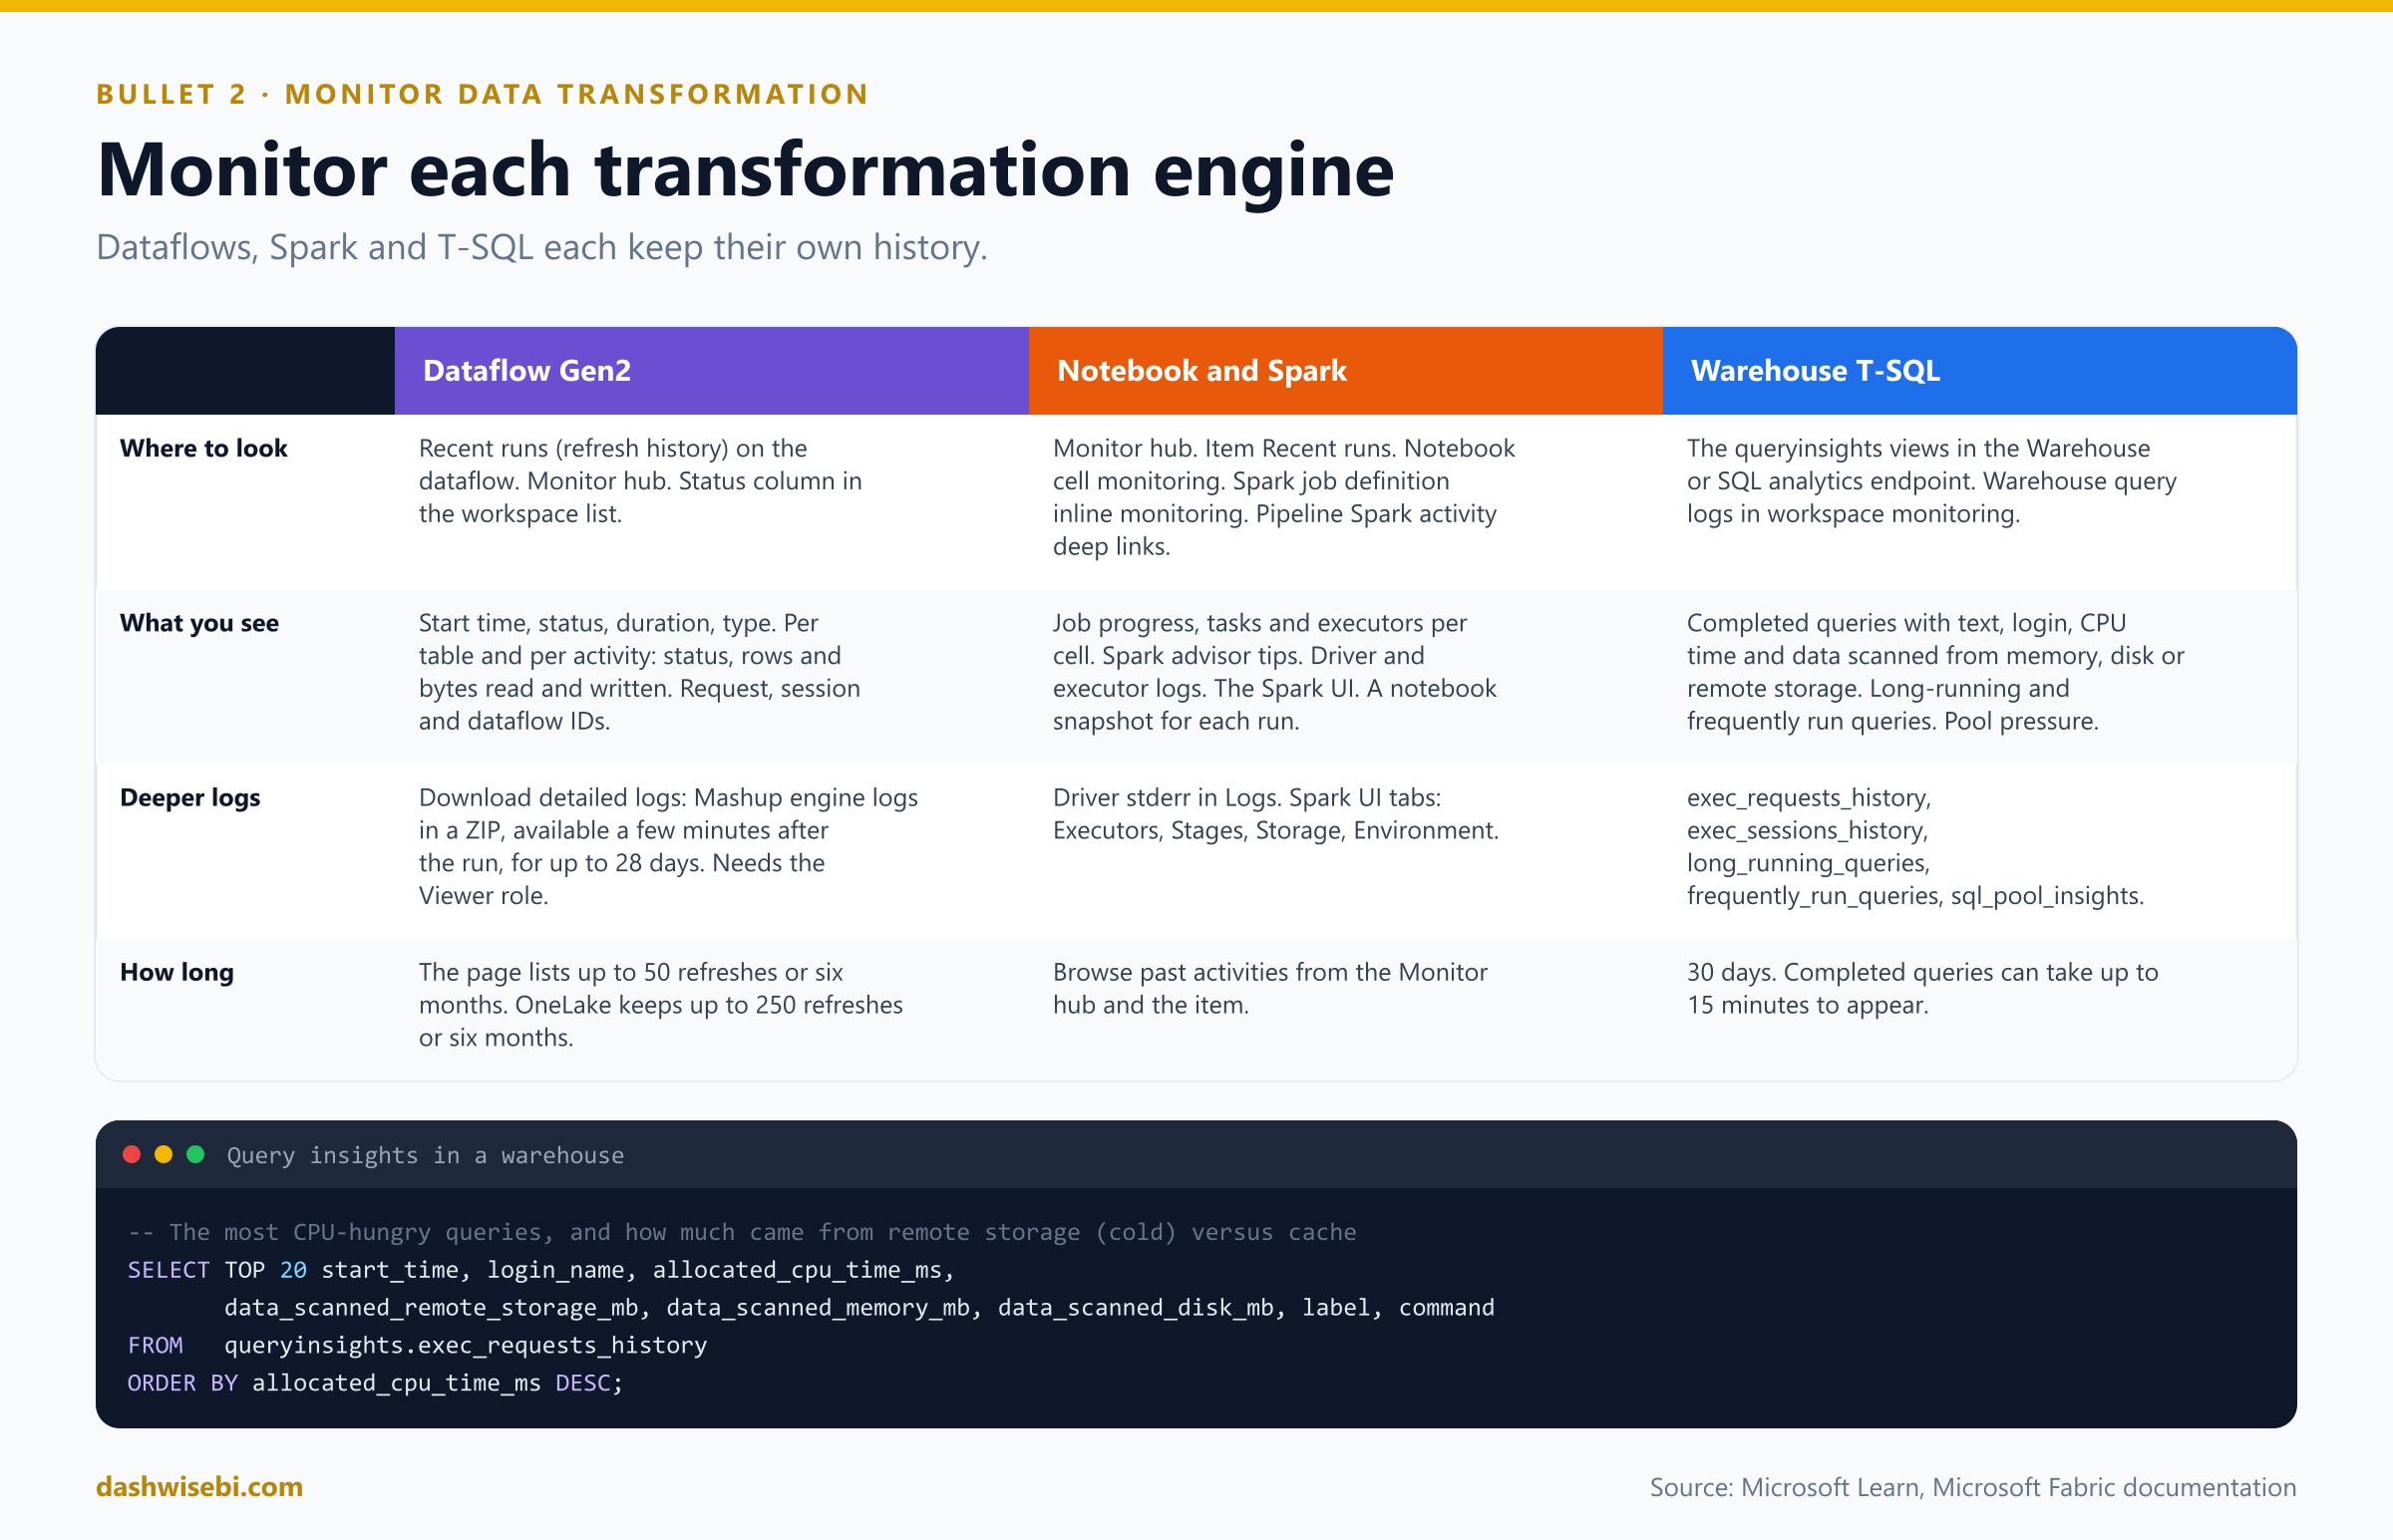
Transformations run in three places you learned in Episode 7: dataflows, Spark and T-SQL. Each keeps its own history.
Dataflow Gen2 refresh history
Open the dataflow's Recent runs to see the refresh history. Each row shows the start time, status, duration and type of refresh. The page lists up to 50 refreshes or six months of history, whichever comes first, and OneLake stores up to 250 refreshes or six months. From here you can start a refresh, schedule one, or edit the dataflow.
- Refresh details. Select a start time to see the status, refresh type, start and end time, duration and three IDs: the request ID, session ID and dataflow ID. Keep the request ID when you open a support case.
- Tables. The queries with loading enabled, which are loaded into the dataflow's staging area. Select one for its details.
- Activities. Everything that happened during the refresh, such as loading to an output destination. The activity view shows status, start and end times and, depending on the connector, rows or bytes read and written.
- Download CSV for one or more refreshes.
- Download detailed logs. A ZIP of Mashup engine logs for one run. They appear a few minutes after the refresh and stay available for up to 28 days. You need at least the Viewer role. For gateway refreshes, an admin must enable consent for gateway diagnostics.
- Workspace list. The Status column shows the last refresh and the last save and validation. A red exclamation mark means one of them failed. A failed refresh points you to the refresh history. A failed save or validation points you to the dataflow editor.
- Monitor hub dashboard. Status, start time, duration, submitter, workspace, the capacity used, average refresh duration, refreshes per day and type.
Notebooks and Spark
Spark has several entry points, and all of them lead to the same Spark application details:
- Monitor hub. In-progress and past Spark applications from notebooks, Spark job definitions and pipelines, with search and filters.
- Item recent runs. A notebook's or job definition's own list of current and recent runs, with the submitter, status and duration.
- Notebook contextual monitoring. Inside the notebook, at the cell level, you can watch job progress, see tasks and executors, open Spark logs and read the Spark advisor's real-time advice.
- Spark job definition inline monitoring. Submission and run status in real time, plus past runs and configurations.
- Pipeline Spark activity inline monitoring. The Notebook and Spark job definition activities have deep links to the application details, a snapshot of the notebook or job definition as it ran, and the Spark logs. If the activity fails, the inline error message is shown right in the pipeline.
When you need the cause, go to the application's Logs (the driver's stderr is the first place to look; search for ERROR, Exception or OutOfMemoryError) and the Spark UI: the Executors tab shows failed executors and their exit codes, Stages shows slow or skewed tasks, Storage shows cached data and Environment shows the configuration actually in effect.
Warehouse T-SQL: query insights
In a Warehouse or a lakehouse SQL analytics endpoint, query insights gives you 30 days of history for queries run in a user's context (system queries are not stored). The views live in the queryinsights schema:
exec_requests_history: one row for each completed query, with the text, login, label, CPU time and how much data was scanned from memory, disk or remote storage.exec_sessions_history: completed sessions.long_running_queriesandfrequently_run_queries: aggregated by query shape. Two queries that differ only in their filter values count as the same query, and you can group them byquery_hash.sql_pool_insights: pool-level allocation, configuration changes and pressure.
Completed queries can take up to 15 minutes to appear. You need Contributor or higher to use it, and you can see full query text if you are an Admin, Member or Contributor.
-- The most CPU-hungry queries, and how much data came from remote storage
SELECT TOP 20 start_time, login_name, allocated_cpu_time_ms,
       data_scanned_remote_storage_mb, data_scanned_memory_mb, data_scanned_disk_mb, label, command
FROM   queryinsights.exec_requests_history
ORDER BY allocated_cpu_time_ms DESC;
Comparing remote-storage scans with memory and disk scans tells you whether a query was slow because it read cold data instead of using the cache.
3. Monitor semantic model refresh
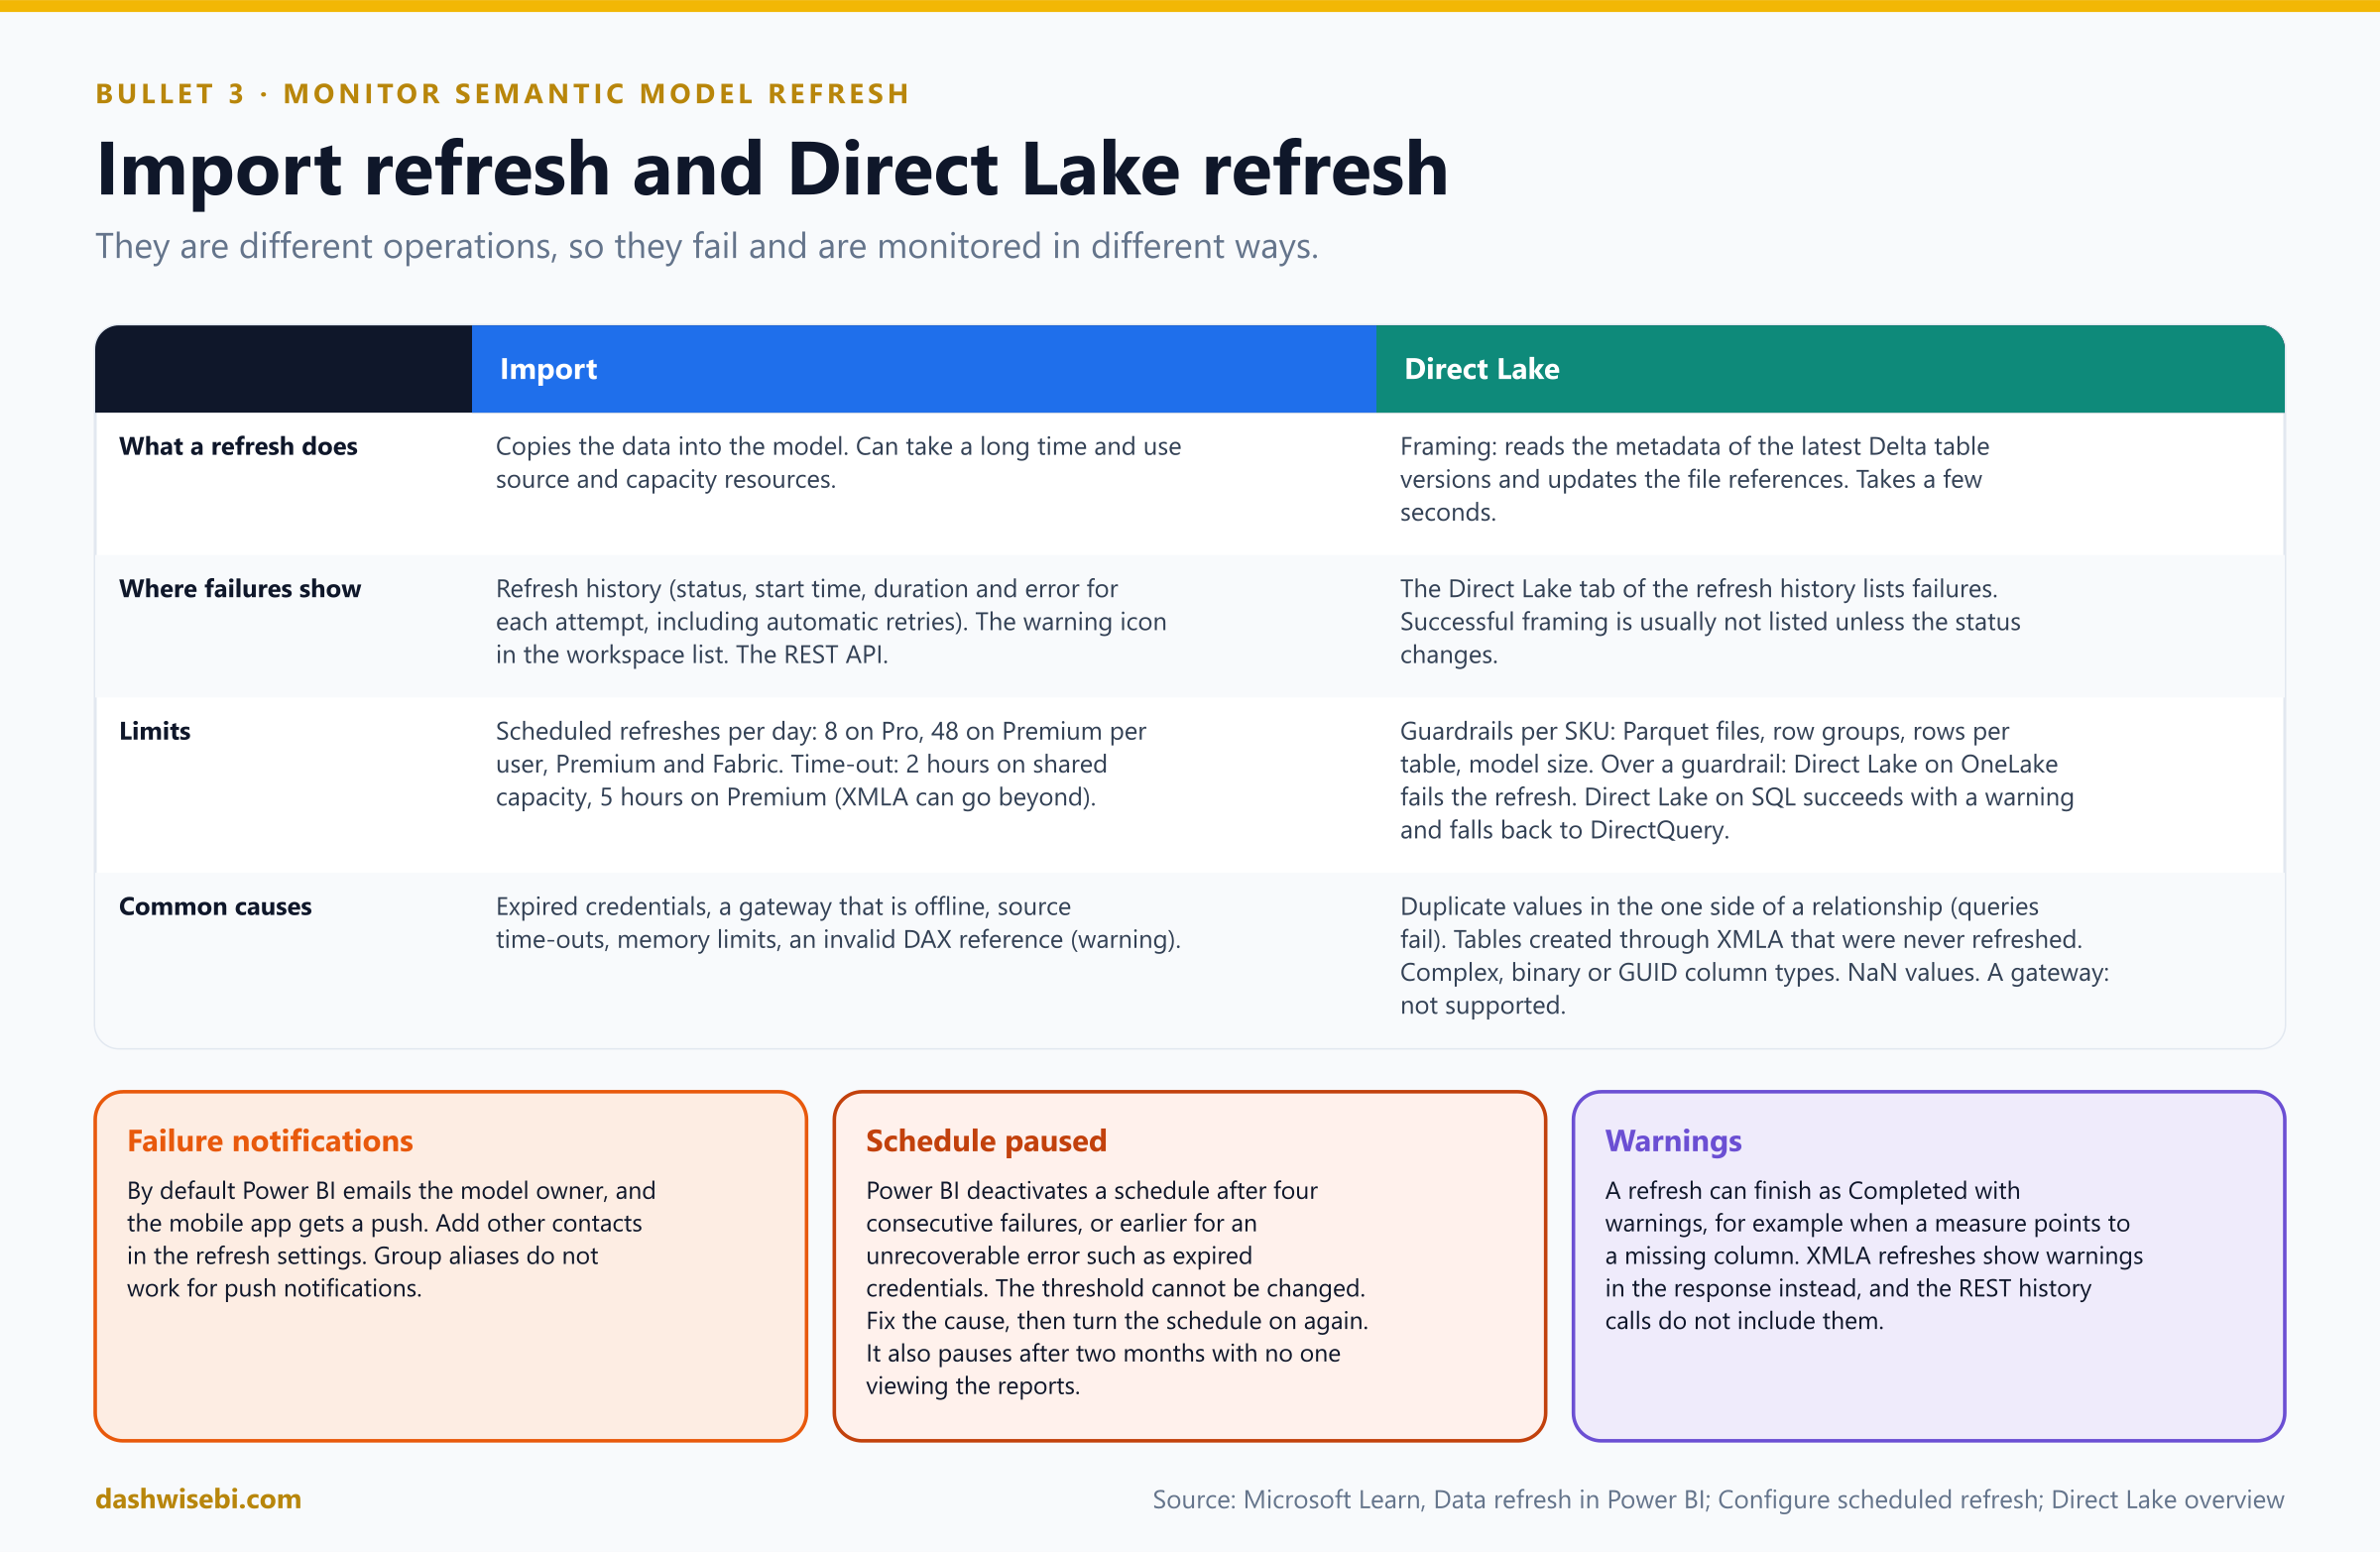
A report is only as fresh as its semantic model. Monitoring the model means checking that refreshes succeed, finish in time, and do not quietly stop.
Where to look
- Refresh history. In the Fabric portal, select the semantic model, then Refresh, Refresh history. For each attempt you see the status, start time, duration and error message. Power BI automatically tries again after a failure, and the history shows those attempts, which explains refreshes that seem to take longer than expected. You can also get it programmatically through the Power BI REST API, so one script can monitor many models.
- Monitor hub. The Job runs page includes semantic models, so a failed refresh sits next to your failed pipelines.
- Workspace icon. A model whose last refresh had an error shows a small warning icon in the workspace list. Select it for details.
- Workspace monitoring. Semantic model operation logs go to the monitoring Eventhouse, so you can query and alert on them.
- XMLA refreshes. A refresh started through the XMLA endpoint appears in the history only if it completes all its stages and loads new data.
Scheduled refresh rules
- How often. Up to 8 scheduled refreshes per day with Power BI Pro, and up to 48 with Premium per user, Premium or a Fabric capacity.
- When it starts. The target is within 15 minutes of the scheduled slot. It can be delayed up to an hour if resources are short, and it can begin up to five minutes early.
- How long. A refresh must finish within two hours on shared capacity. On Premium the maximum is five hours, and refreshing through the XMLA endpoint can go beyond that. Very large models should use incremental refresh.
- Four strikes. Power BI deactivates the schedule after four consecutive failures, or sooner when it detects an unrecoverable error that needs a configuration change, such as invalid or expired credentials. You cannot change the threshold. Fix the cause, then set Configure a refresh schedule back to On and select Apply.
- Inactivity. A schedule is paused after two months in which nobody views a report or dashboard built on the model. Opening one resets the counter.
- Refresh with a pipeline. For dependencies, cascades or a monthly cadence, use a Fabric pipeline with a refresh template.
Warnings are not failures
A refresh can finish with the status Completed and still carry a warning, for example when a measure refers to a column that no longer exists, when a column type does not match, or when the gateway is outdated. The data is updated, but the affected calculations may return errors or blanks. Check the history for warnings now and then. Two details: refreshes started through XMLA show warnings in the XMLA response instead of the history, and the REST API history calls do not include warnings.
Direct Lake is different
A refresh of an Import model copies data into the model, which can take a long time and use a lot of capacity. A refresh of a Direct Lake model is framing: it reads the metadata of the latest Delta table versions and updates the file references, which takes seconds. So the questions change:
- Failures appear on the Direct Lake tab of the refresh history. Successful framing is usually not listed unless the status changes, for example from a failure to a success.
- Each Fabric SKU has guardrails for Parquet files, row groups, rows per table and model size. If you exceed one, a Direct Lake on OneLake model fails its refresh and cannot be queried until you optimize the Delta tables. A Direct Lake on SQL model succeeds with a warning and falls back to DirectQuery, which is slower.
- Tables created by XMLA tools stay unprocessed until a refresh runs, and queries on them fail (or fall back).
- The one side of a relationship must hold unique values. Duplicates make queries fail.
- Complex Delta column types, binary and GUID types, and NaN values are not supported.
- A gateway cannot be used. Direct Lake works only with cloud connections.
4. Configure alerts
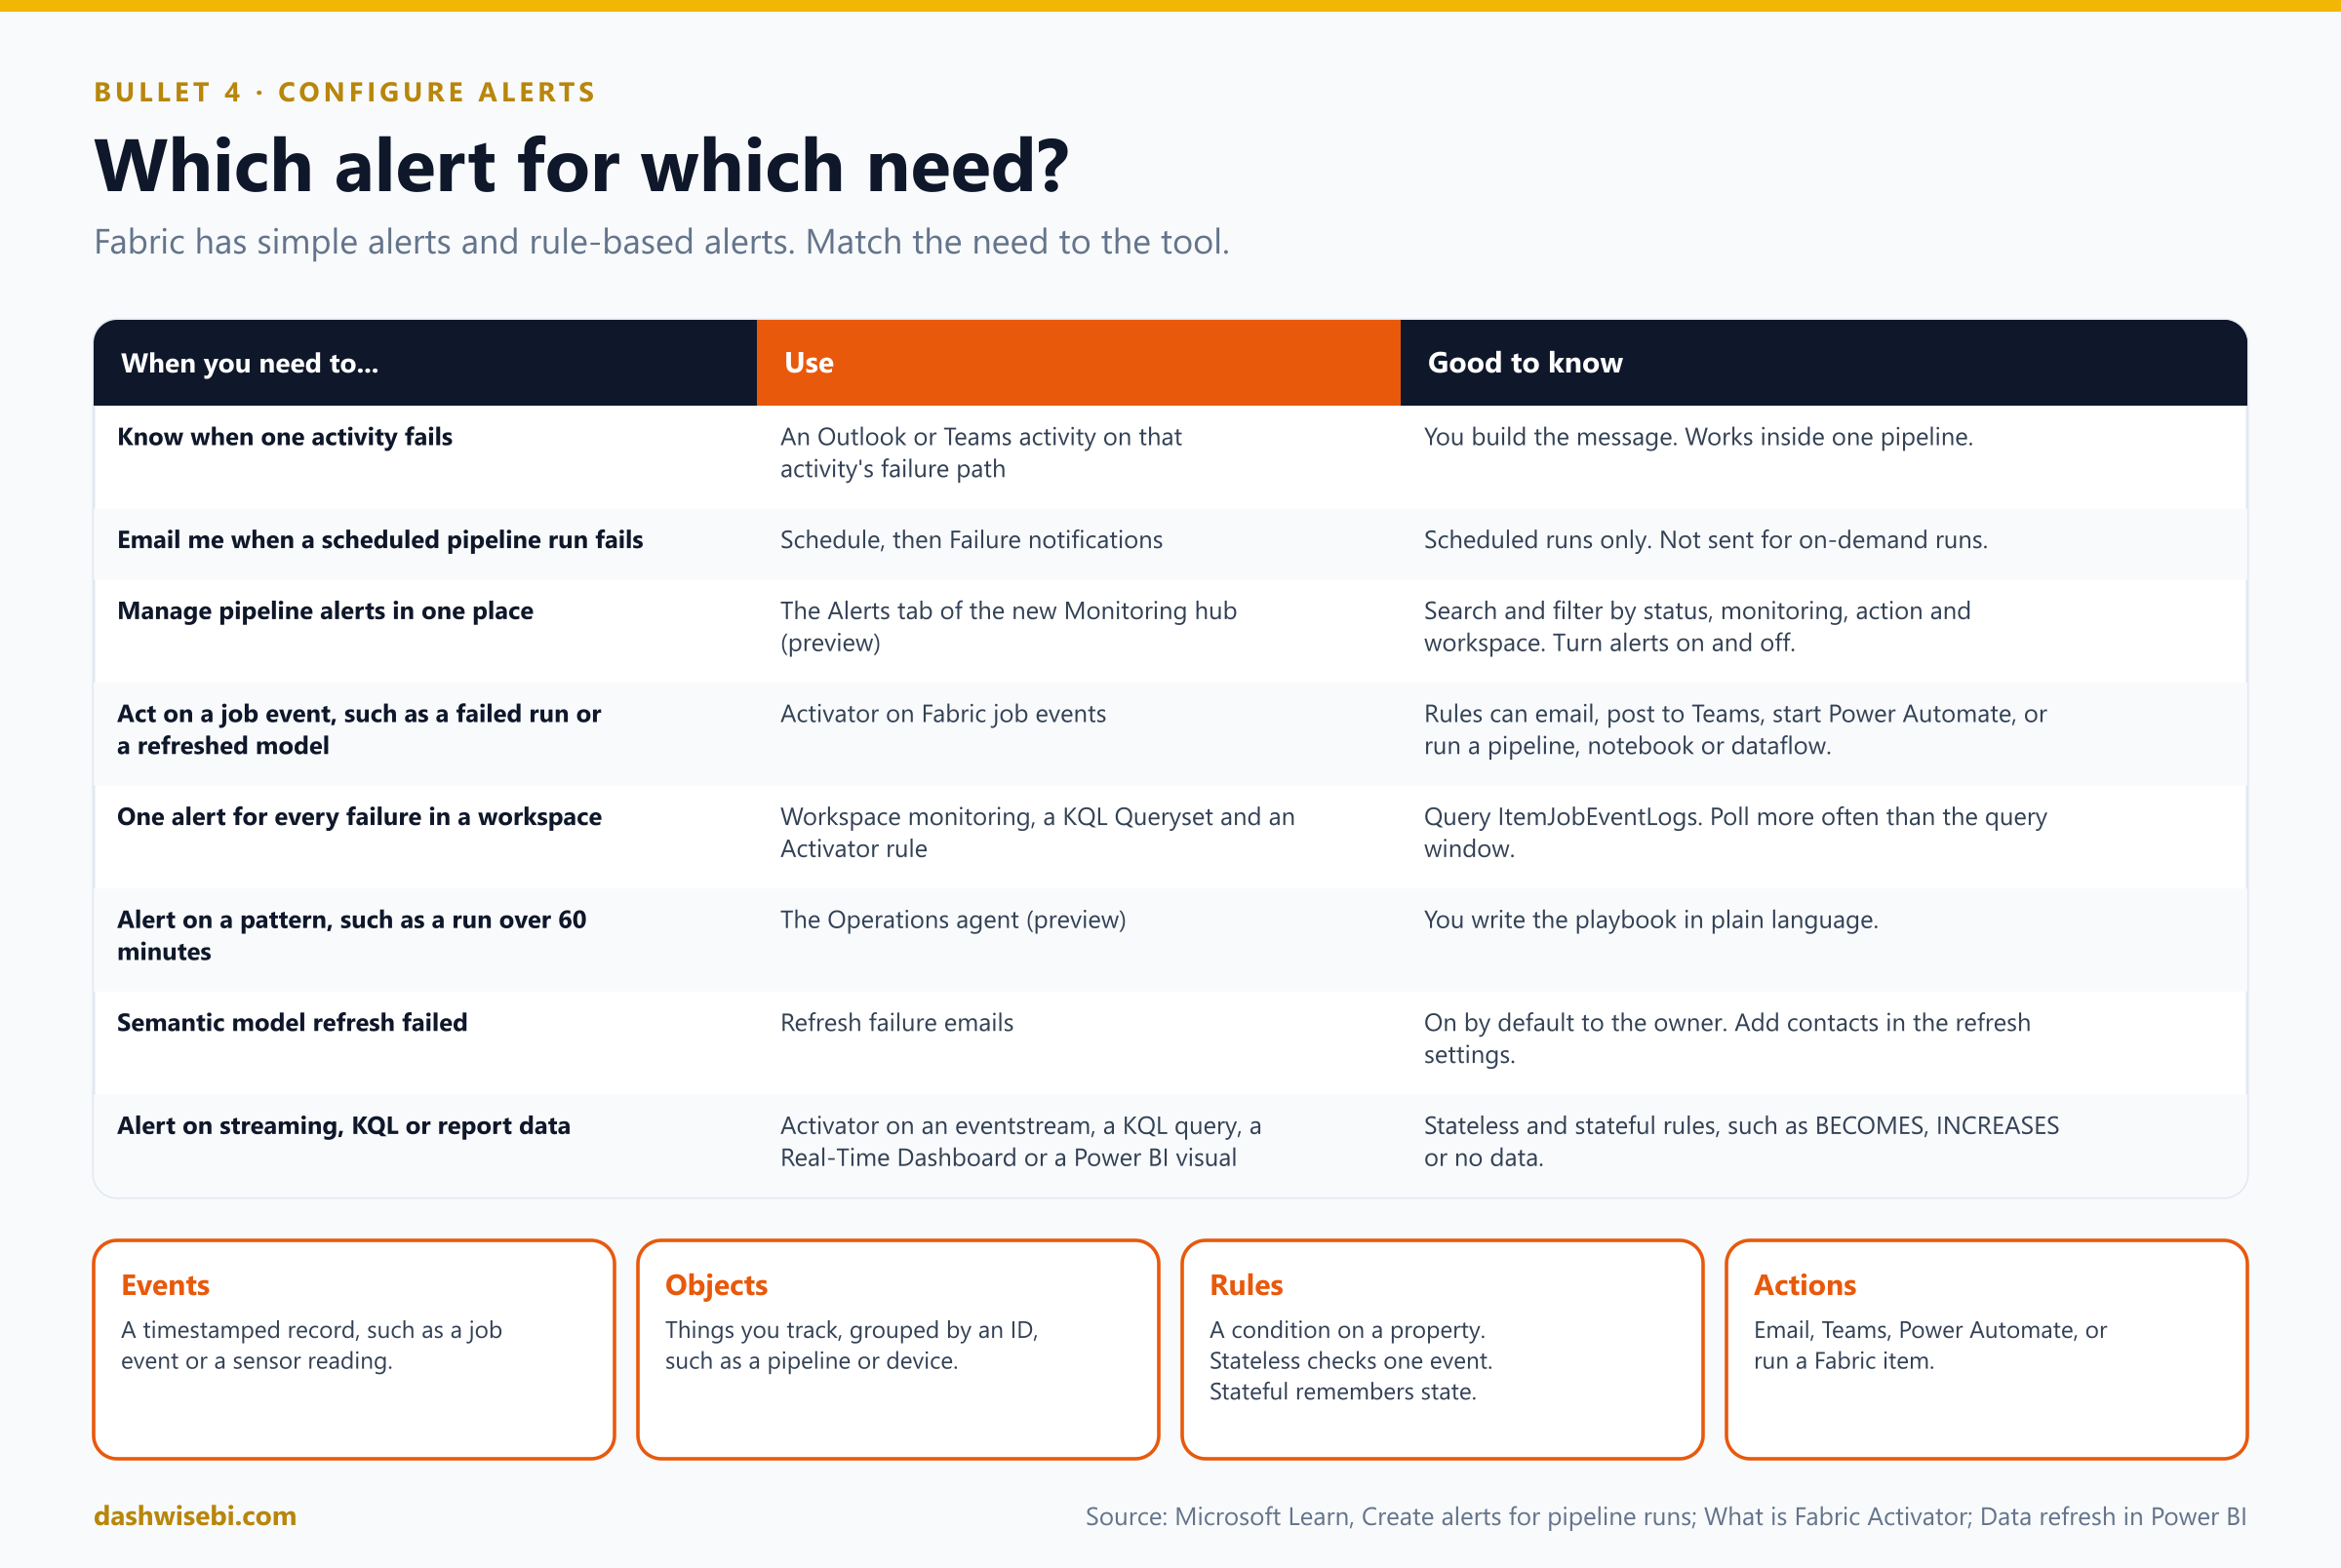
Monitoring only helps if you look. Alerts look for you. Fabric offers several, from a simple email to rules that react to data.
Alerts for pipelines
- Activity level. Add an Outlook activity (email) or a Teams activity after the activity you want to watch, usually on its failure path. You write the message and can include the error.
- Scheduled-run failure emails. In the pipeline, Home, Schedule, then add users or groups under Failure notifications. They apply to scheduled runs only, not to on-demand runs.
- Pipeline alerts in the new Monitoring hub (preview). The Alerts tab lets you search and filter alerts by status, monitoring, action and workspace, turn alerts on or off without recreating them, and configure notifications.
- Activator for advanced cases. Create an Activator item, use Get data, Job events, pick the pipeline and the event, then choose an action such as email or a Teams message. This also covers pipeline creation, update and deletion events.
- Workspace level. With workspace monitoring on, one KQL query over
ItemJobEventLogscan catch failures from every pipeline. Save it in a KQL Queryset, create an Activator rule on the Queryset, add an email or Teams action, and enable it. The Activator must check more often than the time window in your query, or it can miss events. A shorter window reduces duplicates and a longer one catches more failures. - Operations agent (preview). An AI agent that reads the monitoring Eventhouse and alerts you in Teams or by email from a playbook you write in plain language, for example "tell me when a pipeline run takes more than 60 minutes". It can also investigate a failed pipeline run from the Monitor hub and suggest likely causes without changing anything.
ItemJobEventLogs
| extend SecondsAgo = datetime_diff('second', now(), ingestion_time())
| where JobType == 'Pipeline' and JobStatus == 'Failed'
| where SecondsAgo <= 540
| project Timestamp, ItemName, WorkspaceName, JobStartTime, JobEndTime, JobStatus
Alerts for other items
- Semantic models. By default Power BI emails the model owner when a refresh fails, and sends a push notification to the Power BI mobile app. It also emails when it disables a schedule after consecutive failures. Add more recipients in Email these contacts when the refresh fails. They get email and push notifications, but push does not support group aliases. Keep the owner checkbox on, and make sure spam filters do not hide these emails.
- Dataflow Gen2. If a scheduled refresh fails over and over, Fabric pauses the schedule and emails the dataflow owner (the exact rules are in section 6).
- Streaming and real-time data. Activator can watch an eventstream, a Real-Time Dashboard or a KQL query, and a Power BI report visual (for example a new row in a table visual).
Fabric Activator in one minute
Activator is a no-code event detection engine. It watches a data source and acts when a condition is met. The vocabulary is worth knowing:
- Event sources: eventstreams, Fabric events (such as a failed pipeline or a refreshed semantic model), Azure events (such as a new blob), Power BI reports, Real-Time Dashboards, and results of a Warehouse SQL query on a schedule (preview).
- Events are timestamped records. They are grouped into objects by an ID column, such as a device or a pipeline, and rules run per object. Properties are the fields you monitor.
- Rules are stateless (judge each event alone, such as
value < 50) or stateful (remember the previous state:BECOMES,INCREASES,DECREASES,EXIT RANGE, or no data for a while). A rule fires when it enters a new state, so an unchanged condition does not alert again and again. - Lookback period. How much history a rule needs, for example six hours to compute a three-hour average even when data arrives late.
- Actions: email, a Teams message, Power Automate, or running a Fabric item: a pipeline, notebook, Spark job definition, dataflow, Copy job or user data function. You can even rerun failed work automatically by triggering a pipeline from a failure event.
- Cost. Activator runs on your capacity, and you pay only while rules are active. Preview the impact of a rule on historical data before you activate it to avoid alert spam.
5. Identify and resolve pipeline errors
Pipeline questions on the exam are usually small stories: a copy fails with a certain message, an alert does not arrive, a rerun duplicates rows. Start with the method, then learn the common causes.
How a failure is handled
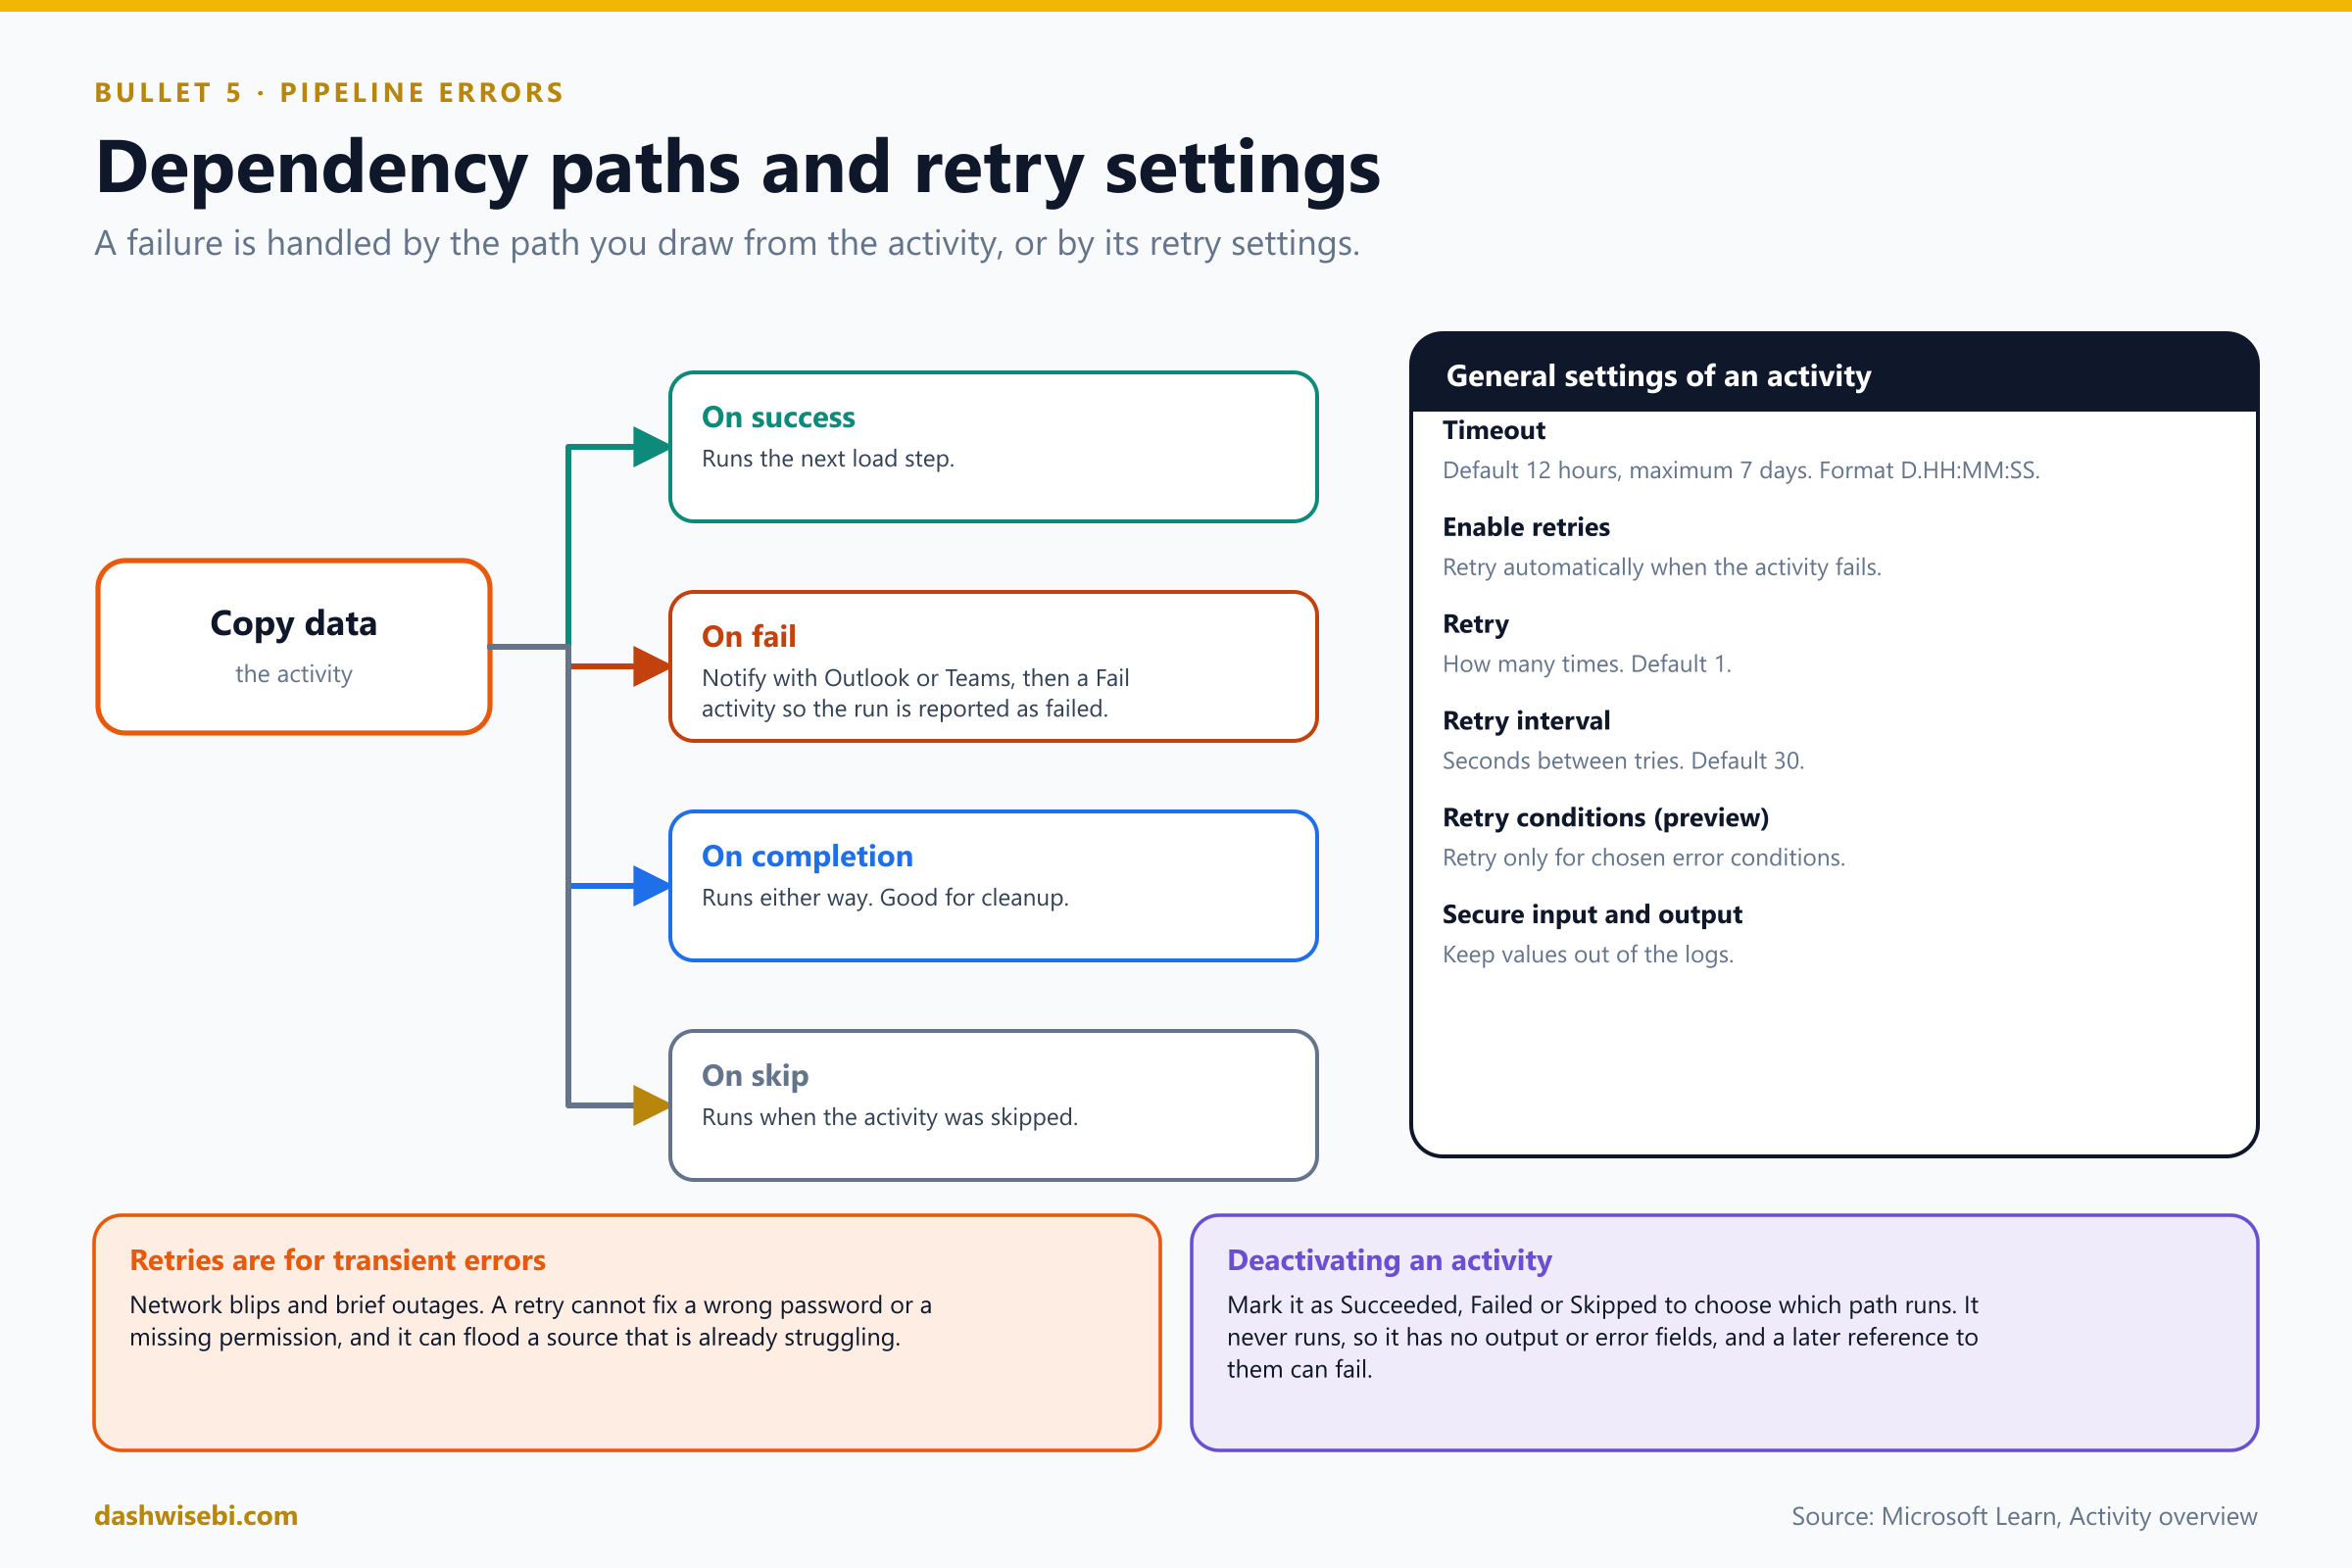
- Dependency paths. Each activity has outgoing paths: On success, On fail, On completion (runs either way) and On skip. They are how you build error handling: send a notification on the failure path, clean up on the completion path.
- Fail activity. It makes the pipeline fail with a custom message and error code. A common pattern is: On fail, notify with Teams or Outlook, then a Fail activity, so you get the message and the run still shows as failed.
- If Condition, Switch and Until let you branch and loop, for example to wait until a file arrives.
- Timeout. The default is 12 hours and the maximum is 7 days (format
D.HH:MM:SS). Set a realistic value so a hung activity does not run for half a day. - Retries. Turn on Enable retries, then set Retry (default 1) and Retry interval in seconds (default 30). Retry conditions (preview) limits retries to certain errors. Retries are for transient problems such as network timeouts and short outages, not for a wrong password.
- Secure input and output keep an activity's values out of the logs.
- 120 activities. A pipeline can have up to 120 activities by default, counting inner activities in containers. Split bigger designs into child pipelines with Invoke pipeline.
- Deactivate an activity to skip it without deleting it, and choose to mark it as Succeeded, Failed or Skipped to decide which path runs. Be careful: an inactive activity never runs, so it has no output or error fields, and a later reference to them can throw an error. It is also a handy way to stop a failing copy from hammering a fragile source with retries.
Common errors and fixes
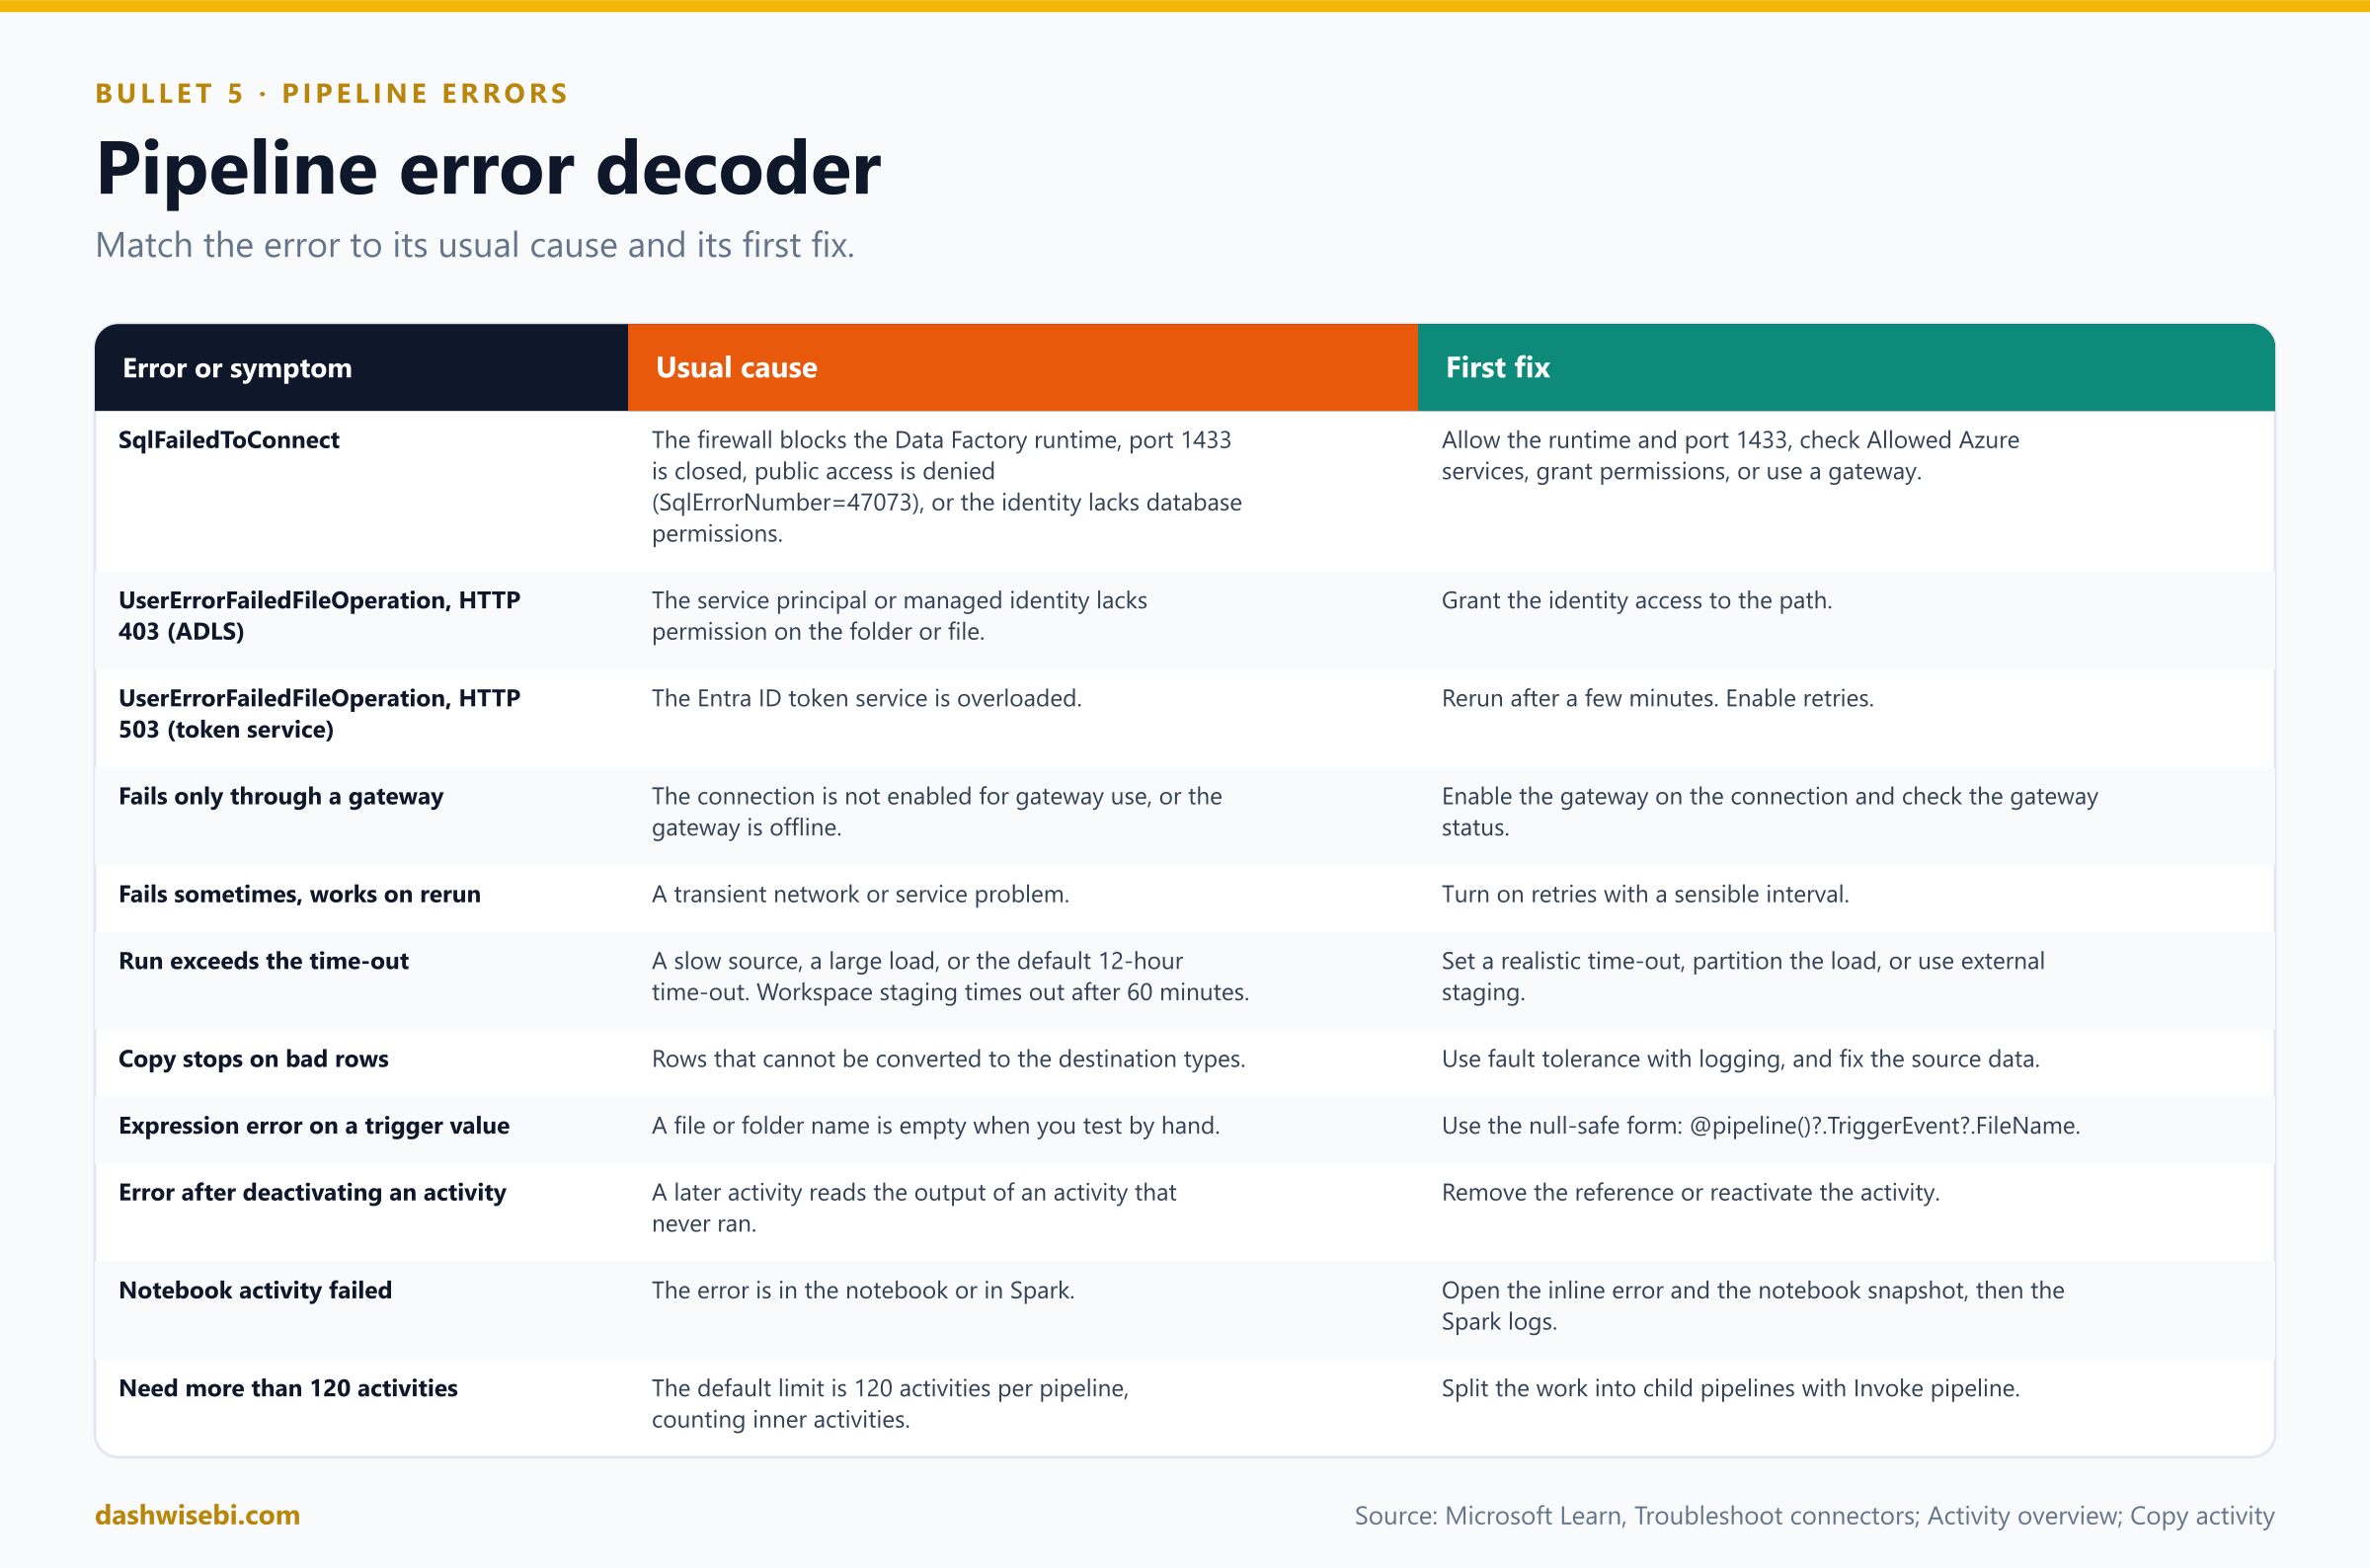
SqlFailedToConnecton a SQL source or destination: the database firewall must allow the Data Factory runtime. Check that port 1433 is open, that Allow Azure services is set if you rely on it, and that the identity has permission in the database. For Azure SQL,SqlErrorNumber=47073means public network access is denied. If the copy goes through a gateway, the connection must be enabled for gateway use.UserErrorFailedFileOperationon Azure Data Lake Storage: a 403 means the service principal or managed identity lacks permission on the folder or file. A 503 from the Entra ID token service means it is overloaded, so rerun after a few minutes (retries help here).- It works sometimes. A copy that fails now and then and succeeds on rerun points to a transient problem. Add retries with a sensible interval.
- It times out. Check the activity time-out, partition the load or move to a larger throughput setting. Remember that workspace staging times out after 60 minutes. Use external staging for long jobs (Episode 6).
- It stops on bad rows. Turn on fault tolerance (skip incompatible rows) and logging, then fix the source data. Add data consistency verification if you must prove nothing else was lost.
- A trigger expression fails when you test by hand. File and folder names from a storage event are empty in a manual run, so use the null-safe form
@pipeline()?.TriggerEvent?.FileName. - A Notebook activity fails. The pipeline shows the inline error. Open the notebook snapshot and the Spark logs to find the real cause (section 7).
- Nothing starts, or runs wait. Check capacity: a paused or throttled capacity stops jobs. The Job runs status shows Queued or Not started.
Rerun the smart way
From the pipeline run detail view, Rerun lets you start the entire pipeline, start from the failed activity, or start from a selected activity. Rerunning from the failure saves time because activities that already succeeded are not repeated. But it also means a partly done step can run twice. This is why the idempotent loads of Episode 7 matter: with an upsert or a replaced slice, a rerun gives the same table. With plain appends it can produce duplicates.
6. Identify and resolve Dataflow Gen2 errors
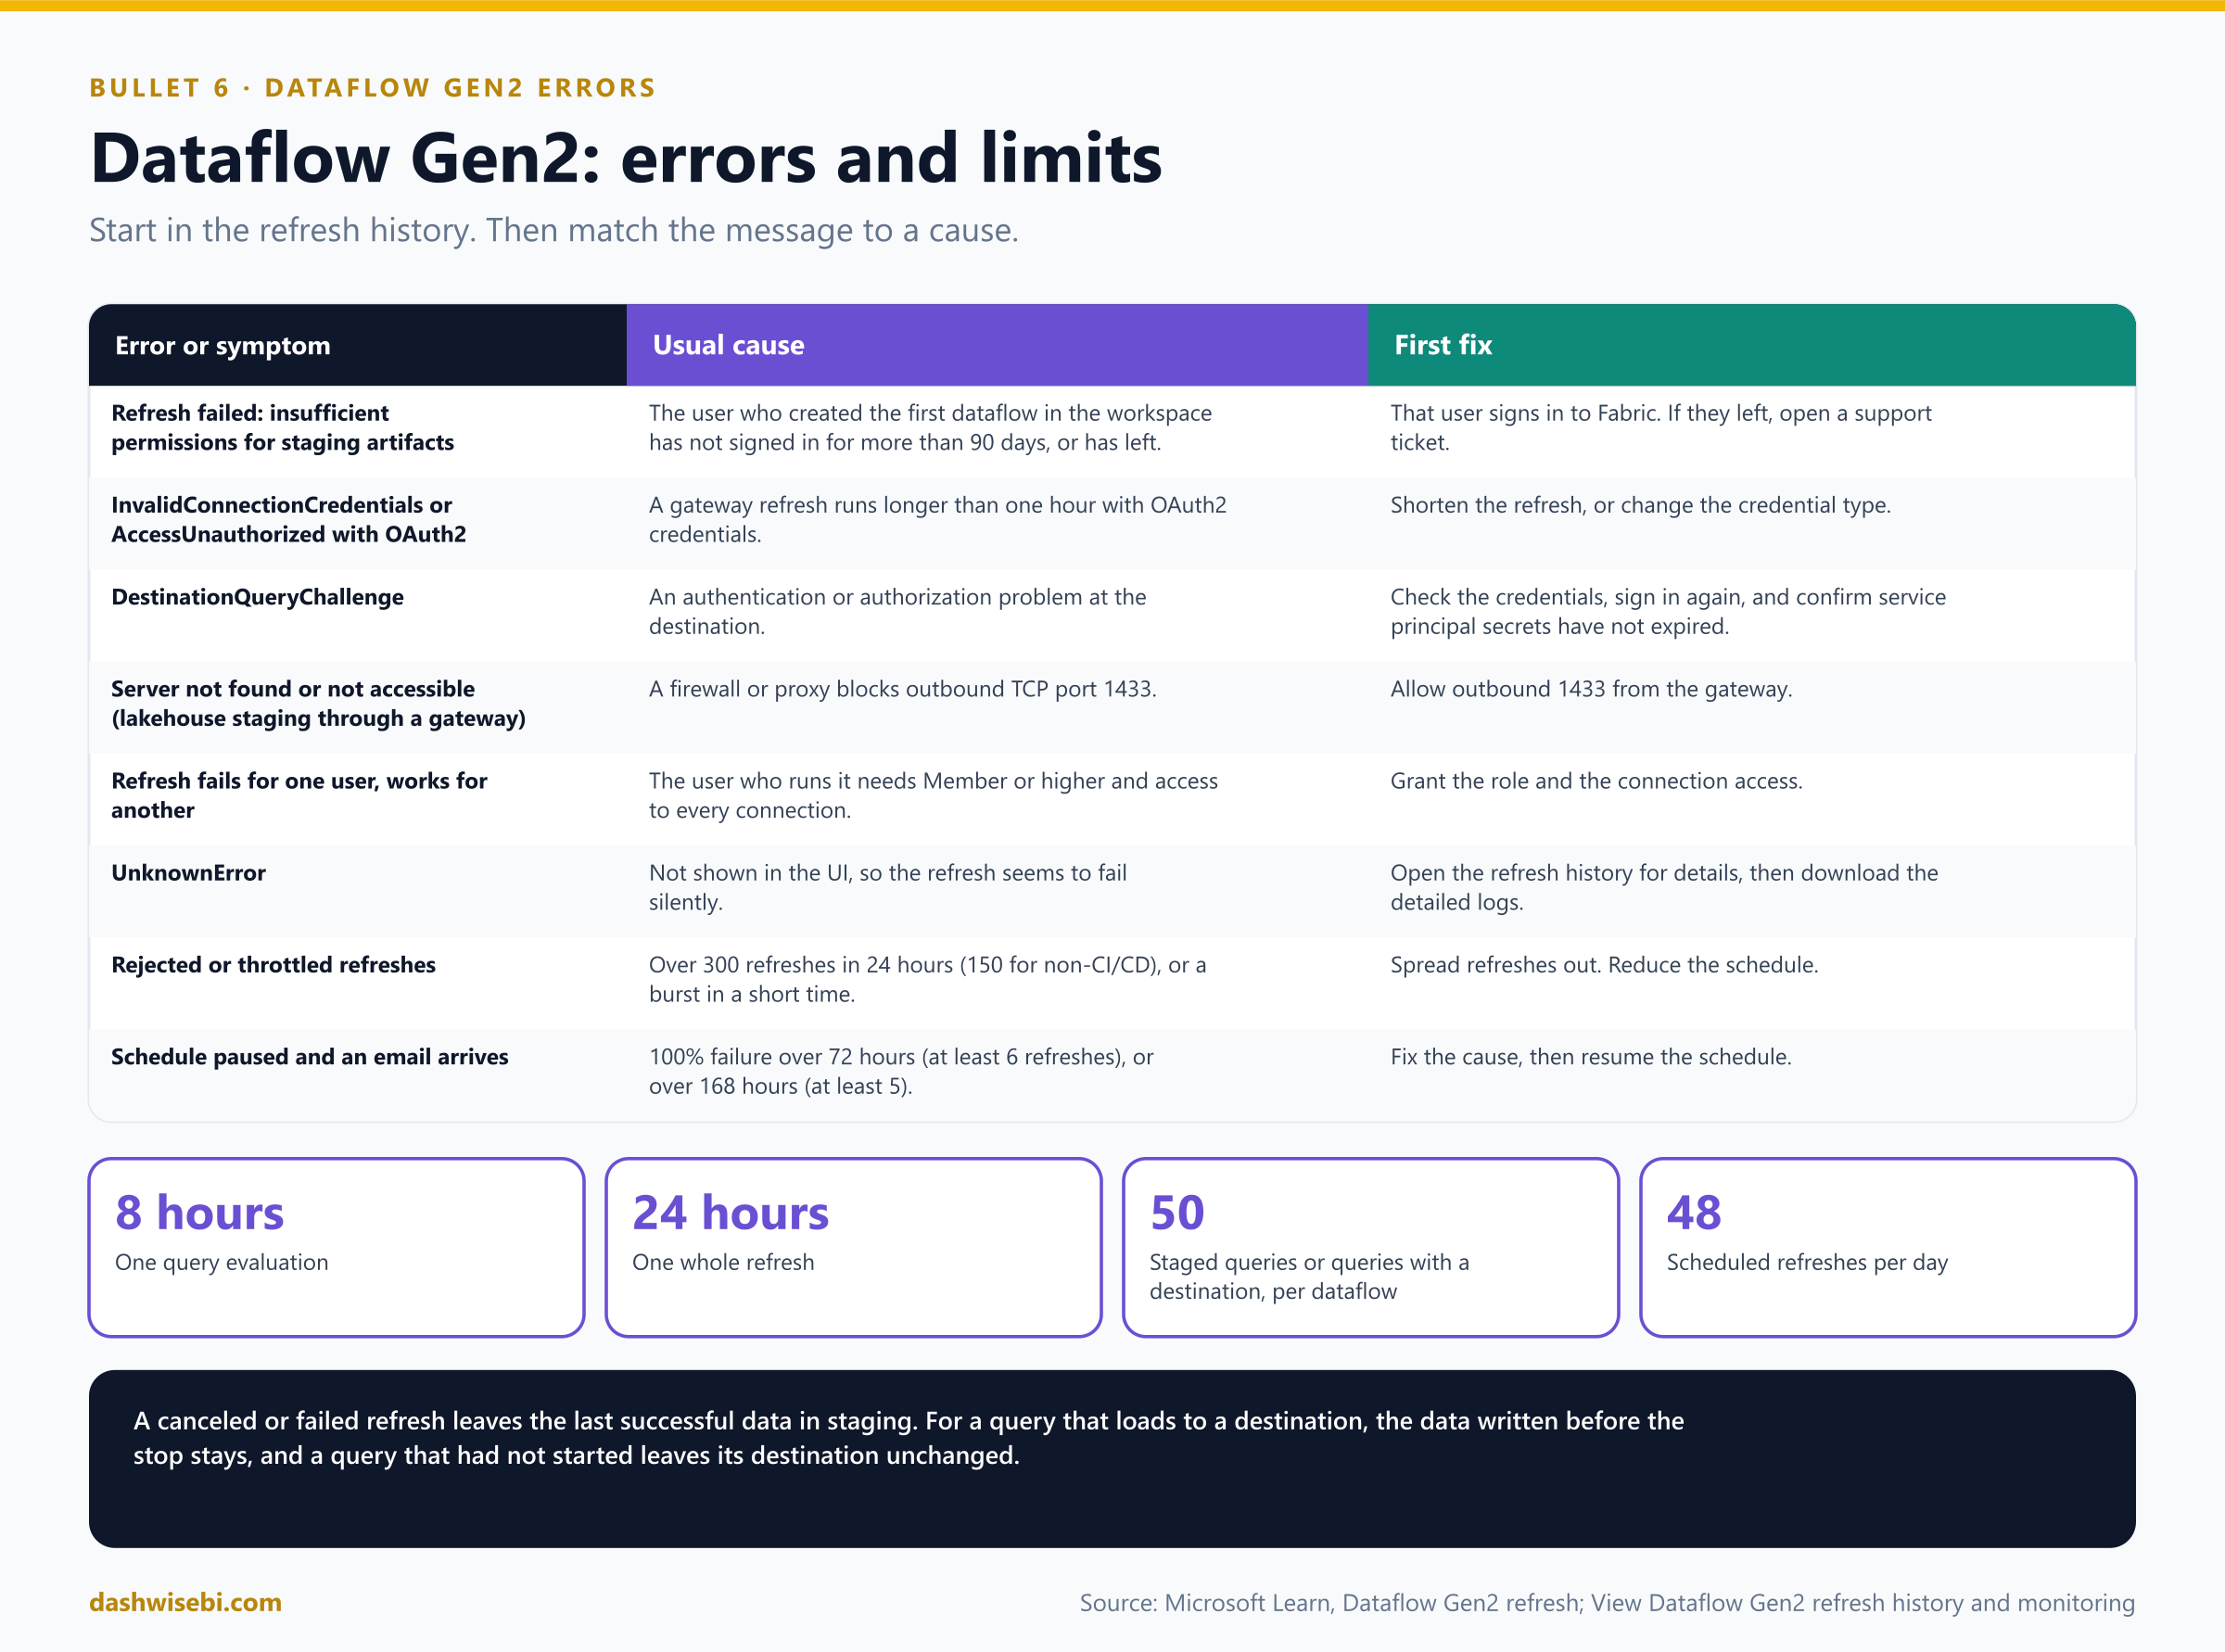
Start in the refresh history (section 2): open the failed refresh, look at which table or activity failed, and read its error. If the message is not enough, download the detailed logs. Then match it with the common causes.
Who can refresh
The person who triggers a refresh needs Member (or higher) access to the workspace and access to every connection the dataflow uses. Refresh can be on demand (including the automatic refresh after you publish, or a Dataflow activity in a pipeline) or scheduled, up to 48 times per day. If at least one query uses a gateway, all queries of that dataflow use the gateway for data movement.
Common errors
- "The dataflow refresh failed due to insufficient permissions for accessing staging artifacts." The user who created the first dataflow in the workspace has not signed in to Fabric for more than 90 days, or has left the organization. The user named in the message should sign in. If they have left, open a support ticket.
InvalidConnectionCredentialsorAccessUnauthorizedwith OAuth2. A refresh through a gateway that runs longer than one hour can fail with these errors even after you updated the credentials, because the gateway does not support OAuth2 refreshes longer than an hour.DestinationQueryChallenge. An authentication or authorization problem when the dataflow connects to the destination. Check that the credentials are still valid, sign in again, and confirm that a service principal's secret has not expired.- "Server not found or not accessible" with a lakehouse through a gateway. Reading staged data needs outbound TCP port 1433 from the gateway. A firewall or proxy is probably blocking it.
UnknownError. It is not shown in the UI, so the refresh seems to fail silently. Open the refresh history for the details.- Staging re-authentication. Staging items that go unused for a long time (over 90 days) need sign-in again, which you can do by creating a new Dataflow Gen2 in the same workspace.
Limits that cause errors
- Refresh count. Each dataflow can refresh up to 300 times in a rolling 24 hours (150 for non-CI/CD dataflows). Over the limit, refreshes are rejected until usage drops. A burst in a short time can also be throttled, even if the daily total is fine.
- Schedule pausing. If scheduled refreshes keep failing, Fabric pauses the schedule and emails the owner. The rules are a 100% failure rate over 72 hours with at least 6 refreshes, or over 168 hours with at least 5 refreshes.
- Time. One query evaluation is limited to 8 hours, and a whole refresh to 24 hours.
- Queries. Up to 50 staged queries or queries with an output destination (or a mix) per dataflow.
Cancel and its effects
You can cancel a refresh from the workspace list or lineage view, for example when the capacity is near its limit. A canceled or failed refresh leaves different results depending on where the query writes: a query loading to staging keeps the data from the last successful refresh; a query loading to a destination keeps the data written up to the point of the stop; and a query whose destination load had not started leaves its destination unchanged. Because a destination can be partly updated, design loads so a rerun fixes it, with replace or merge rather than append.
7. Identify and resolve notebook errors
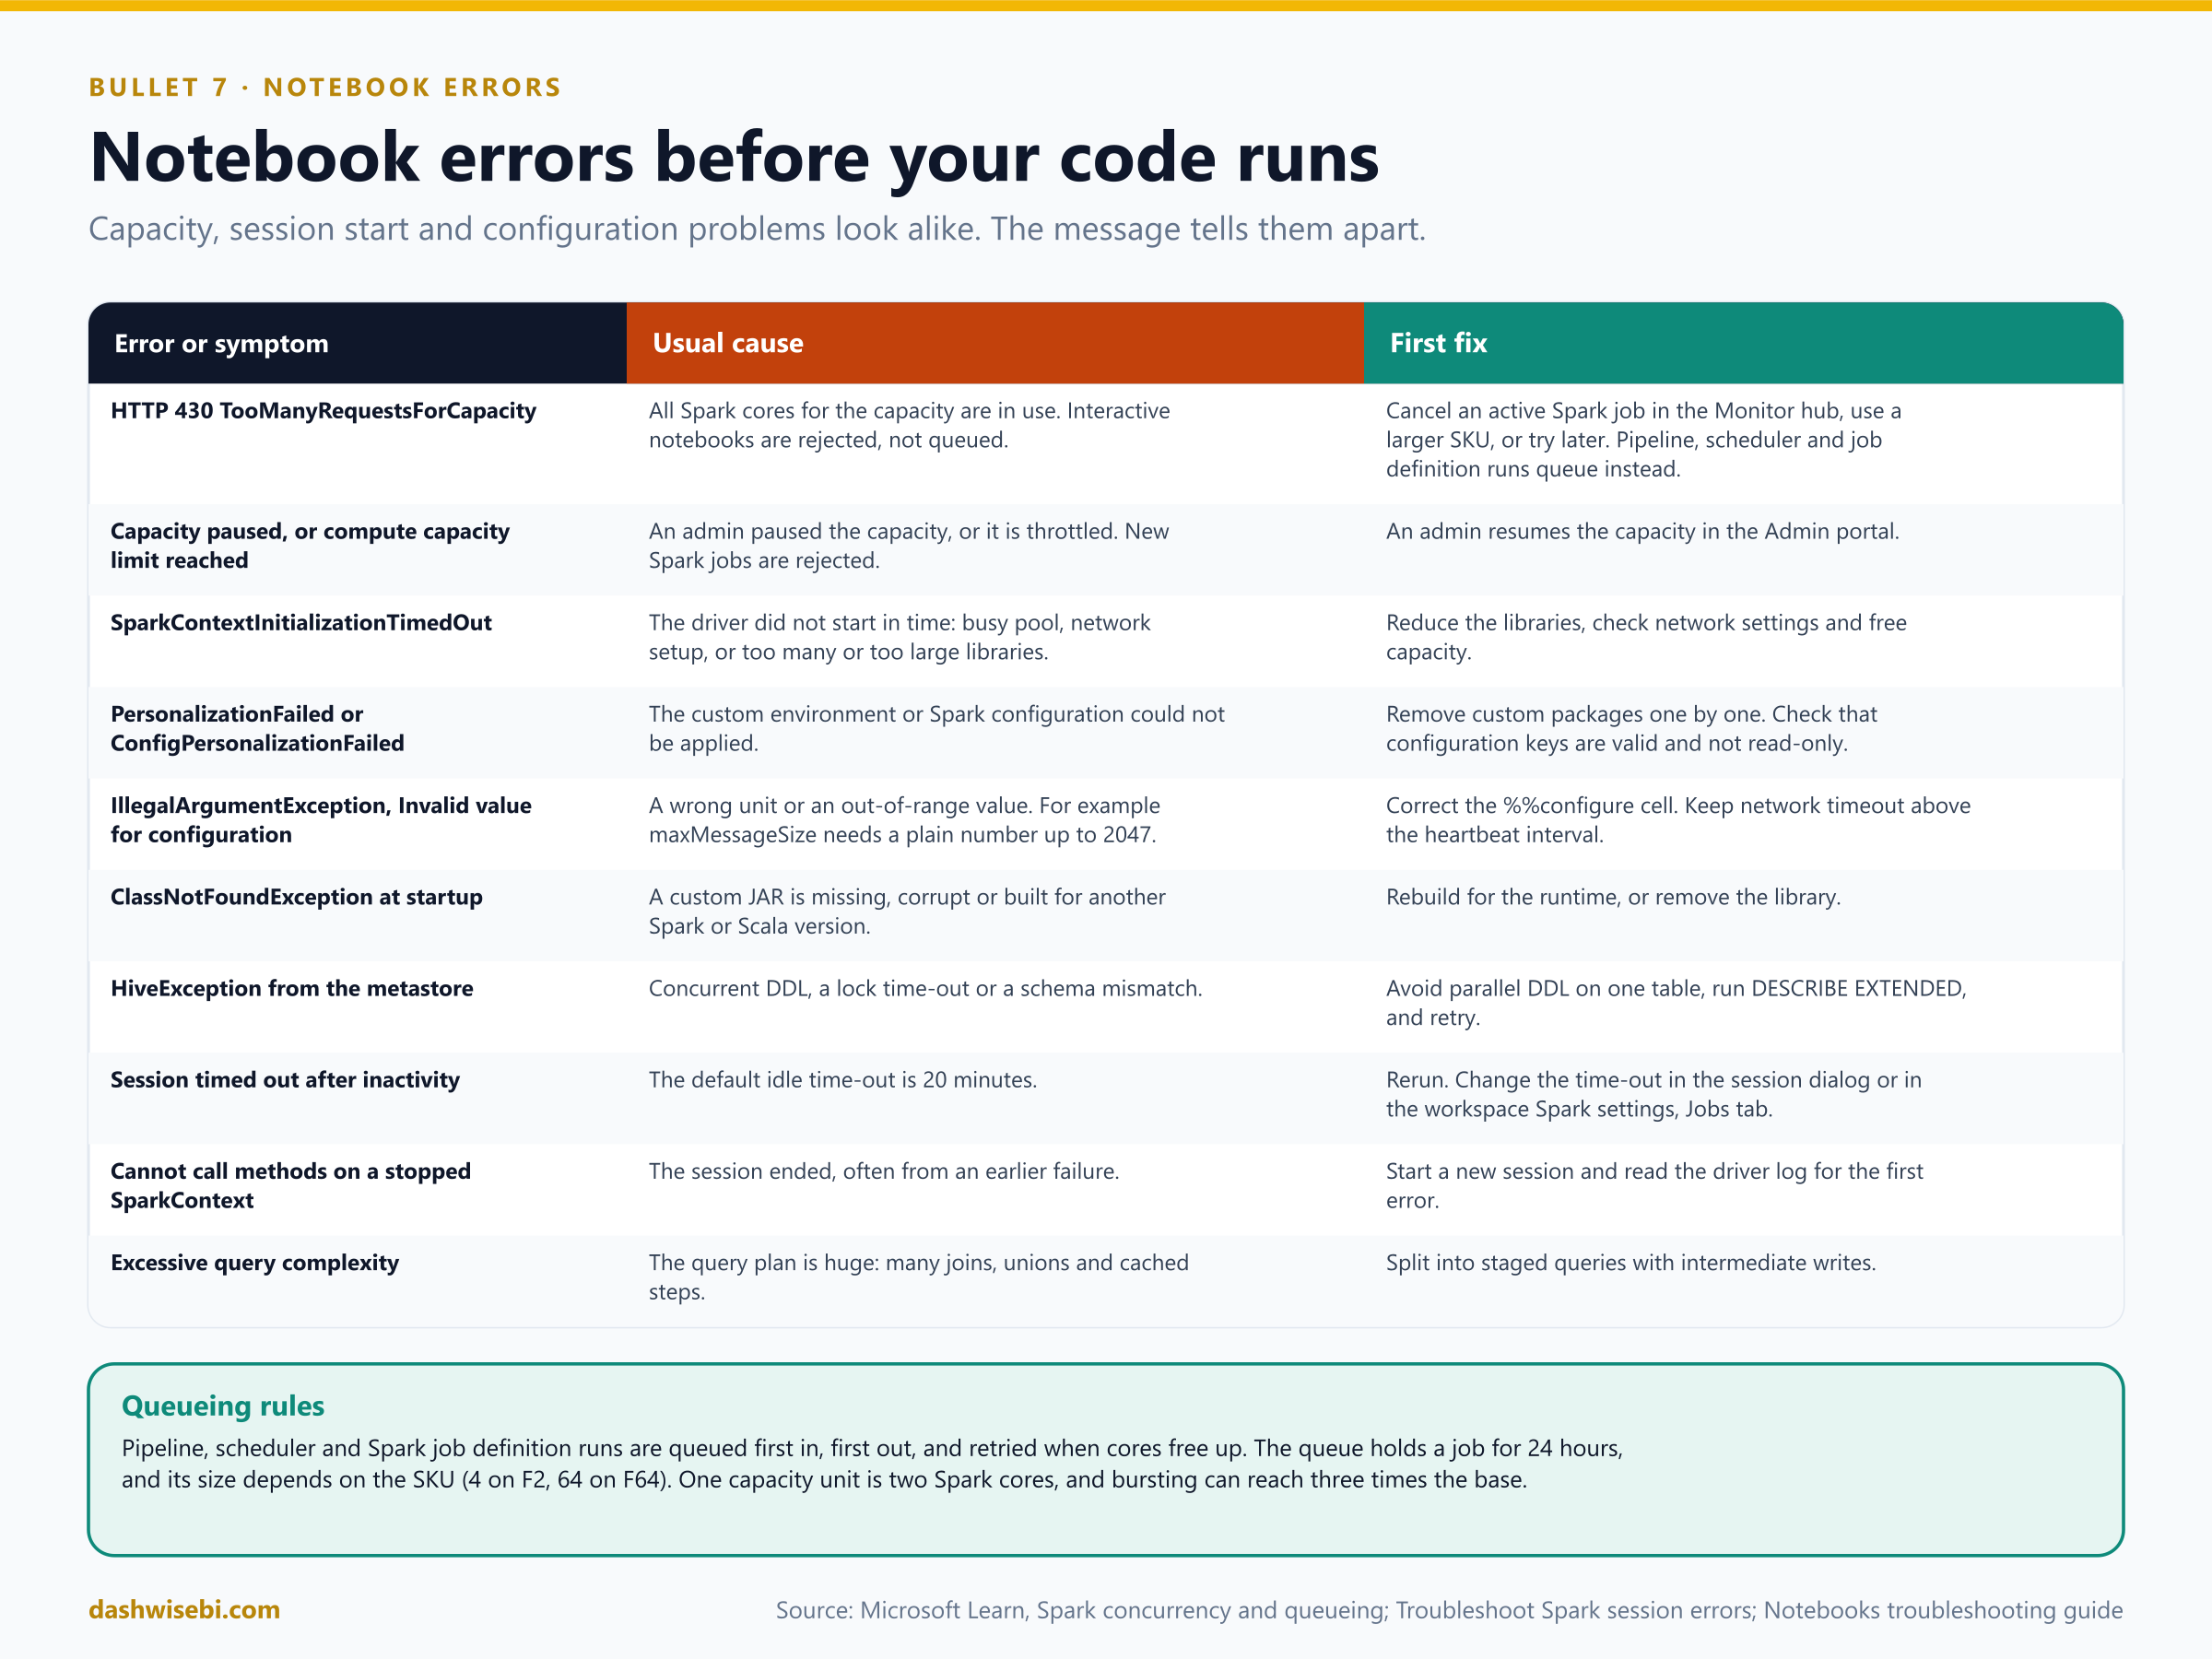
A notebook can fail in the notebook itself (a code error), in Spark (memory, configuration), or before it even starts (capacity, session). Read the message first and put it in one of those groups. When a cell or Spark job fails, Fix with Copilot appears under the cell with an error summary, a likely root cause and a suggested fix.
Errors before your code runs
- HTTP 430,
TooManyRequestsForCapacity. You have hit a Spark compute or API rate limit: all the Spark cores of the capacity are in use. Cancel an active Spark job in the Monitor hub, use a larger capacity SKU, or try again later. One capacity unit equals two Spark cores, and bursting can reach three times the base. For example an F64 has 128 Spark cores and up to 384 with bursting. - Queueing. Jobs started from pipelines, the scheduler and Spark job definitions are placed in a first-in, first-out queue and retried automatically when cores free up. Interactive notebooks and notebook jobs started through the public API are not queued, so they get the 430 error. The queue size depends on the SKU (4 for an F2, 64 for an F64) and jobs expire after 24 hours. If the capacity is throttled, new Spark jobs are rejected instead of queued.
- Capacity paused. The message says the capacity is paused or your organization has reached its compute limit. A capacity admin resumes it in the Admin portal, under Capacities.
SparkContextInitializationTimedOut. The driver did not start in time. Causes are a busy pool, network setup (virtual networks, private endpoints) and custom libraries that take too long to install. Reduce the number and size of libraries.PersonalizationFailedandConfigPersonalizationFailed. The custom environment or the Spark configuration could not be applied. Remove custom packages one by one, and check that configuration keys are valid and not read-only.IllegalArgumentExceptionor a session killed at startup (exit code 13). Usually an invalid configuration: a wrong unit (spark.rpc.message.maxSizetakes a plain number such as512, not512m, and has a maximum of 2047), orspark.network.timeoutset lower thanspark.executor.heartbeatInterval. Some keys are read-only in Fabric and cannot be changed.ClassNotFoundExceptionat startup. A custom JAR is missing or was built for another Spark or Scala version.HiveExceptionfrom the metastore. Concurrent DDL on one table, a lock time-out, or a schema mismatch. Avoid running several ALTER, DROP or CREATE statements on the same table from different notebooks, check the schema withDESCRIBE EXTENDED, and retry.- Session timed out after inactivity. Idle sessions stop after 20 minutes by default. Change it in the session status dialog (per notebook) or in Workspace settings, Data Engineering/Science Spark settings, Jobs tab.
- "Cannot call methods on a stopped SparkContext". The session ended, often because of an earlier failure. Start a new session and look for the first error in the driver log.
- "Excessive query complexity". A huge query plan from many chained joins and steps. Break the work into stages with intermediate writes.
Errors while Spark runs
The Spark error Spark_Ambiguous_Executor_MaxExecutorFailures means too many executors crashed, and it is always a symptom. Find out why they failed. Open the Spark UI Executors tab and read the exit code:
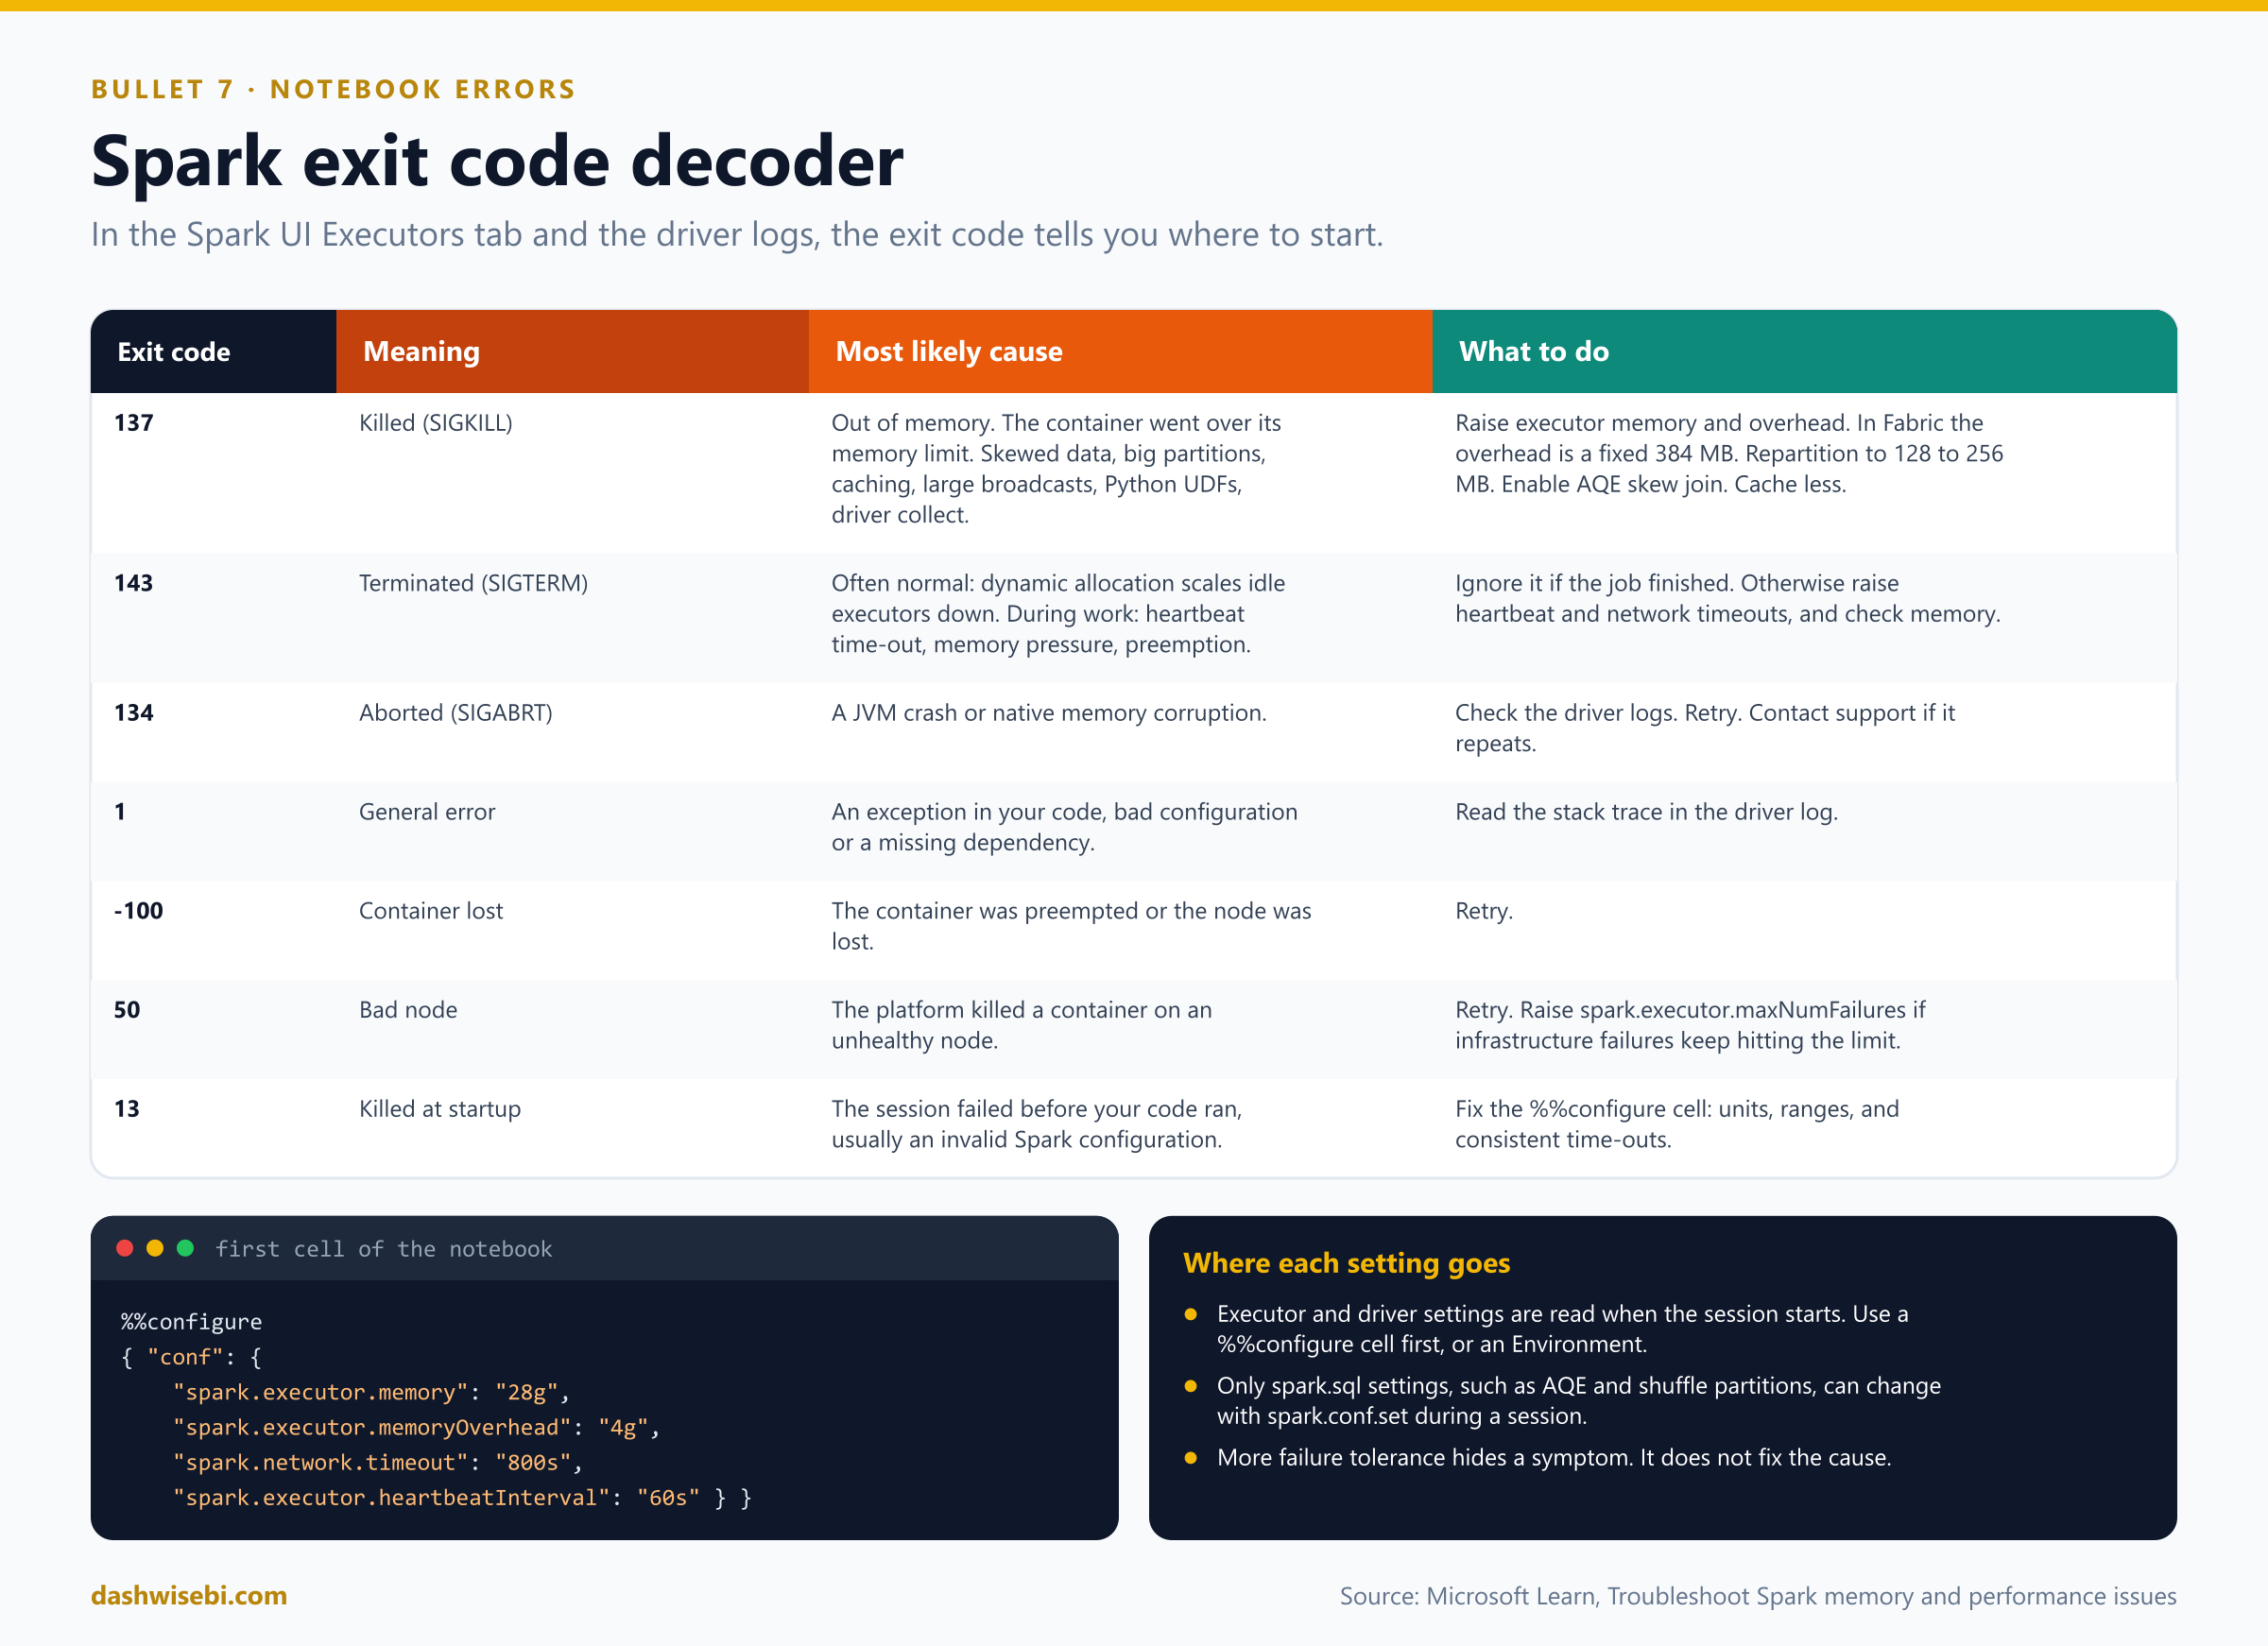
- 137, out of memory. The most common one. The executor's container exceeded its memory limit (heap plus overhead). In Fabric the memory overhead is a fixed 384 MB regardless of node size, which is often too small for PySpark UDFs and large shuffles, so set it explicitly. Other causes: data skew (a few tasks have far more input than the rest, which you see on the Stages tab), too few partitions, caching too much, large broadcasts and Python UDFs.
- 143, terminated. With dynamic allocation, Fabric scales idle executors down by sending this signal, so it is often normal. Worry only if it happens during active work: it is then usually a heartbeat time-out or memory pressure.
- 1. An exception in your code. Read the stack trace.
- 50, "Container from a bad node". The platform killed a container on an unhealthy node. Retry. If infrastructure failures reach the executor failure limit, raise
spark.executor.maxNumFailures. Do not use that fix for memory errors.
Typical fixes for memory problems:
- Increase
spark.executor.memoryandspark.executor.memoryOverhead, or scale up to bigger nodes. Scale out to spread data across more nodes. Adding resources to a skewed job does not help, because the big partition still lands on one executor. - Repartition toward 128 to 256 MB per partition. As a start, divide the data size by 200 MB.
- Use Adaptive Query Execution, which is on by default in Fabric. Its
spark.sql.adaptive.skewJoin.enabledsetting splits large partitions. Salting a skewed key is another option. - Cache only DataFrames you reuse, and
unpersist()them. Turn off auto-broadcast for big tables:spark.sql.autoBroadcastJoinThreshold = -1. - Replace Python UDFs with built-in functions, or reduce the Pandas UDF batch size.
- Raise
spark.sql.shuffle.partitions(the default is 200) if the executor fails with "No space left on device" during a shuffle, and filter and select early to shuffle less.
# Driver out of memory: do not pull everything to the driver
pdf = df.limit(1000).toPandas()          # not df.toPandas()
display(df.limit(1000))                  # not display(df)
df.write.mode("overwrite").saveAsTable("silver_result")   # write instead of collect()
Where a setting goes
This is a favorite exam trap. spark.executor.*, spark.driver.*, spark.network.* and spark.yarn.* settings are read when the session or the executors start, so spark.conf.set() cannot change them mid-session. Put them in a %%configure cell that is the first cell of the notebook (it restarts the session), or in a Fabric Environment. Only spark.sql.* settings, such as AQE, shuffle partitions and the broadcast threshold, can be changed at runtime with spark.conf.set().
%%configure
{
  "conf": {
    "spark.executor.memory": "28g",
    "spark.executor.memoryOverhead": "4g",
    "spark.network.timeout": "800s",
    "spark.executor.heartbeatInterval": "60s"
  }
}
Remember that more failure tolerance hides a symptom. Raising spark.executor.maxNumFailures lets a job survive more crashes, but it does not fix the reason for them. For long jobs, spark.executor.failuresValidityInterval makes Spark count only recent failures.
Data and code errors you will see in the cell output
AnalysisException. A column or table does not exist, or a name is ambiguous after a join. Check the schema withdf.printSchema()and the exact spelling.- Delta schema mismatch on write. Writing a DataFrame with new columns to an existing Delta table fails. Use the
mergeSchemawrite option to add columns, oroverwriteSchemawith an overwrite when you intend to replace the schema. - Concurrent write conflicts. Two jobs changing the same Delta table can conflict. Serialize the jobs, or partition and filter so they touch different data.
- Missing library. A library installed in one session is not there in a pipeline run. Put libraries in an Environment so every run has them.
Choosing the right place to look
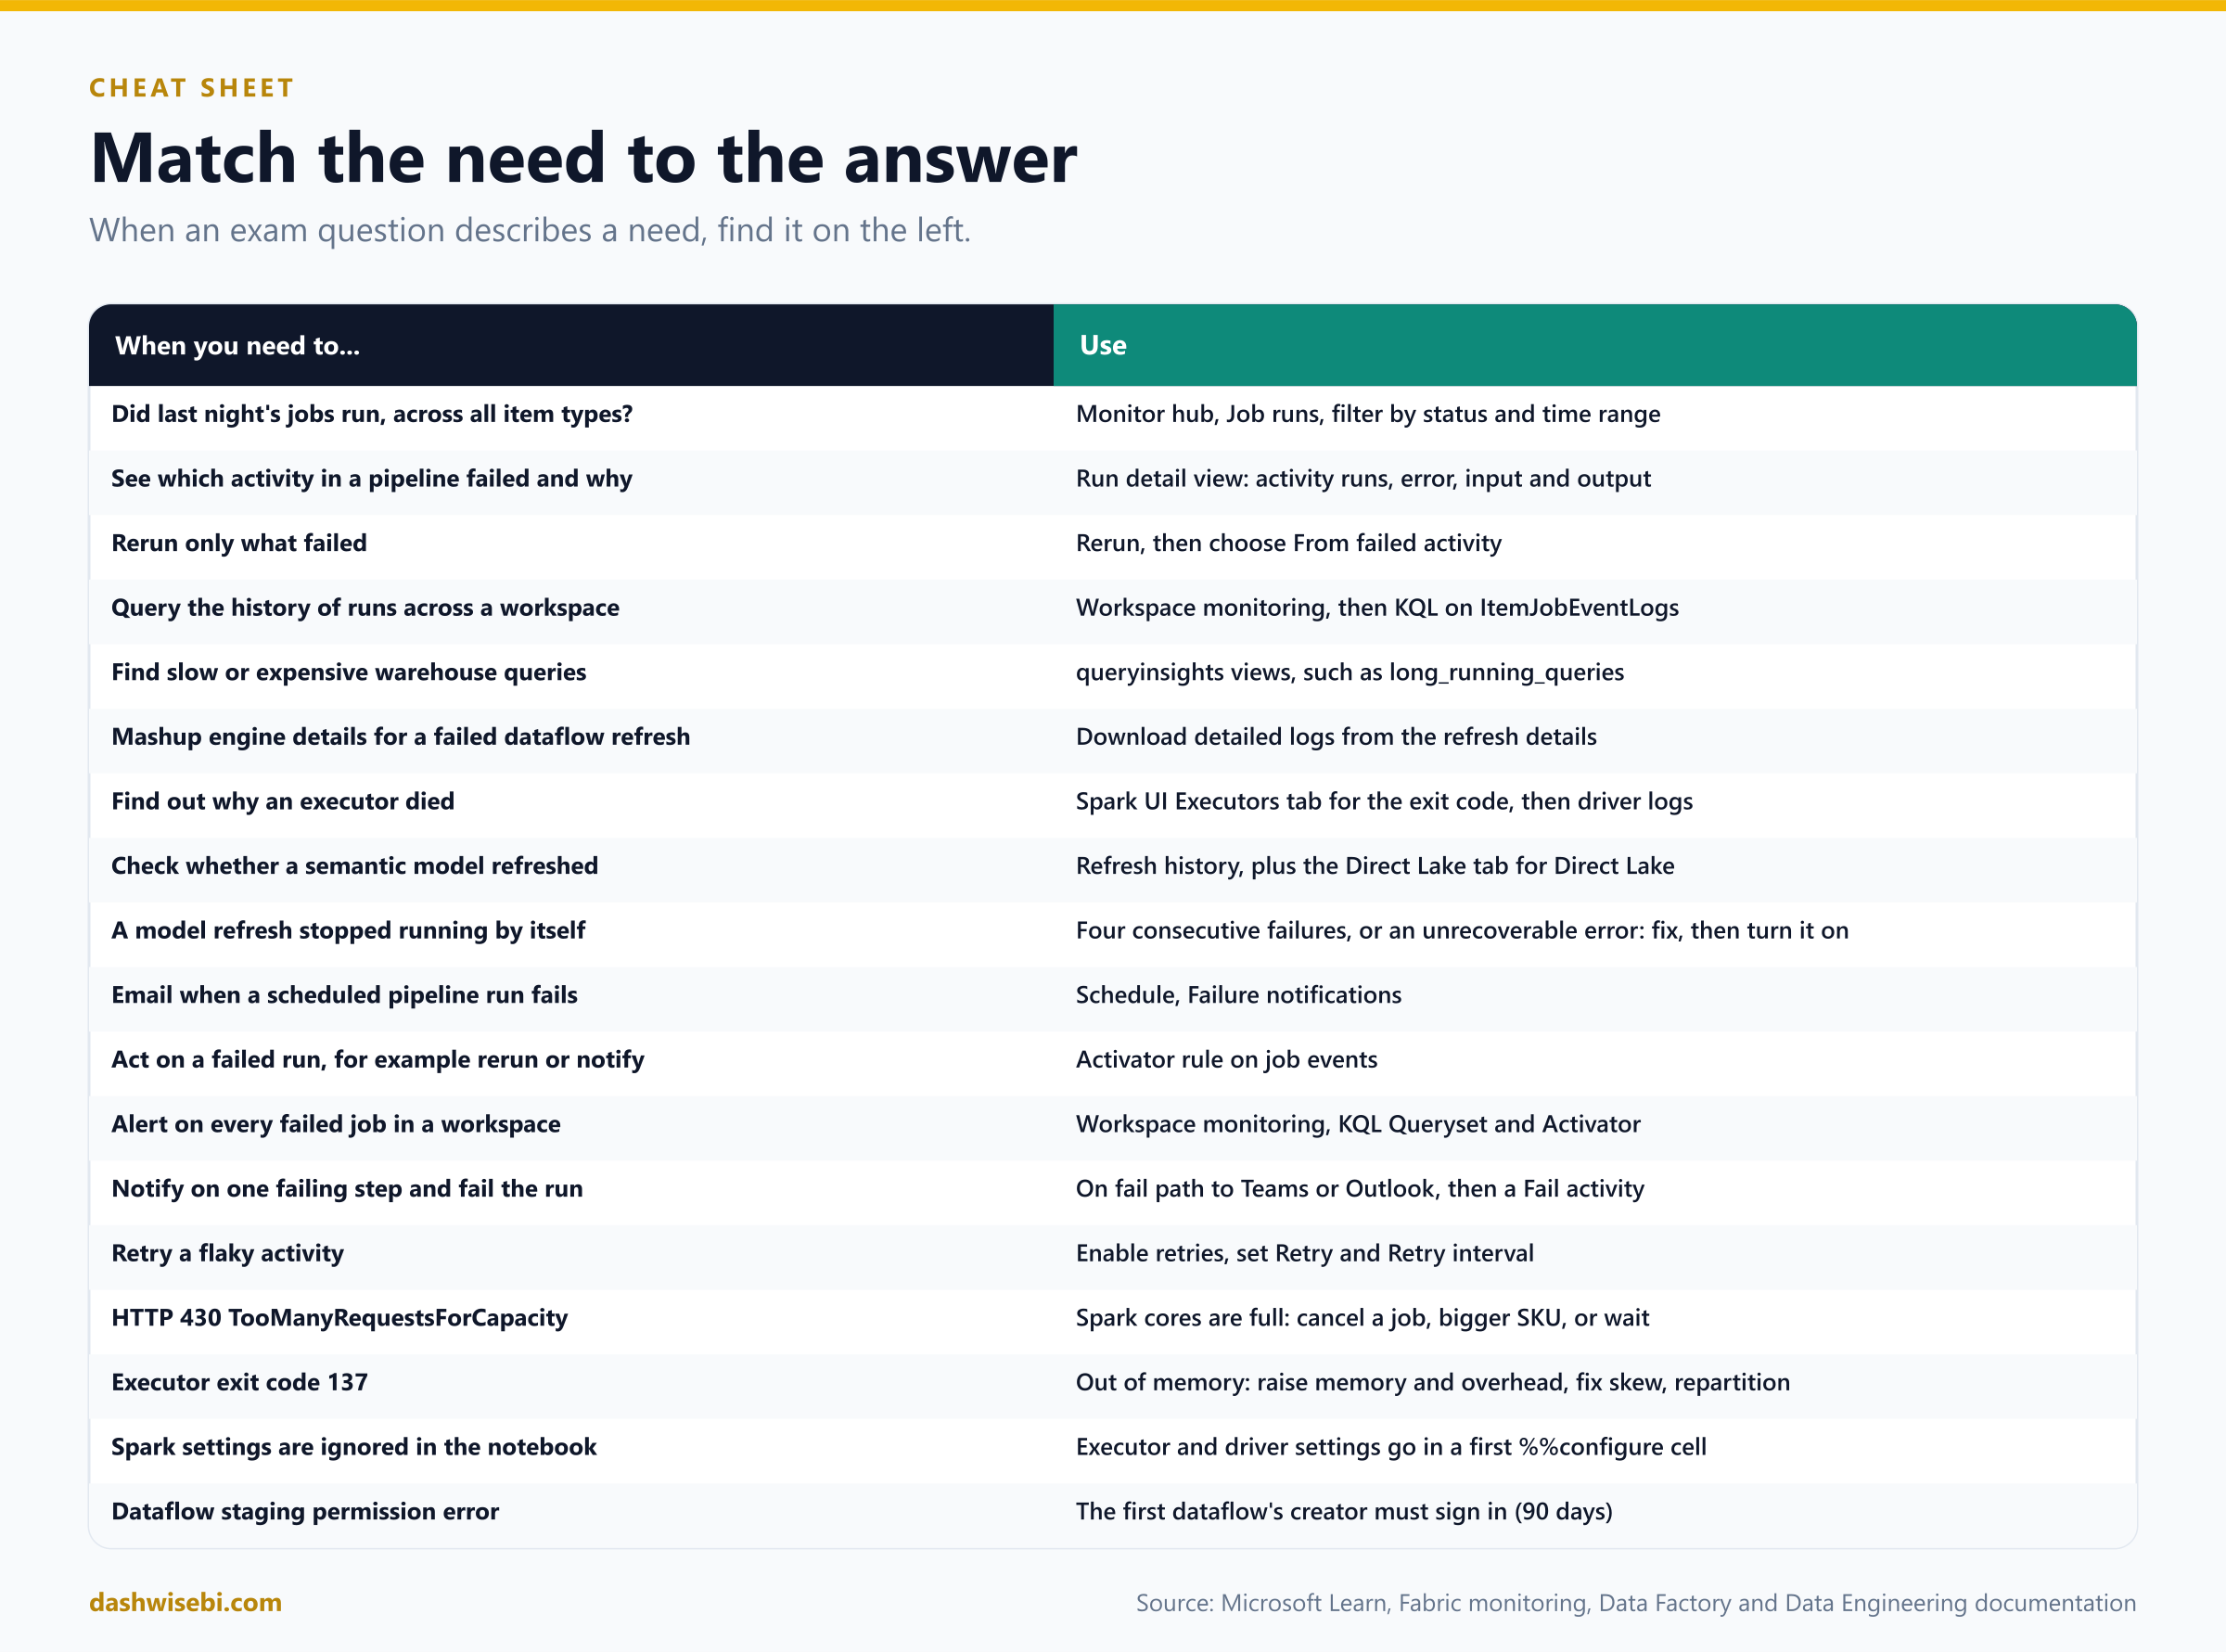
When an exam question describes a symptom, find it on the left and pick the answer on the right.
Common mix-ups
- "The Monitor hub updates live." It loads when opened. Select Reload.
- "The Monitor hub shows all runs ever." It shows the selected time range, and only items you can view.
- "Workspace monitoring is on by default." It is off until you turn it on, and it does not backfill.
- "Workspace monitoring data is kept forever." The default retention is 30 days.
- "Any workspace reader can query the monitoring database." It needs at least Contributor.
- "You can have two monitoring items for one workspace." Only one can collect telemetry for a workspace.
- "Query insights covers all queries." It covers queries run in a user's context for 30 days, with up to 15 minutes delay, and not system queries.
- "A semantic model refresh that says Completed has no problems." It can carry warnings.
- "Power BI keeps trying a failing schedule forever." It deactivates it after four consecutive failures.
- "A Direct Lake refresh copies the data." It frames the metadata and takes seconds.
- "Exceeding a Direct Lake guardrail always falls back to DirectQuery." Only for Direct Lake on SQL. Direct Lake on OneLake fails the refresh.
- "Failure notifications cover manual pipeline runs." Scheduled runs only.
- "A retry fixes a wrong password." Retries are for transient errors.
- "The Fail activity is only for testing." It lets you fail a run on purpose with your own message and error code, so a handled error is still reported as a failure.
- "A deactivated activity still produces output." It never runs and has no output.
- "Rerunning from the failed activity is always safe." Only if the loads are idempotent.
- "Dataflow Gen2 refresh history lasts forever." The page lists up to 50 refreshes or six months.
- "Any Dataflow Gen2 refresh can run for days." One query evaluation is limited to 8 hours and a refresh to 24 hours.
- "A canceled dataflow refresh rolls everything back." A destination keeps what was written so far.
- "Exit code 143 always means a bug." It is often a normal scale-down.
- "Raise maxNumFailures to fix out-of-memory errors." It hides the symptom. Fix memory and skew.
- "Use
spark.conf.setto change executor memory." Use a first-cell%%configureor an Environment. - "HTTP 430 means the notebook has a bug." It means the capacity's Spark cores are used up.
- "Interactive notebooks are queued when the capacity is full." They are rejected. Pipeline and scheduled jobs are queued.
Try these scenarios
Eight exam-style questions. Cover the answers and test yourself.
1. The nightly jobs
You manage 40 pipelines, notebooks and dataflows in a workspace. Each morning you want one list of what failed overnight, across all of them. Where do you look?
Answer: The Monitor hub, Job runs page. Set the time range to the last day and filter by Failed. Save the view. Open a row to see the error and the run history.
2. Which activity, and why
A pipeline run failed. How do you find the failing activity and its error message?
Answer: Open the run's detail view from the Monitor hub, filter the activity runs by Failed, and open the activity's input, output and error. For a Copy activity, the duration breakdown shows where time was spent.
3. One alert for every pipeline
The team wants an email whenever any pipeline in a workspace fails, without adding an alert to each one. What do you build?
Answer: Turn on workspace monitoring, save a KQL query over ItemJobEventLogs that selects failed pipeline jobs in a KQL Queryset, create an Activator rule on that Queryset with an email or Teams action, and make sure it checks more often than the query's time window.
4. The report that went stale
A semantic model has not refreshed for a week. Nobody noticed the failure emails, and the schedule now shows Disabled. What happened, and what do you do?
Answer: Power BI deactivated the schedule after four consecutive failures (or an unrecoverable error such as expired credentials). Check the refresh history for the error, fix it (for example, update the credentials), then turn Configure a refresh schedule back on. Add contacts so that failure emails go to more than one person. Also check whether two months without any report views paused it.
5. The Direct Lake model that will not refresh
A Direct Lake on OneLake model fails its refresh after a table grew a lot. Queries fail too. What is the likely cause and fix?
Answer: A guardrail for the SKU was exceeded (Parquet files, row groups, rows per table or model size). With Direct Lake on OneLake, the refresh fails and the model cannot be queried until the Delta tables are optimized to fit, or the capacity is scaled up. (Direct Lake on SQL would have fallen back to DirectQuery with a warning.)
6. Retry or not
A Copy activity from ADLS fails with UserErrorFailedFileOperation and HTTP 403. A colleague suggests adding five retries. What do you say?
Answer: A 403 is a permission problem: the service principal or managed identity lacks access to the folder or file. Retries will not help. Grant the identity access. (A 503 from the token service is different and would respond to a rerun or retries.)
7. The dataflow that suddenly fails
A scheduled Dataflow Gen2 fails with "insufficient permissions for accessing staging artifacts". Nothing in the dataflow changed. Why?
Answer: The user who created the first dataflow in the workspace has not signed in to Fabric for more than 90 days, or has left. That user should sign in. If they left, open a support ticket.
8. Executors keep dying
A notebook that processes a big join fails with MaxExecutorFailures. In the Spark UI, a few executors show exit code 137, and a few tasks in one stage process 50 times more input than the others. What do you do?
Answer: It is out of memory caused by data skew. Enable AQE skew join handling (spark.sql.adaptive.skewJoin.enabled), salt or separately process the hot key, repartition to 128 to 256 MB per partition, and raise executor memory and overhead in a first-cell %%configure. Raising the failure limit would only hide the problem.
Where to go next
- Open the Monitor hub in a trial workspace. Run a pipeline, a notebook and a dataflow, break one on purpose (use a wrong path or password), and practice finding the error from the Job runs page.
- Turn on workspace monitoring and write the failed-pipeline query. Then create an Activator rule that emails you.
- Build a pipeline with an On fail path that posts to Teams and ends in a Fail activity. Compare how the run looks with and without the Fail activity.
- Download the detailed logs of a Dataflow Gen2 refresh and open the ZIP.
- In a notebook, run a deliberately bad
%%configure(a unit onspark.rpc.message.maxSize) and read the error. Then fix it. - Read the sources behind this post: DP-700 study guide, What is Monitor hub?, Monitor job runs in the Monitor hub, Choose how to monitor pipeline runs, Monitor pipeline runs in the legacy Monitoring hub, Create alerts for pipeline runs, Workspace monitoring overview, View Dataflow Gen2 refresh history and monitoring, Dataflow Gen2 refresh, Apache Spark monitoring overview, Query insights, Data refresh in Power BI, Configure scheduled refresh, Direct Lake overview, What is Fabric Activator?, Activity overview, How to copy data using the copy activity, Troubleshoot the SQL connectors, Troubleshoot the Azure Data Lake Storage connector, Concurrency limits and queueing in Apache Spark for Fabric, Troubleshoot Spark session, configuration, and platform errors, Troubleshoot Spark memory and performance issues and Fabric Notebooks troubleshooting guide.
Keep reading
DP-700: Fabric Overview & Workspace Settings
DP-700 study guide for Spark, domain, OneLake and Apache Airflow workspace settings in Fabric, with ten diagrams, exam traps and practice scenarios.
DP-700 Episode 11: Streaming II, Spark & KQL
DP-700 study guide told as a story: run Spark Structured Streaming in production, process data with KQL, and write tumbling, hopping, sliding and session windows.