PL-300 Episode 6: Copilot, Visual Calculations & Analytics

PowerBI consultant ·
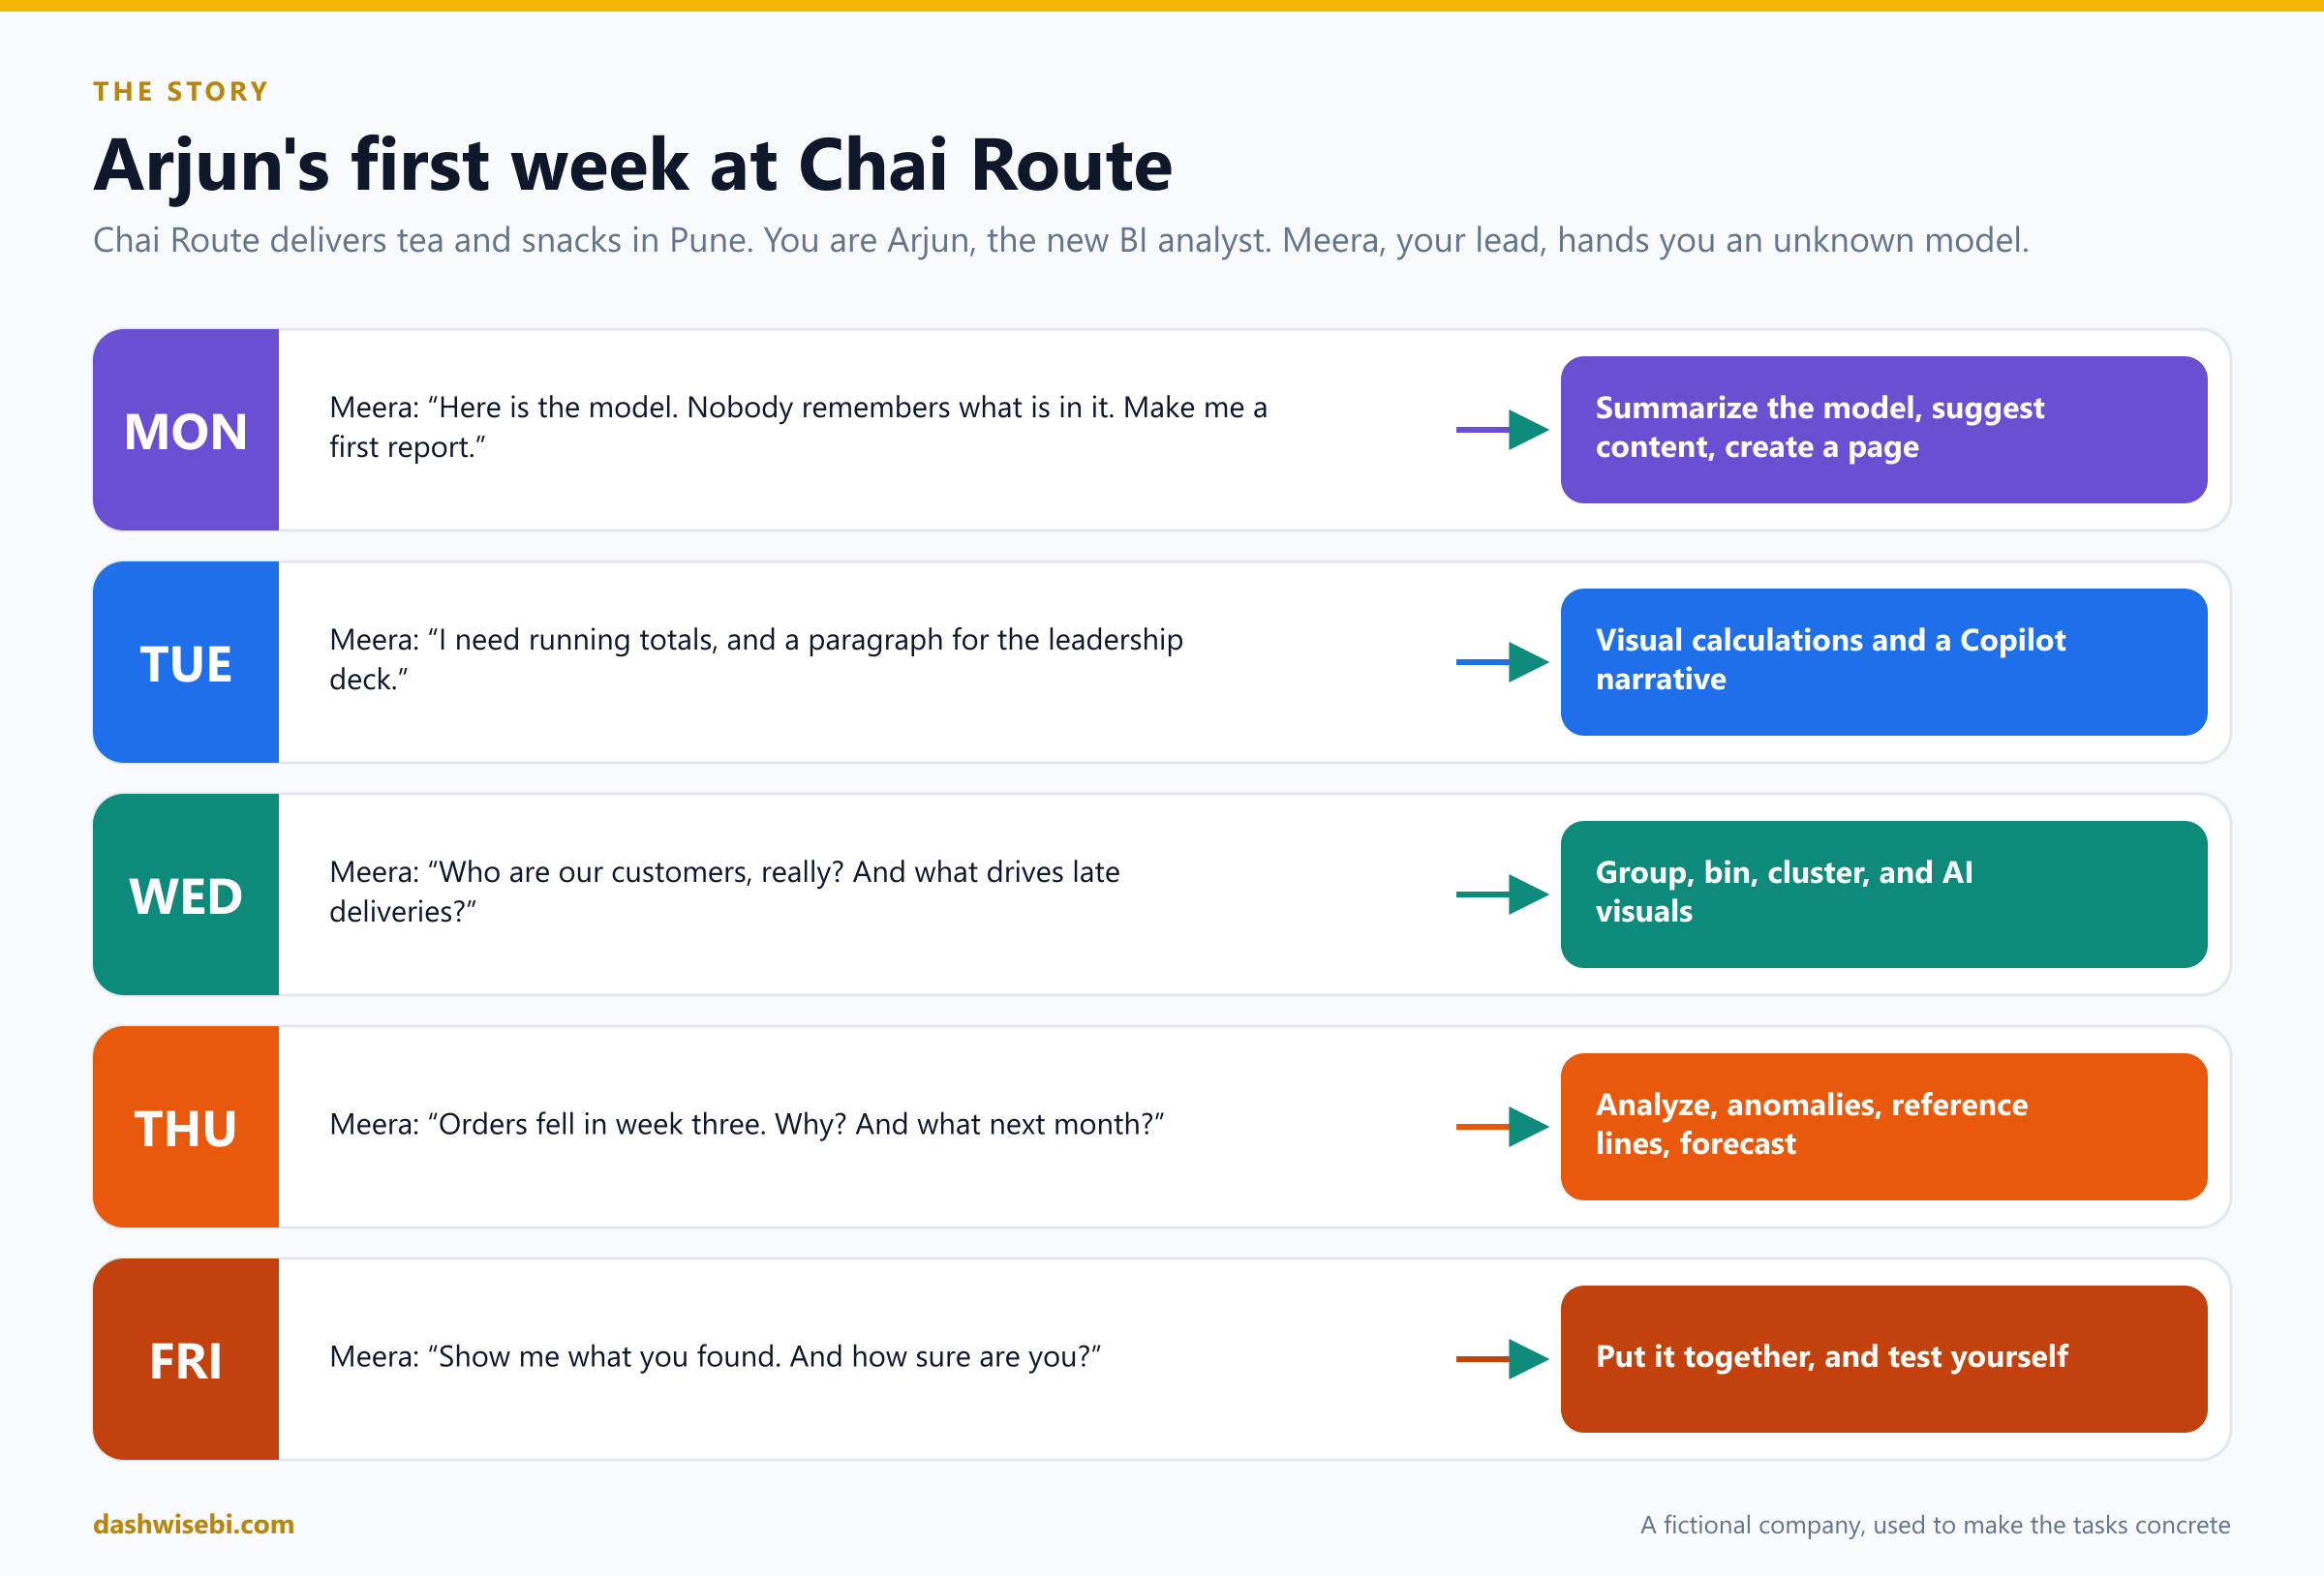
Monday, 9:30. Meera, the BI lead at Chai Route, slides a laptop across the desk. “Welcome, Arjun. That is the sales model. Nobody who built it still works here. I need a first report by lunch.” You open the file. Forty-one fields. No documentation.
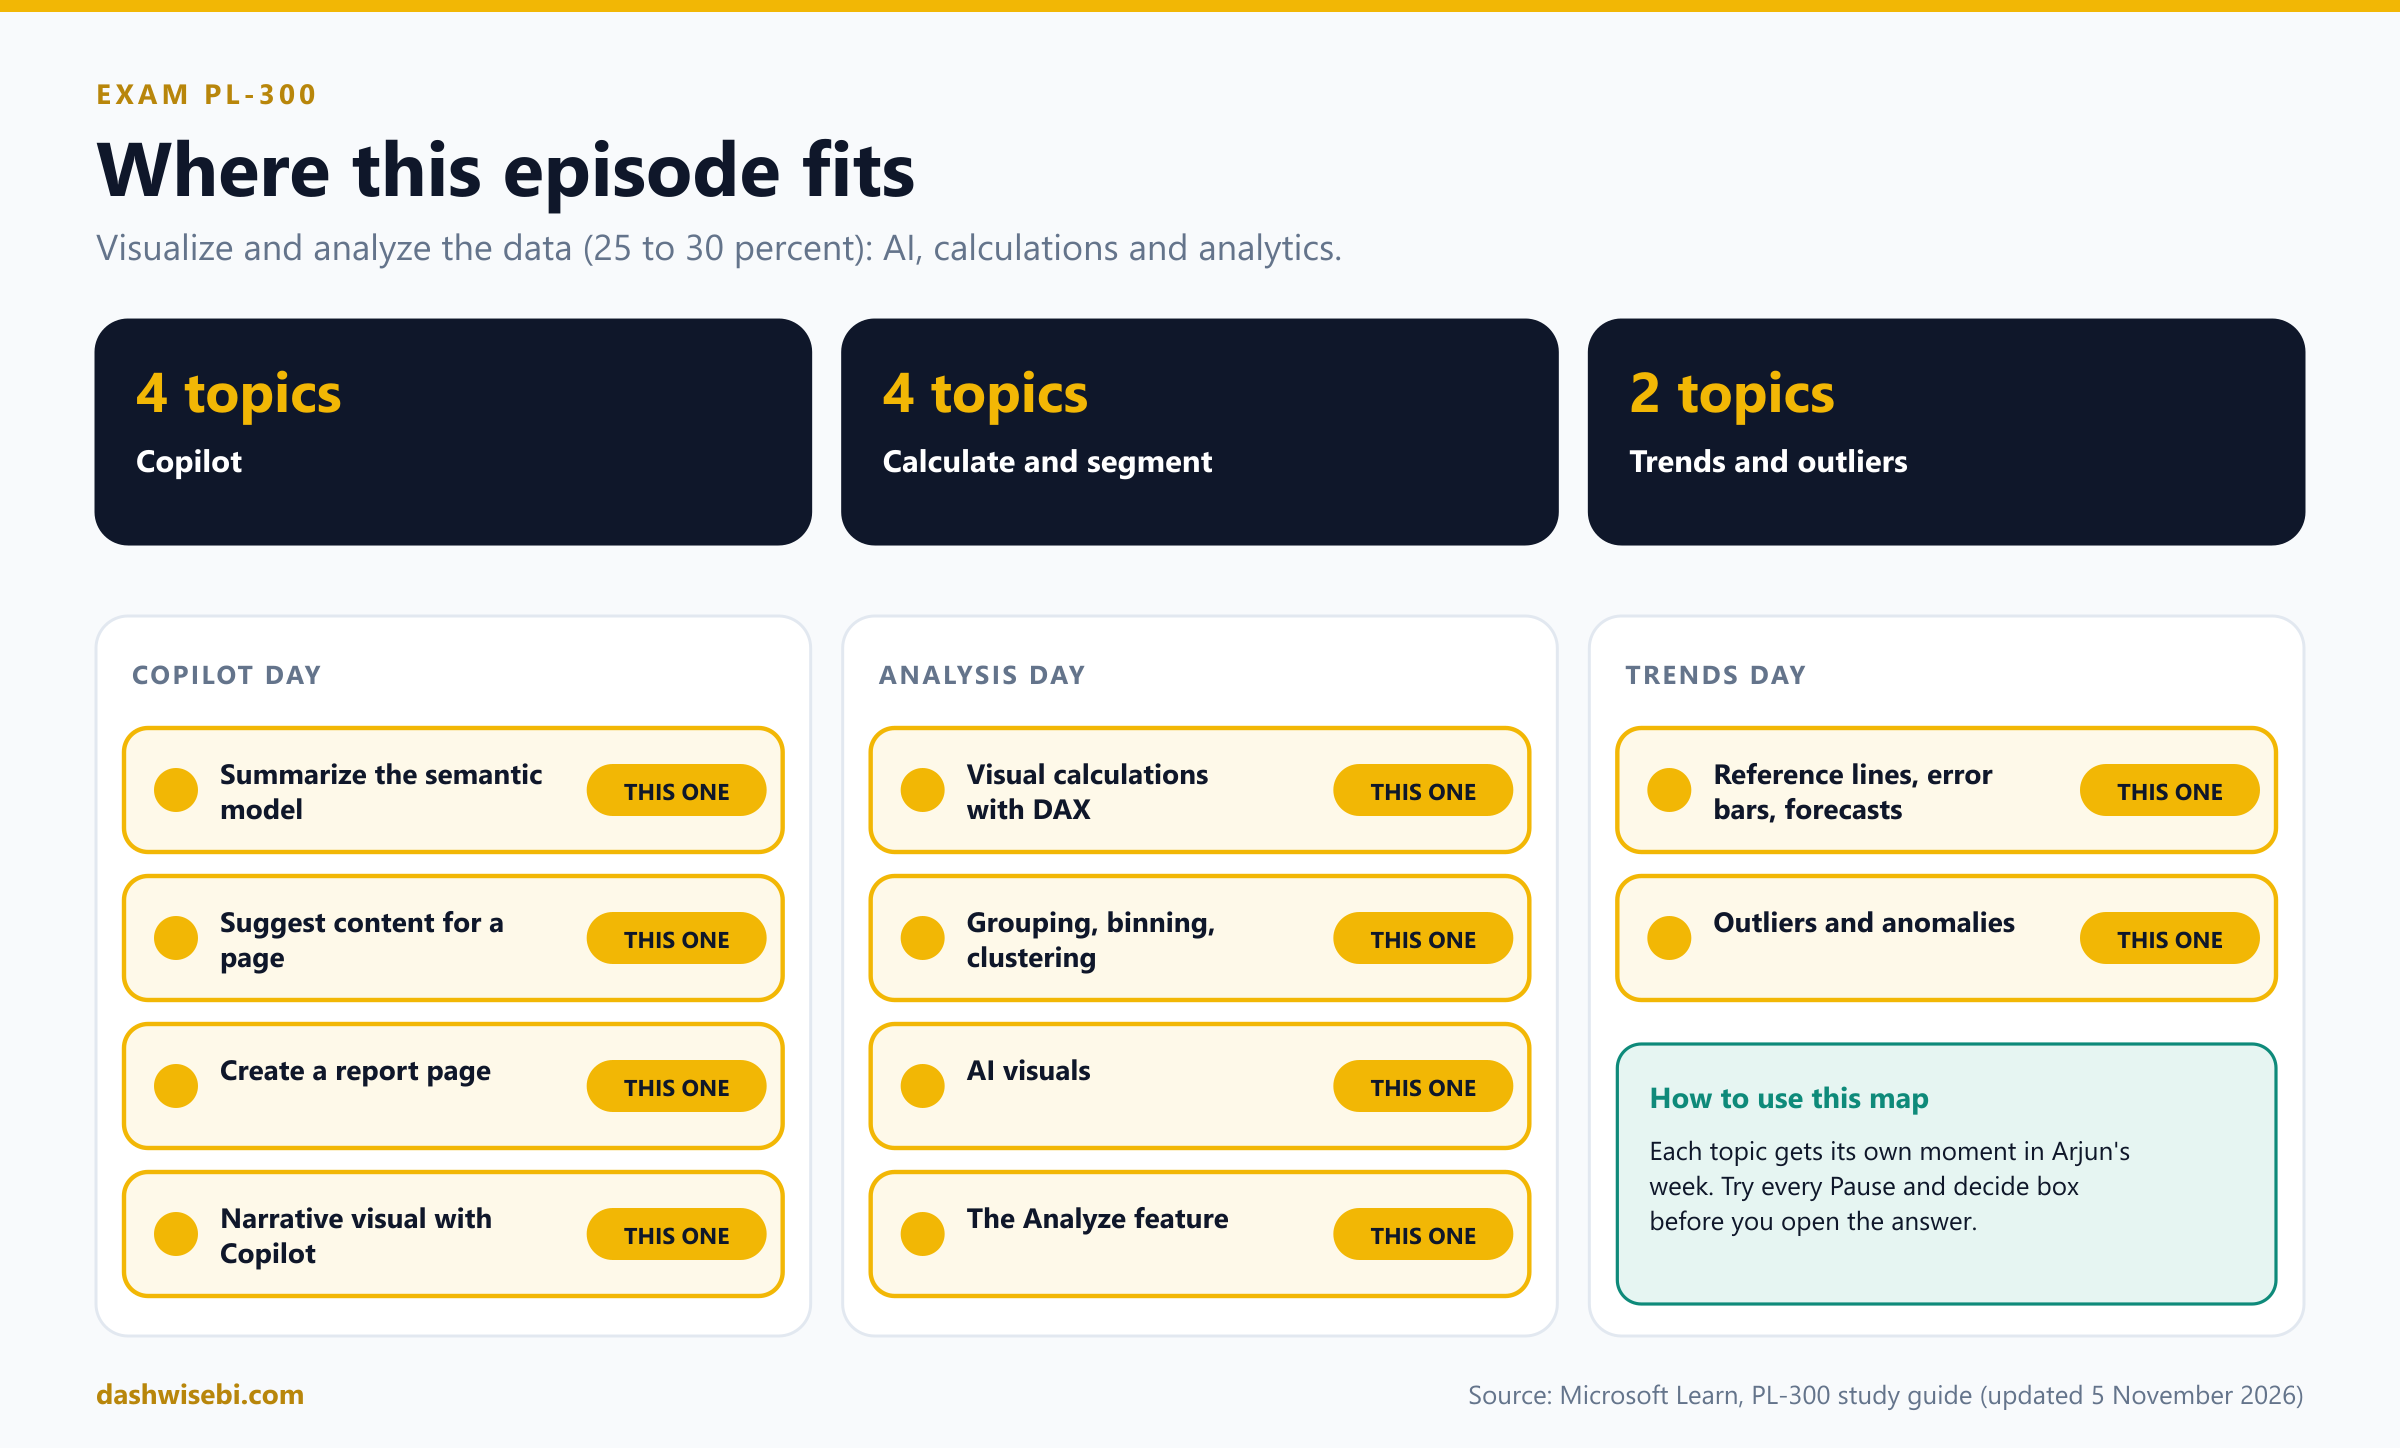
Welcome to Episode 6 of our PL-300 series. In Episode 5 you made reports that people actually read. Now we go further into the Visualize and analyze the data skill area (25 to 30 percent of the exam): the AI, calculation and analytics features. These are the ten topics:
- Use Copilot to summarize the underlying semantic model
- Use Copilot to suggest content for a new report page
- Use Copilot to create a new report page
- Create a narrative visual with Copilot
- Create visual calculations by using DAX
- Use grouping, binning and clustering
- Use AI visuals
- Use the Analyze feature in Power BI
- Detect outliers and anomalies
- Use reference lines, error bars and forecasting
I reordered them into a five-day story because that is the order you would meet them at work. Each chapter has the same rhythm:
- The ask. What Meera needs.
- Pause and decide. Choose first. The answer is behind a click.
- Why. The reasoning, with diagrams.
- Exam lens. What PL-300 tends to ask, and the traps.
A few honest notes. Chai Route is a made-up company. I have not run every feature in this post on a live tenant, so I follow Microsoft Learn, and I say so where Learn is thin. Copilot needs a paid Fabric or Premium capacity and tenant settings that an admin turns on, so on your own laptop it may simply be missing. Some features here carry a preview label at times. Features change quickly, so check the live documentation for their status before an exam.
Monday, part 1. “What is even in this model?”
You scroll the field list. Cust_ID_2. Amt. Flag7. Meera is already on a call. You are on your own, with Copilot.
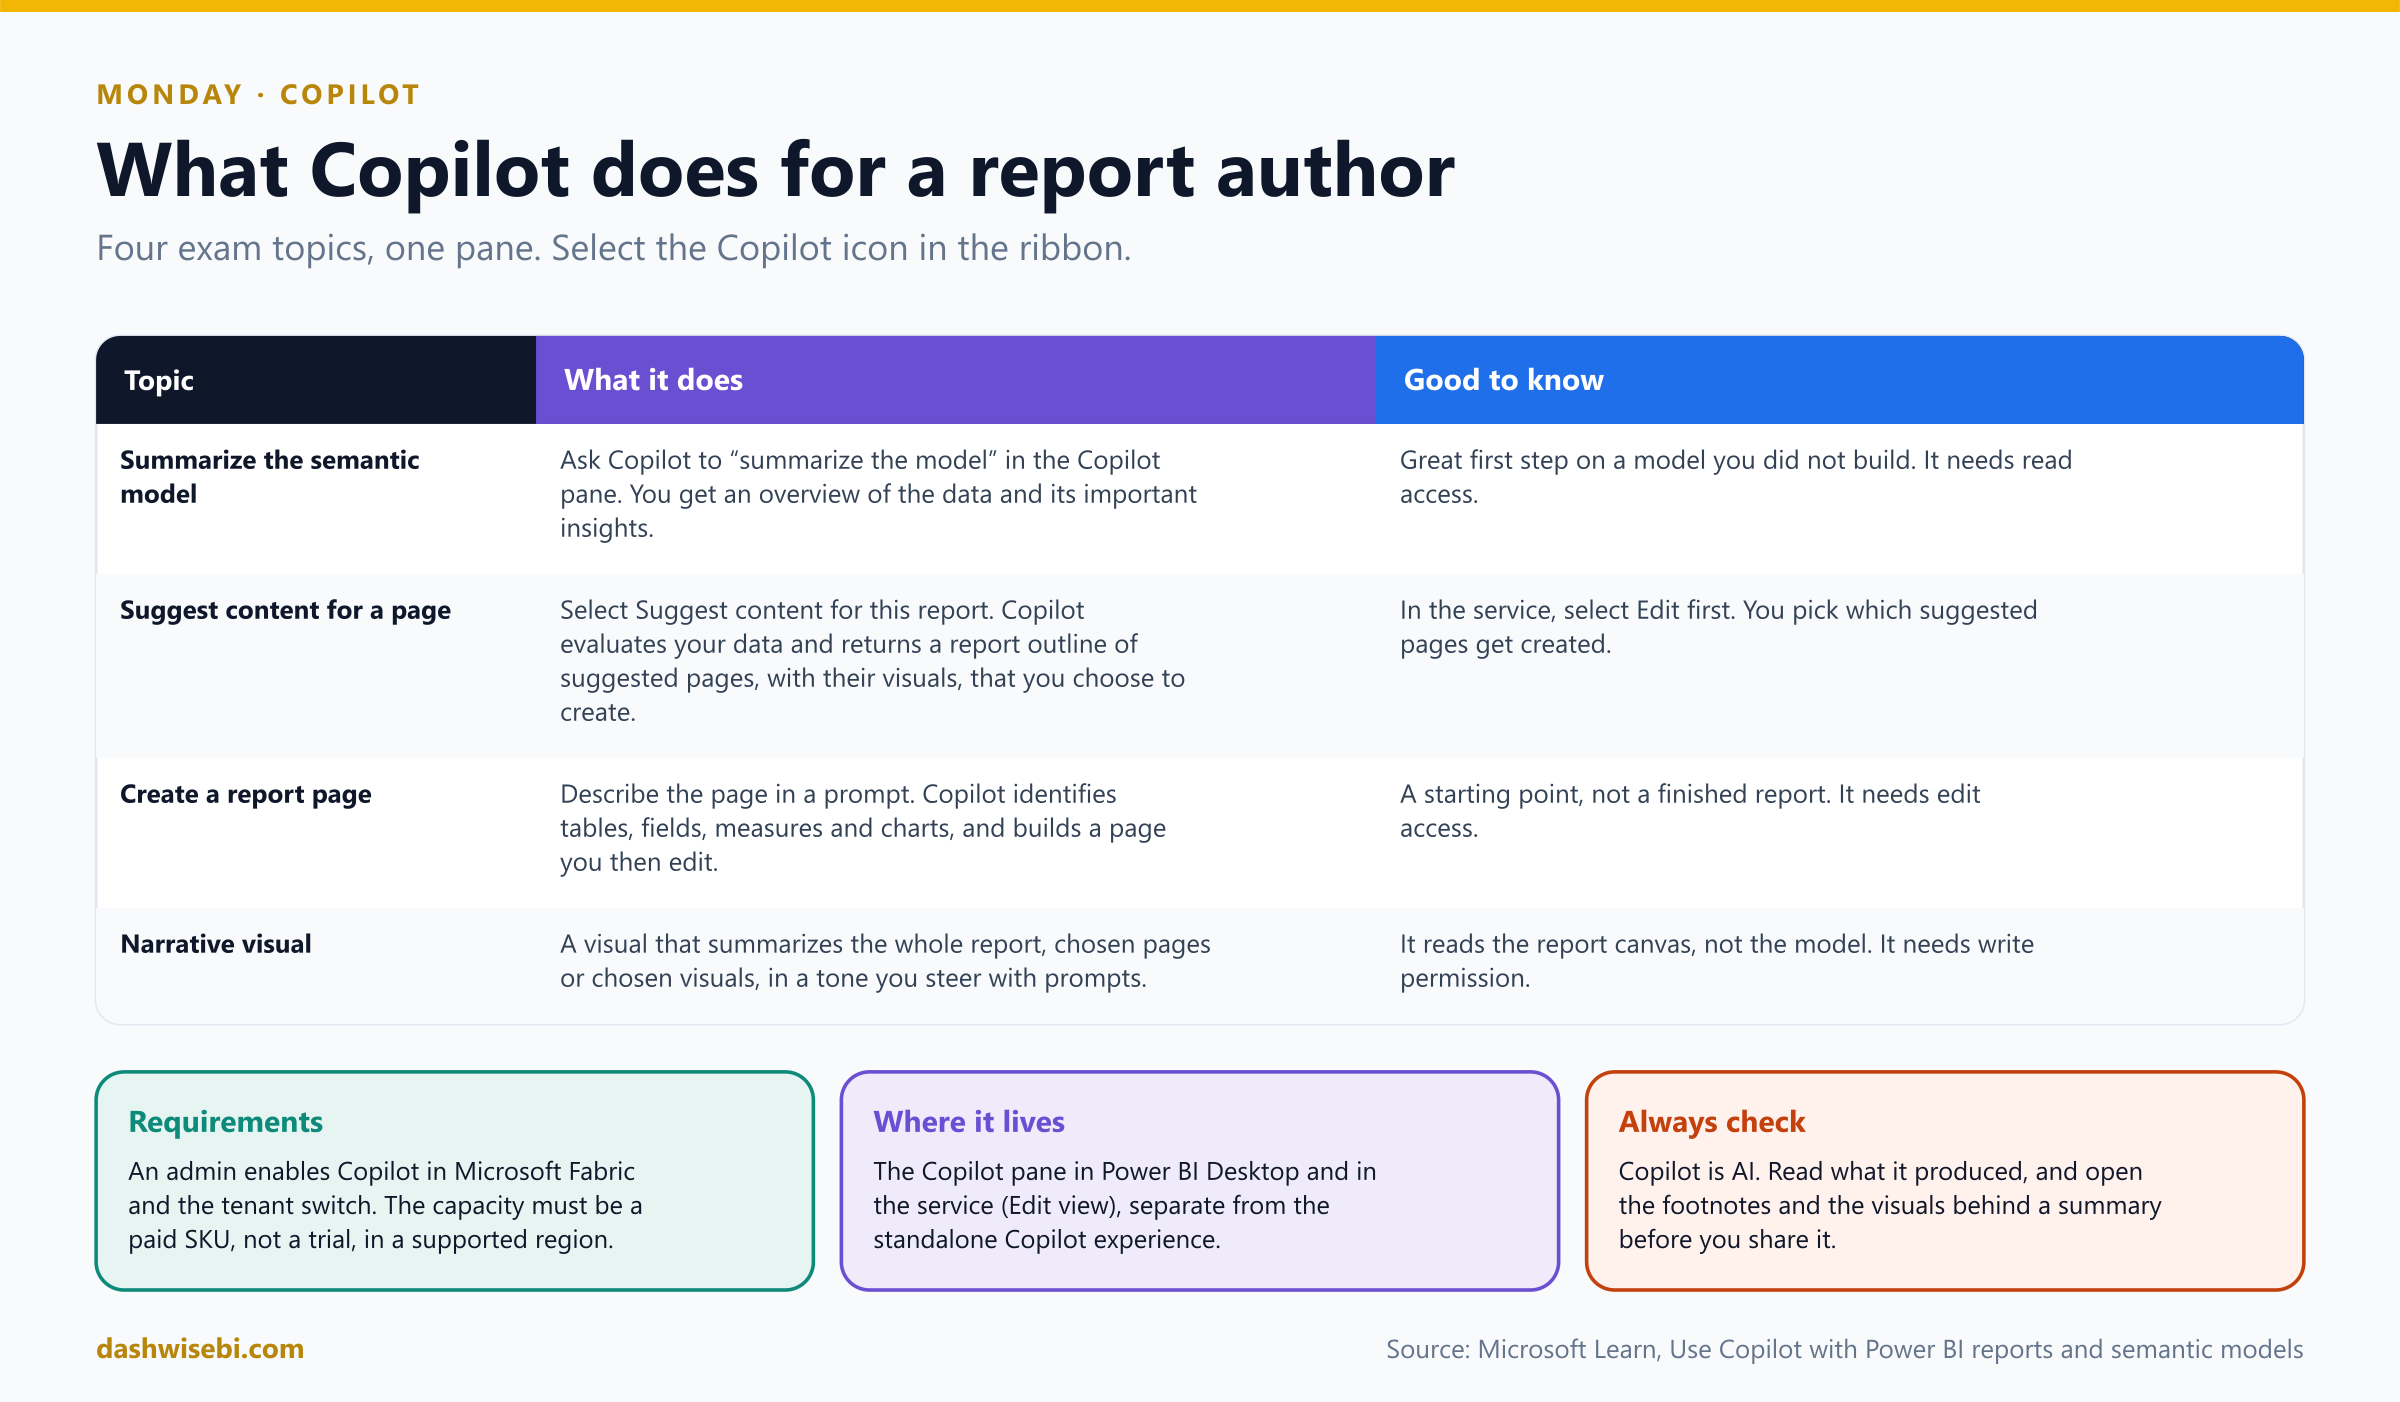
The first Copilot topic is the one a new analyst needs on day one: summarize the underlying semantic model. Open the Copilot pane from the ribbon and ask for it. Copilot looks at the tables, columns and measures and answers with an overview of the data and its important insights.
Pause and decide. Before you ask Copilot to build anything, what is the first useful prompt on an unfamiliar model?
Ask it to summarize the semantic model (for example, “Summarize this model”). You learn what the data is about before you build on it. It is a quick orientation, not a replacement for opening the model view and checking relationships yourself.
Pause and decide. Copilot's summary says “Cust_ID_2 is a customer identifier”. You know it is not. What is the lesson?
Copilot is AI and can be wrong. It works from names, descriptions and data. Cryptic names and missing descriptions give it little to work with. Verify against the model, and fix the cause in the model: clear table, column and measure names, and descriptions. Copilot looks at only the first 200 characters of a description, so put the key meaning first.
Pause and decide. The Copilot icon is greyed out for a colleague, but not for you. What are the usual suspects?
Copilot is a capacity and tenant feature. An admin must enable Copilot in Microsoft Fabric (the tenant switch), and the workspace must be on a paid Fabric or Premium capacity in a supported region. Trial capacities do not qualify. The user also needs the right access to the model and report. Check these before you debug the report.
Why: Copilot reads your model, so the model is the prompt
- Preparation matters. Microsoft recommends preparing a model for Copilot: descriptive names, descriptions, correct relationships, and hiding fields nobody should use. It also offers AI instructions and verified answers, but the docs note that some of these may not be honored in every Power BI Desktop scenario, so treat them as hints, not guarantees.
- Relationships. If relationships are wrong, instructions cannot fix them. Fix them in the model.
- Permissions. Summaries and pages are built from the data the user may see, so row-level security still applies.
Copilot's summary says the model holds orders, deliveries, customers and products across two years. It also flags a “Flag7” column it cannot explain. That is the most honest sentence of the morning, and it sends you to the model view to rename it.
Exam lens
- Summarize the model: ask Copilot in the Copilot pane. It gives an overview and key insights.
- Needs paid capacity, a tenant switch and a supported region.
- Better names and descriptions give better Copilot results.
Monday, part 2. “Now make me a report”
After lunch Meera drops by. “Got a feel for it? Then I need a page I can show tomorrow. Do not start from a blank canvas.”
There are two Copilot moves here, and the exam treats them as two topics:
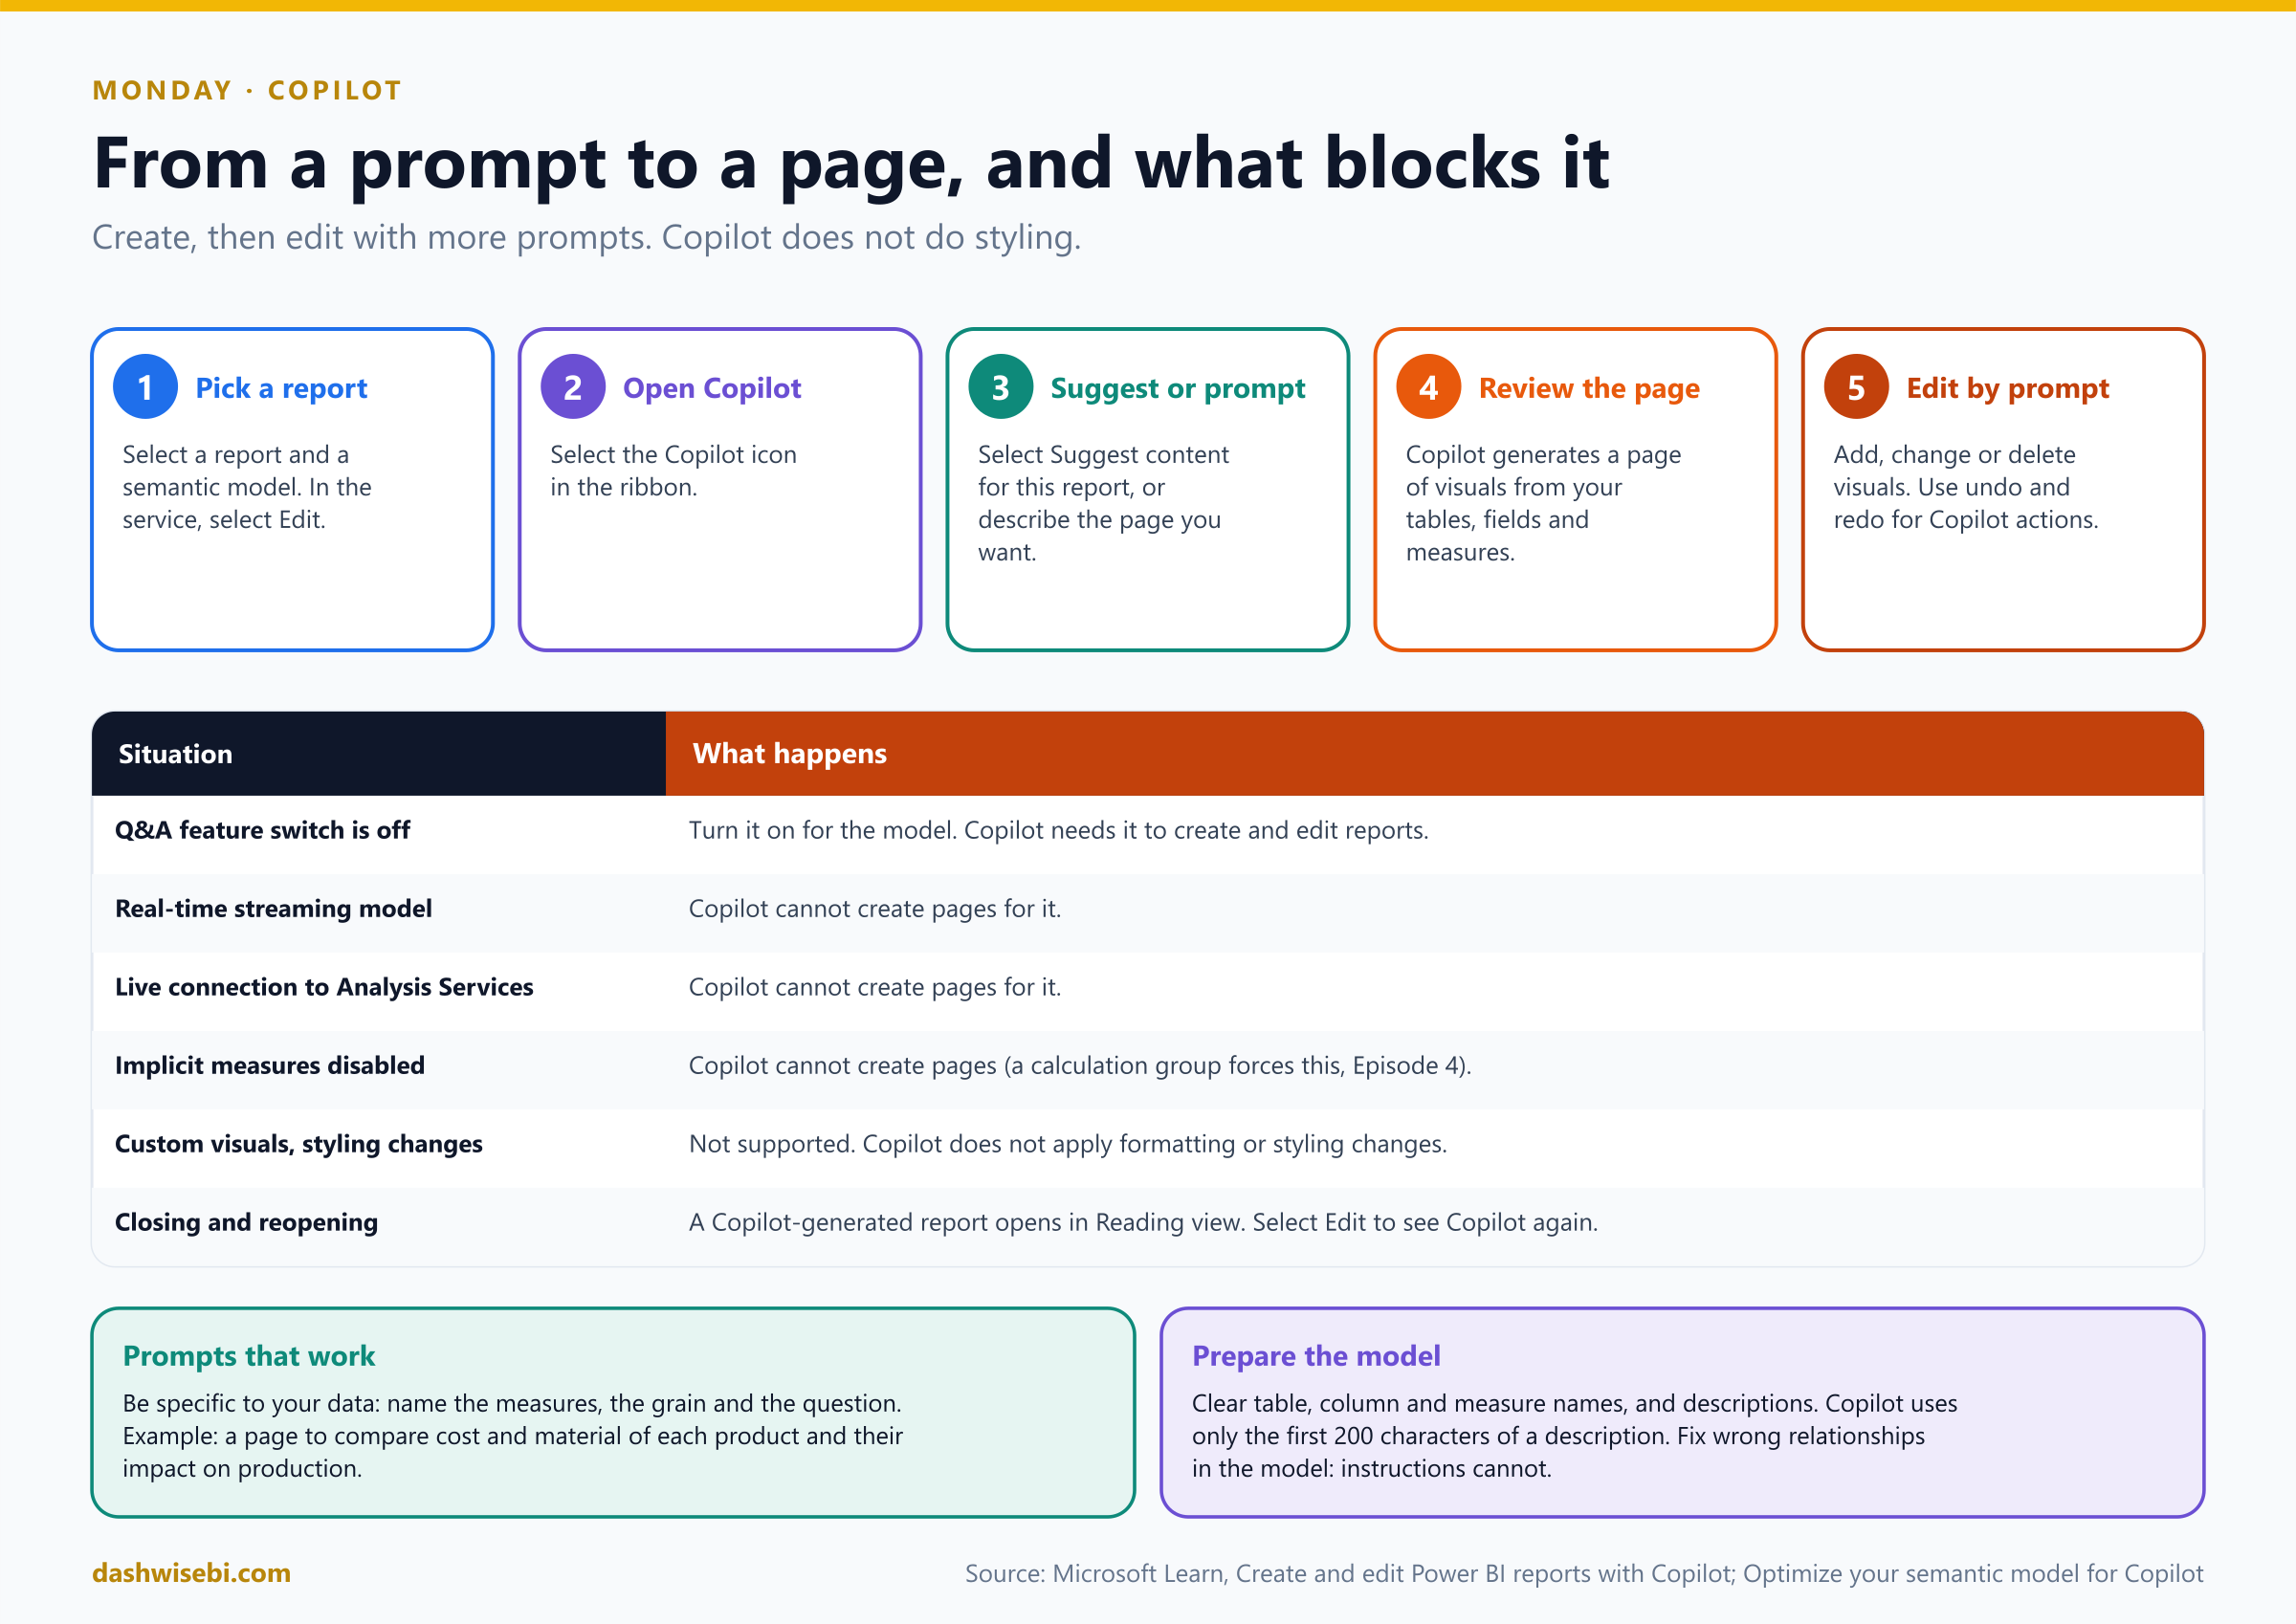
- Suggest content for a new report page. Select Suggest content for this report. Copilot evaluates your data and returns a report outline: suggested pages, each with the visuals it proposes. You choose which suggestions to create.
- Create a new report page. You describe the page in a prompt. Copilot identifies the right tables, fields, measures and charts, and builds a page you can then edit.
Pause and decide. Which of these is a good prompt? (a) “Make a nice report.” (b) “Create a page that shows monthly sales, on-time delivery rate and the top ten products by revenue.”
(b). A good prompt is specific to your data. Name the measures, the grain (monthly) and the question. Vague prompts get generic pages. You can then keep refining with follow-up prompts: add a visual, change one, delete one.
Pause and decide. Copilot says it cannot create a page for this model. Which model facts could be the cause?
The Q&A feature switch is off, the model is a real-time streaming dataset, it is a live connection to Analysis Services, or implicit measures are disabled (a calculation group, from Episode 4, forces this). Also remember that Copilot does not do styling and does not use custom visuals.
Pause and decide. You asked for a page and Copilot built it. A teammate wants a darker background and bigger fonts. Do you ask Copilot?
No. Copilot does not apply formatting or styling changes. Use the Format pane or a theme (Episode 5). Copilot is for structure and content: which visuals, which fields, which question.
Pause and decide. You are editing in the Power BI service. What do you select before Copilot can create a page?
Edit. Copilot creates and edits pages in editing mode, and you need edit access to the report. A report that Copilot generated opens in Reading view the next time, so select Edit again to continue.
Why: what Copilot is good at, and where it stops
- Starting point, not a finished report. Read the page. Check that each visual answers the question it claims to answer.
- Undo and redo work on Copilot actions, so experiments are cheap.
- Suggest content first, create second. When you do not yet know what to ask for, the outline gives you ideas grounded in your own data. Then you create the pages you like.
- Data accuracy. Copilot can pick a measure that is not the one your business means. If a number looks off, check which field and aggregation it used.
By 4 p.m. you have a three-page draft. Two pages are keepers. One has a donut chart with fourteen slices, which, thanks to Episode 5, you know how to fix.
Exam lens
- Suggest content: returns an outline of pages and visuals. Create a page: a prompt that names your data.
- Copilot cannot create pages for streaming models, live Analysis Services connections, models with implicit measures disabled, or with the Q&A switch off.
- Copilot does not style. Edit mode is required.
Tuesday, part 1. “I need running totals. Without a 40-line measure.”
Meera, over the top of her coffee. “Monthly sales, and next to them a running total and the percent of the grand total. The last analyst wrote three measures with CALCULATE and ALL, and none of us could read them.”
This is what visual calculations are for. A visual calculation is DAX that you write on the visual, and it runs on the aggregated data that the visual already contains. There is no filter context to manage, because the visual's own rows and columns are the context. In Desktop, select the visual and choose New calculation, then type the formula in the edit bar.
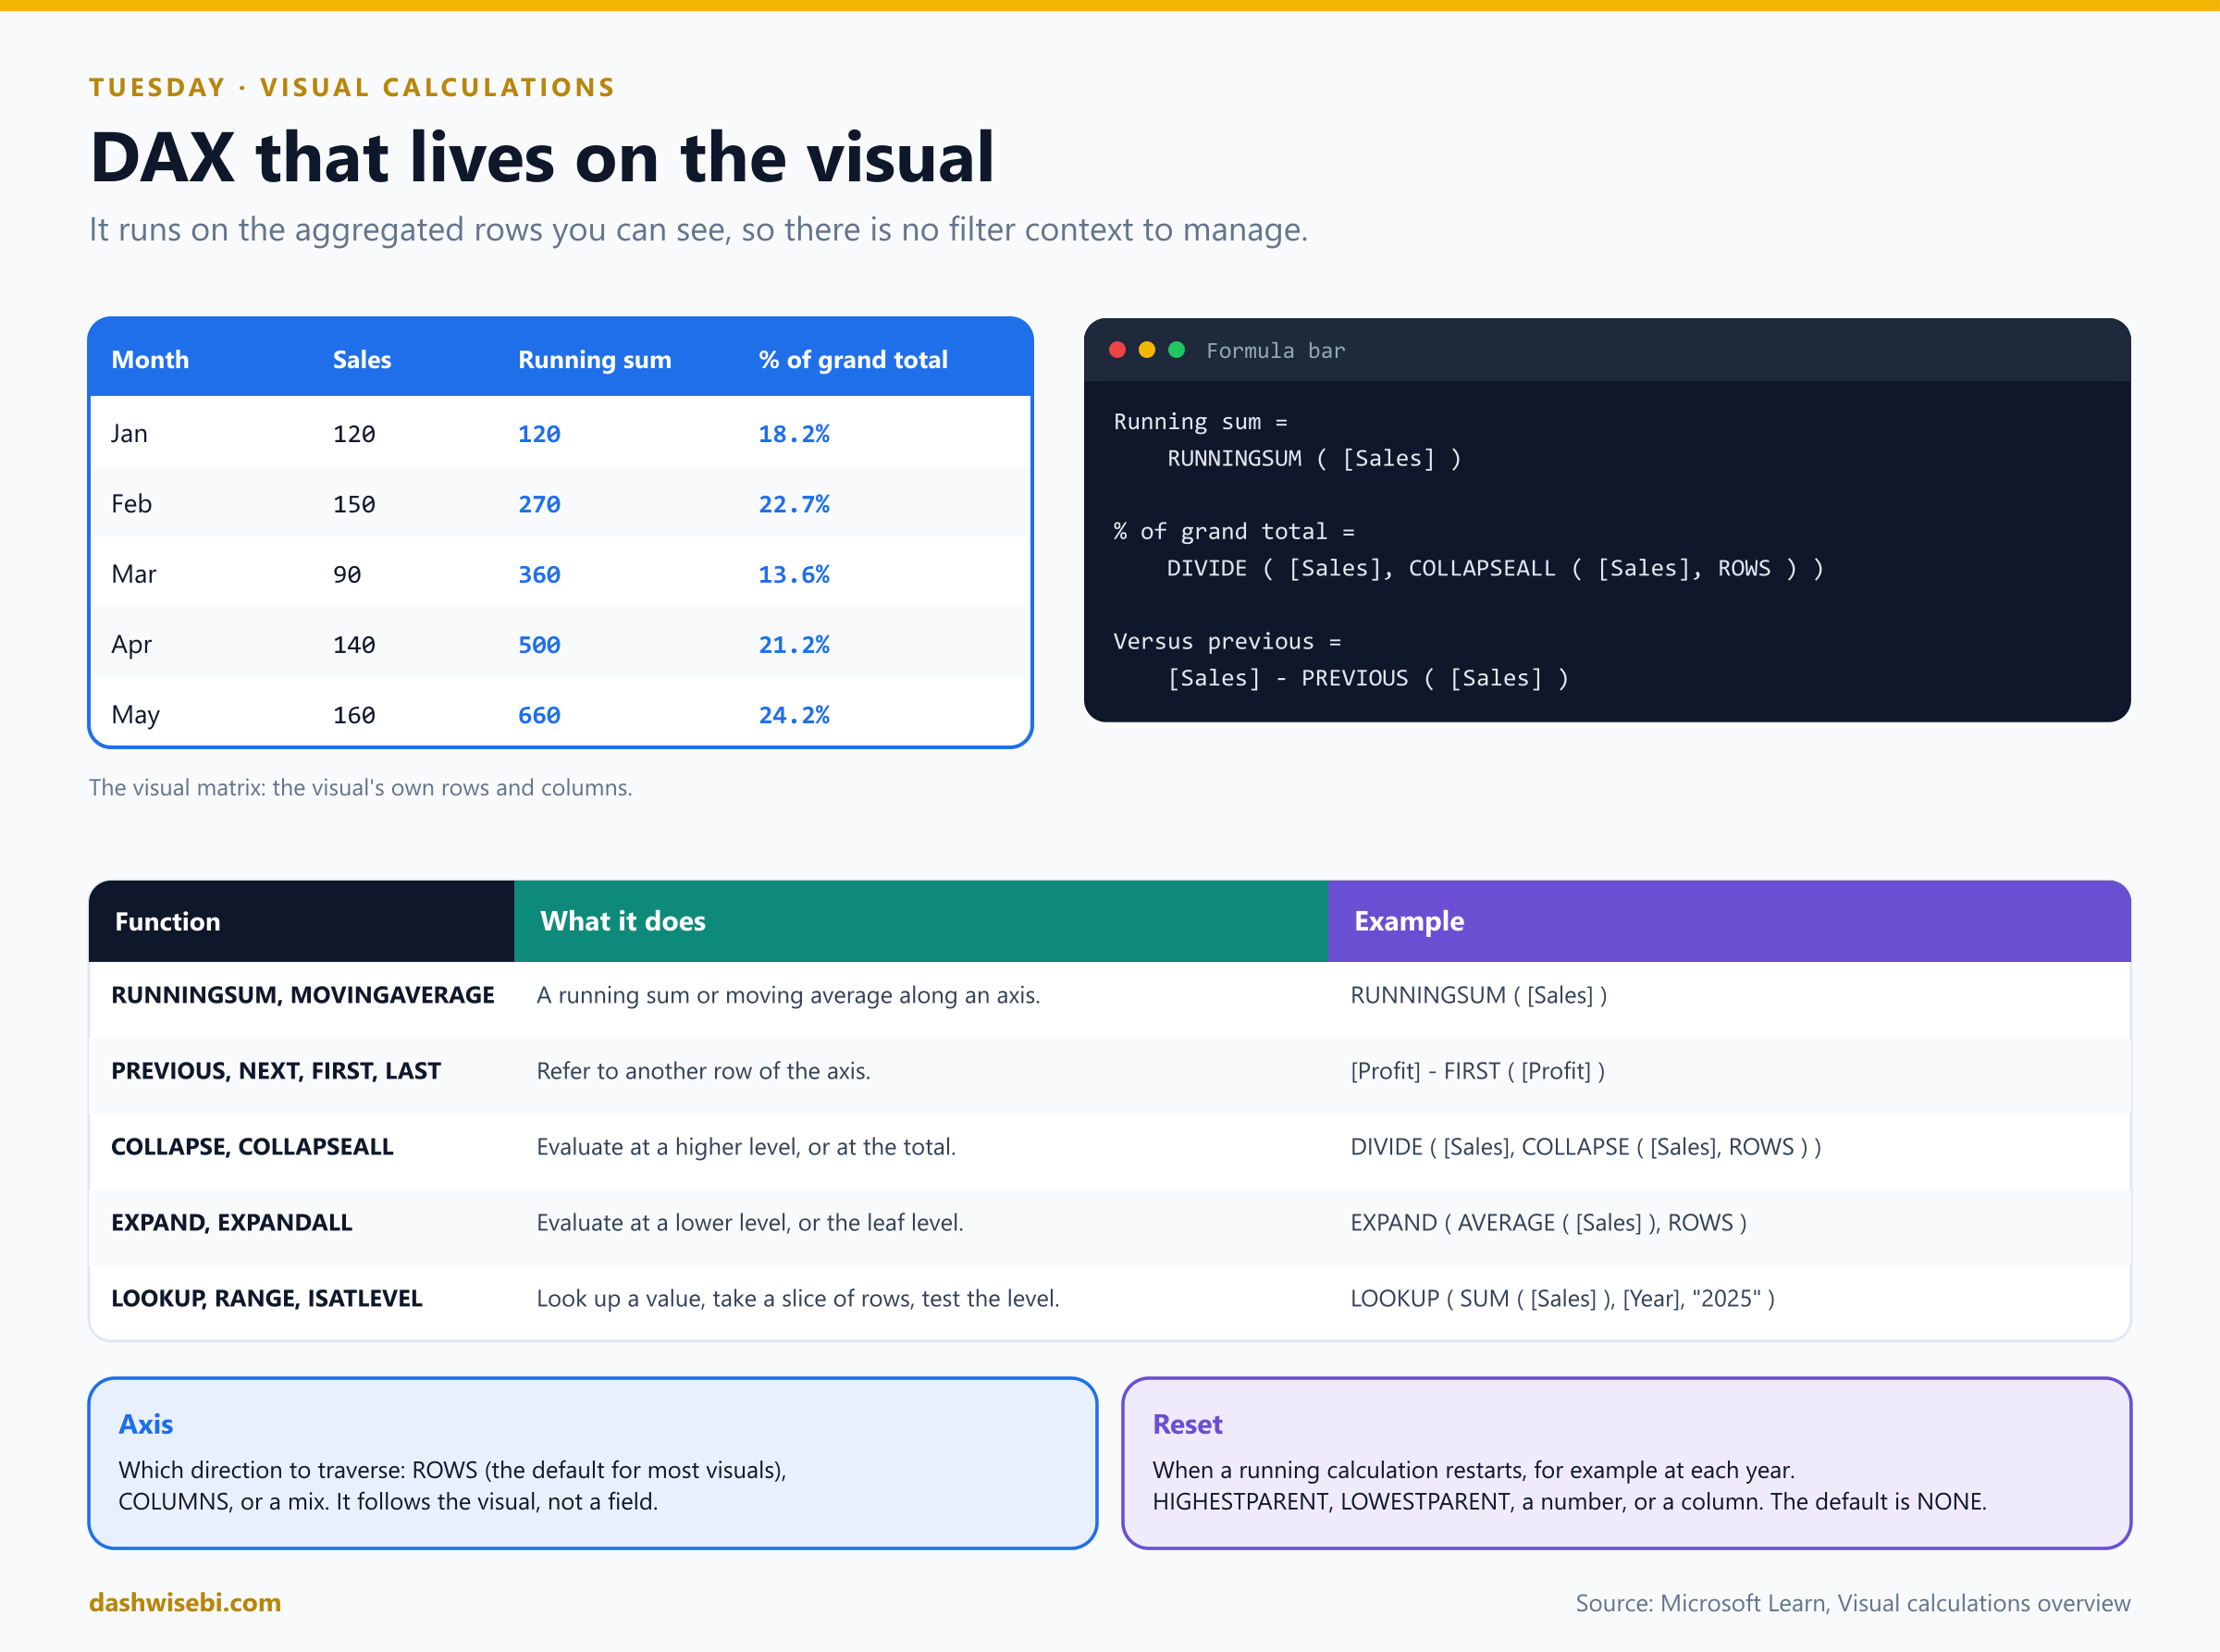
Running sum = RUNNINGSUM ( [Sales] )

Percent of grand total =
    DIVIDE ( [Sales], COLLAPSEALL ( [Sales], ROWS ) )

Versus previous = [Sales] - PREVIOUS ( [Sales] )
You can refer to fields that are on the visual (here [Sales]), and to other visual calculations. Fields the visual does not contain are not available to the calculation, but you can add a field to the visual and hide it, and then the calculation can use it.
Pause and decide. In the matrix above, what does the COLLAPSEALL ( [Sales], ROWS ) part return, and why is it the grand total?
It evaluates [Sales] at the highest level of the visual along the ROWS axis, which is the total of all rows. COLLAPSE goes up one level (percent of the parent), and COLLAPSEALL goes all the way to the top (percent of the grand total). So 120 of 660 gives 18.2 percent.
Pause and decide. The running sum must restart every year. Which argument controls that?
Reset. It tells a running calculation when to start over: HIGHESTPARENT, LOWESTPARENT, a number to say how many levels, or a column. For example, RUNNINGSUM ( [Sales], HIGHESTPARENT ) restarts at each year in a Year-then-Month hierarchy. The default is NONE, so it never restarts.
Pause and decide. A colleague copies your calculation from one matrix to a different chart and it does not work. Is that a bug?
No, it is a limit. A visual calculation lives on one visual. It is not part of the model, and you cannot share it across visuals or copy and paste it. If several visuals need it, write a measure instead.
Pause and decide. Meera wants the running sum in a slicer. Can a visual calculation do that?
No. Visual calculations are not supported on some visuals, including slicers, R and Python visuals, key influencers, the decomposition tree, Q&A and the smart narrative, and custom visuals. Also, you cannot filter or sort by a visual calculation, and you cannot pin the visual to a dashboard.
Why: the axis and the visual matrix
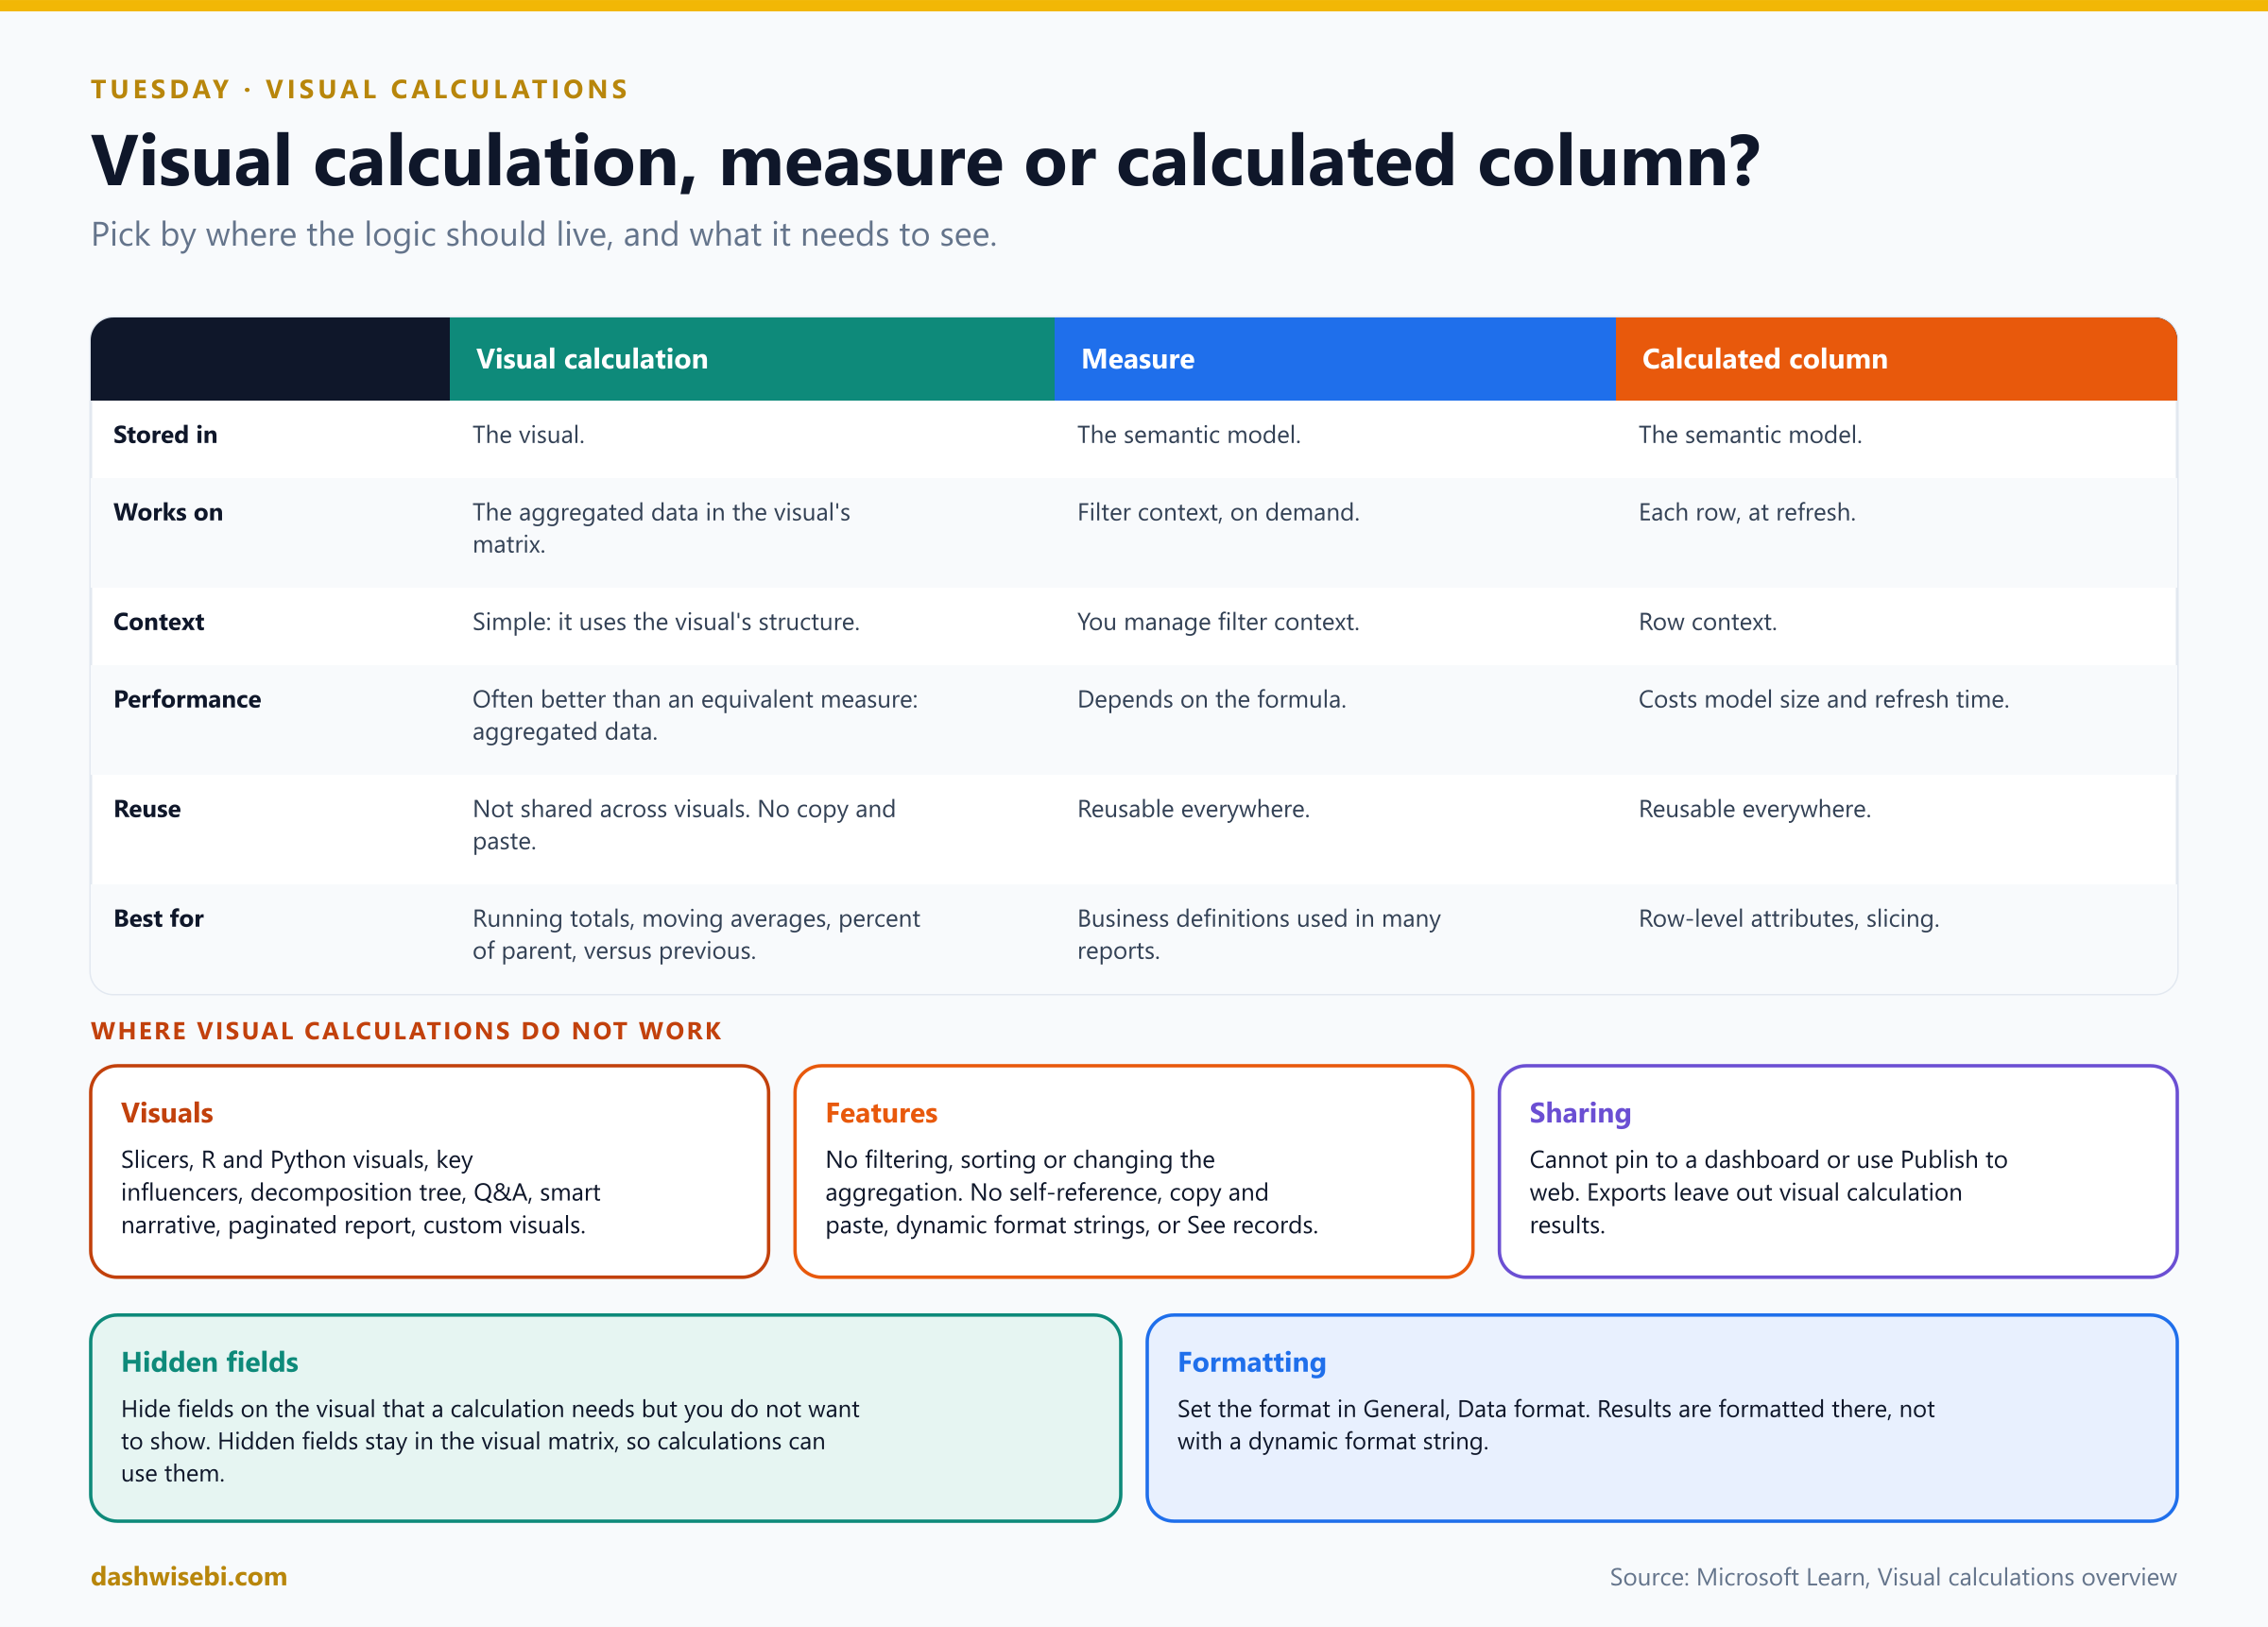
- Axis. Functions such as
RUNNINGSUM,PREVIOUSandMOVINGAVERAGEmove along an axis of the visual (rows or columns). If you do not set it, the function uses the default for the visual. - Starter templates. The edit bar offers templates for the common patterns: running sum, moving average, percent of parent, percent of grand total, average of children, and versus previous, next, first and last. You edit the template instead of starting from a blank line.
- Moving average.
MOVINGAVERAGE ( [Sales], 3 )averages over a window of three rows. Check how your visual shows the first rows before you trust them. - Performance. Because the calculation works on the already aggregated data, it can be simpler and cheaper than an equivalent measure. That does not make it a replacement for every measure.
- Formatting. Set the data format for the result in the visual's format settings. Dynamic format strings are not supported for visual calculations.
Exam lens
- Visual calculation = DAX on the visual's aggregated data. No filter context to manage. Stored with the visual, not the model.
- Know
RUNNINGSUM,MOVINGAVERAGE,PREVIOUS,NEXT,FIRST,LAST,COLLAPSE,COLLAPSEALL,EXPAND,EXPANDALL, and the axis and reset arguments. - Not shareable, not on every visual. Reusable logic belongs in a measure.
Tuesday, part 2. “Write me three sentences for the leadership deck”
At 5 p.m. Meera pops back. “The leadership meeting wants the story, not the charts. Three sentences, about this page.”
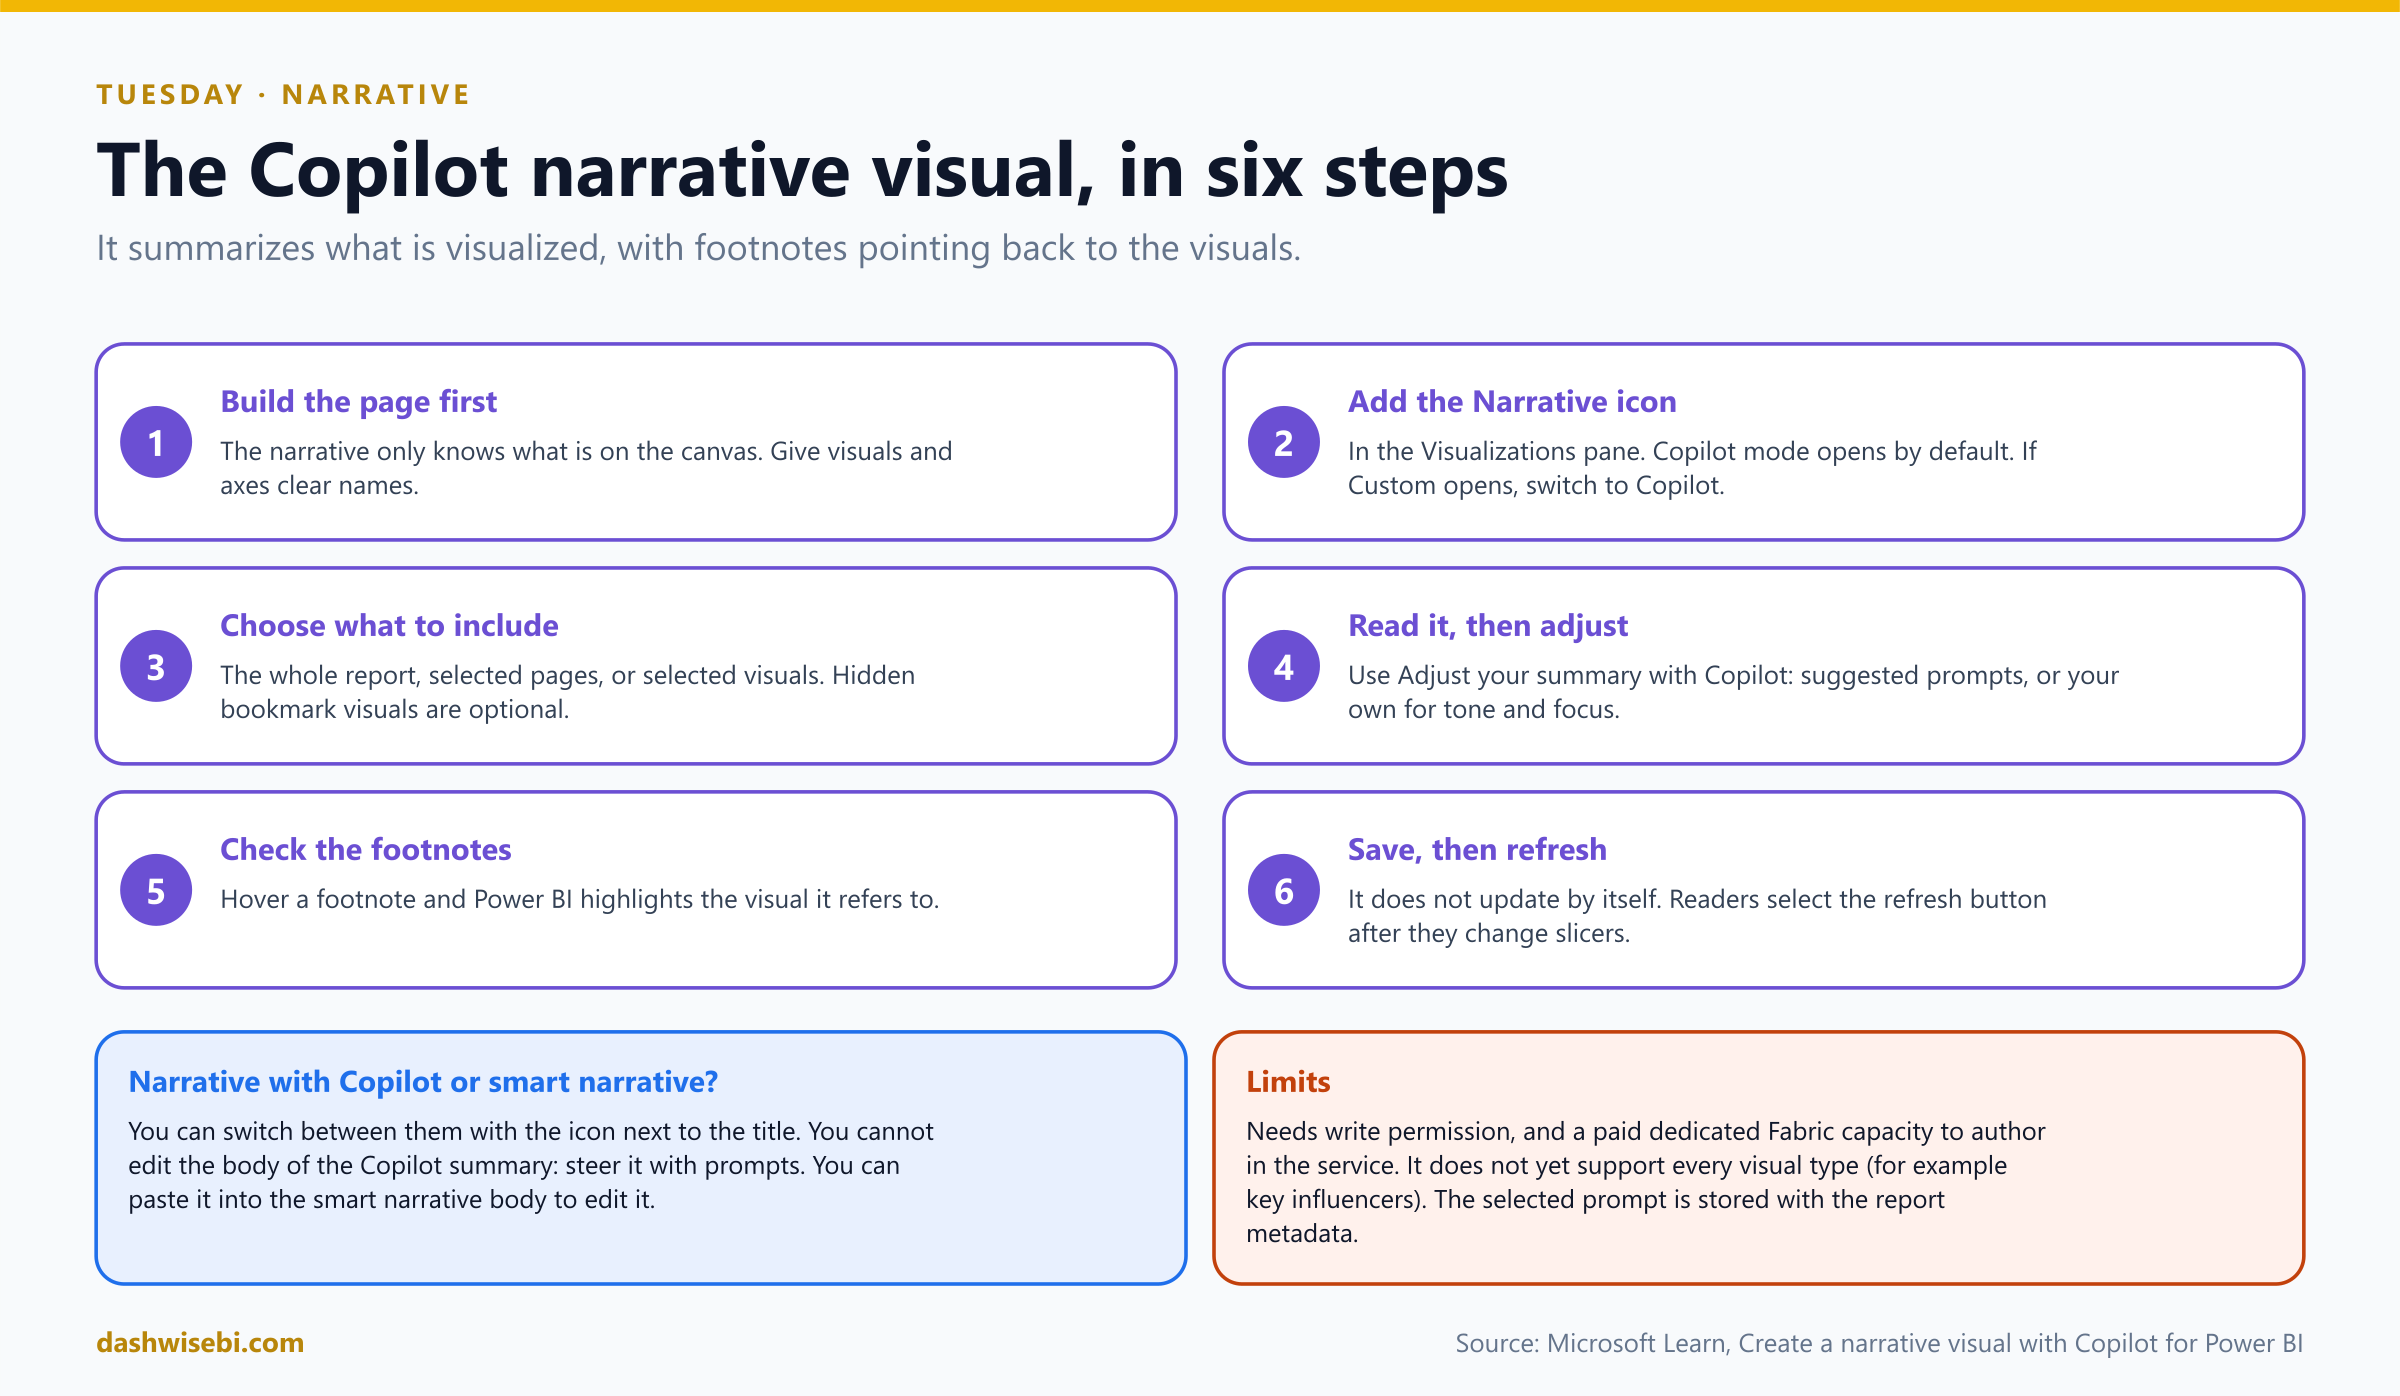
The narrative visual with Copilot writes that summary for you, and keeps it next to the report so it travels with it. Add the Narrative visual from the Visualizations pane and choose Copilot mode. Pick what it should read: the whole report, selected pages or selected visuals.
Pause and decide. Copilot's summary says “Sales rose steadily in March”, but your chart shows a dip. How do you check it?
Read the footnotes. Each statement points back to a visual, and hovering over a footnote highlights that visual. If the statement is wrong, change the prompt, or fix the visual, then regenerate. Never send an AI summary you have not checked.
Pause and decide. Meera wants the tone to be short and for executives. Where do you steer it?
Use Adjust your summary with Copilot: pick a suggested prompt or write your own (for example, shorter, focus on delivery, formal tone). You steer the narrative with prompts. You cannot edit the body text directly in the Copilot version.
Pause and decide. A reader filters the page to Pune. The narrative still talks about the whole company. Why?
The narrative does not update by itself. Readers must select the refresh button after they change slicers or filters, and you have to save the report for the text to persist.
Pause and decide. When would you use the smart narrative instead of the Copilot narrative?
When you want editable text or dynamic values you control. The smart narrative lets you edit the text and insert dynamic values. The Copilot narrative is for AI summaries you steer with prompts. You can switch between the two, and you can paste a Copilot summary into the smart narrative to edit it.
Why: limits worth knowing
- It reads the report canvas, not the model. If a number is not on a visual, the narrative cannot know it. Visuals and axes with clear names give better text.
- Permissions and capacity. Writing one needs write permission on the report and a paid capacity, like other Copilot features.
- Not every visual is supported yet (the key influencers visual is an example in Microsoft's notes).
- The chosen prompt is stored with the report metadata. Do not paste anything confidential into it.
You select “shorter”, check the three footnotes, and save. Meera reads the paragraph, nods, and asks whether the dip in March is real. That is Wednesday's problem.
Exam lens
- Narrative visual with Copilot: choose the whole report, pages or visuals. Steer with prompts. Check footnotes.
- It does not refresh by itself. Readers select refresh after changing filters.
- Smart narrative = editable text. Copilot narrative = AI summary steered by prompts.
Wednesday, part 1. “Who are our customers, really?”
Meera is leaning on your monitor. “We have 3,000 customers. I cannot read a chart with 3,000 dots. Put them in buckets. And tell me what our order sizes look like.”
Three features turn many values into a few meaningful chunks. They sound alike, so keep them apart:
- Grouping puts categories you choose into one bucket.
- Binning cuts a number or date into equal-sized ranges.
- Clustering lets Power BI find the groups, by similarity.
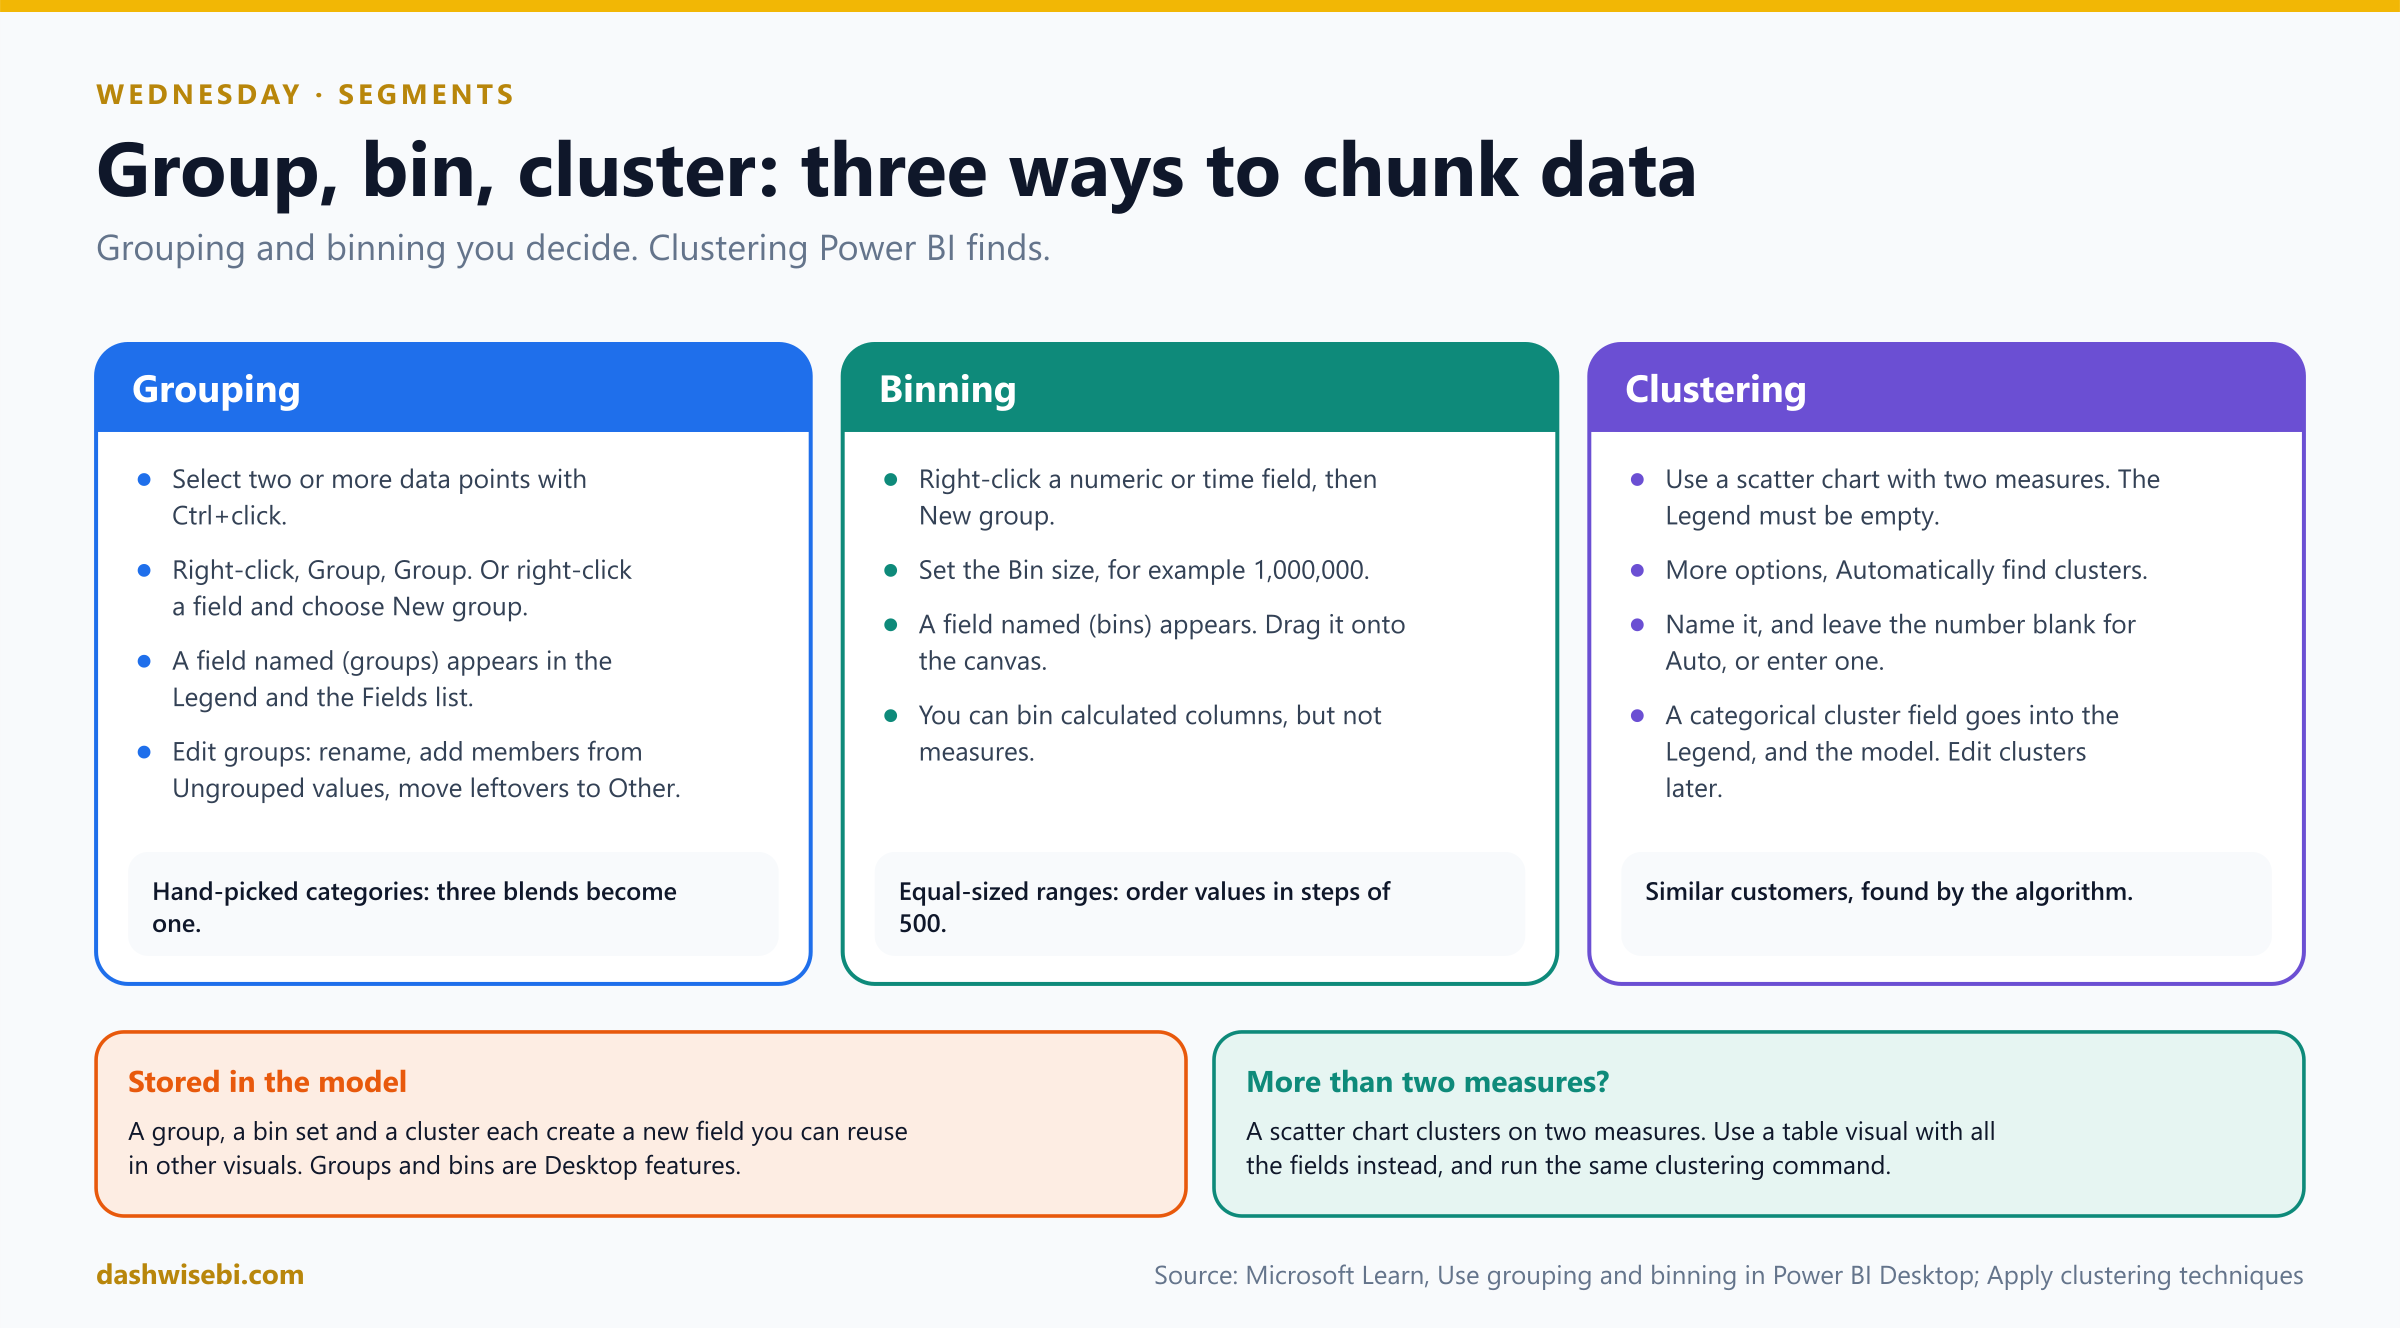
Pause and decide. Three tea blends, Masala, Ginger and Cardamom, should be reported as “Spiced”. Which feature?
Grouping. Select the data points with Ctrl+click, right-click, then Group. Power BI adds a field named (groups) to the Legend and the Fields list. You can edit it later: rename groups, add members from Ungrouped values and move leftovers to Other.
Pause and decide. Meera wants order values in ranges of 500 rupees. Which feature, and what do you set?
Binning, with a bin size of 500. Right-click the numeric (or date and time) field, choose New group, and set the size. Power BI adds a field named (bins), and you drag it onto the canvas. You can bin calculated columns, but not measures.
Pause and decide. She wants to “find customers who behave alike” without defining the groups. Which feature, and on which visual?
Clustering, on a scatter chart with two measures (for example orders against revenue per customer), with the Legend empty. Open the visual's More options and choose Automatically find clusters. Name it, and either leave the number of clusters blank (Power BI decides) or enter one. The result is a new categorical field that goes into the Legend, and into the model, so you can use it elsewhere.
Pause and decide. You have three measures, not two, to cluster on. What do you do?
A scatter chart can cluster on two measures. Use a table visual with the fields instead, and run the clustering command there. (The clustering walkthrough is in Microsoft's training material, so confirm the exact steps in the version of Power BI you use.)
Why: all three create fields you can reuse
- A group, a bin set and a cluster each become a new field in the model, so you can drop them in other visuals and slicers.
- Grouping and binning are Desktop features. Group by hand when you know the categories. Cluster when you do not.
- An Other group is the safety net: new values that you did not place yet land there instead of disappearing.
- Bin size is the lever. Too small and you recreate the original chart. Too large and the shape disappears.
The cluster scatter shows four crowds of customers. One is small, high-value and orders rarely. Meera names it “wedding caterers”. You did not tell her that. The data did.
Exam lens
- Group: you pick the members. Bin: equal ranges, bin size. Cluster: Power BI finds them.
- Bins: numeric and date fields and calculated columns, not measures.
- Clustering: scatter chart, empty Legend, Automatically find clusters.
Wednesday, part 2. “What drives late deliveries?”
After lunch, Meera again. “On-time delivery slipped to 87 percent. Do not guess. Show me what is behind it.”
That question belongs to the AI visuals. The exam expects you to choose the right one from a plain-language question:
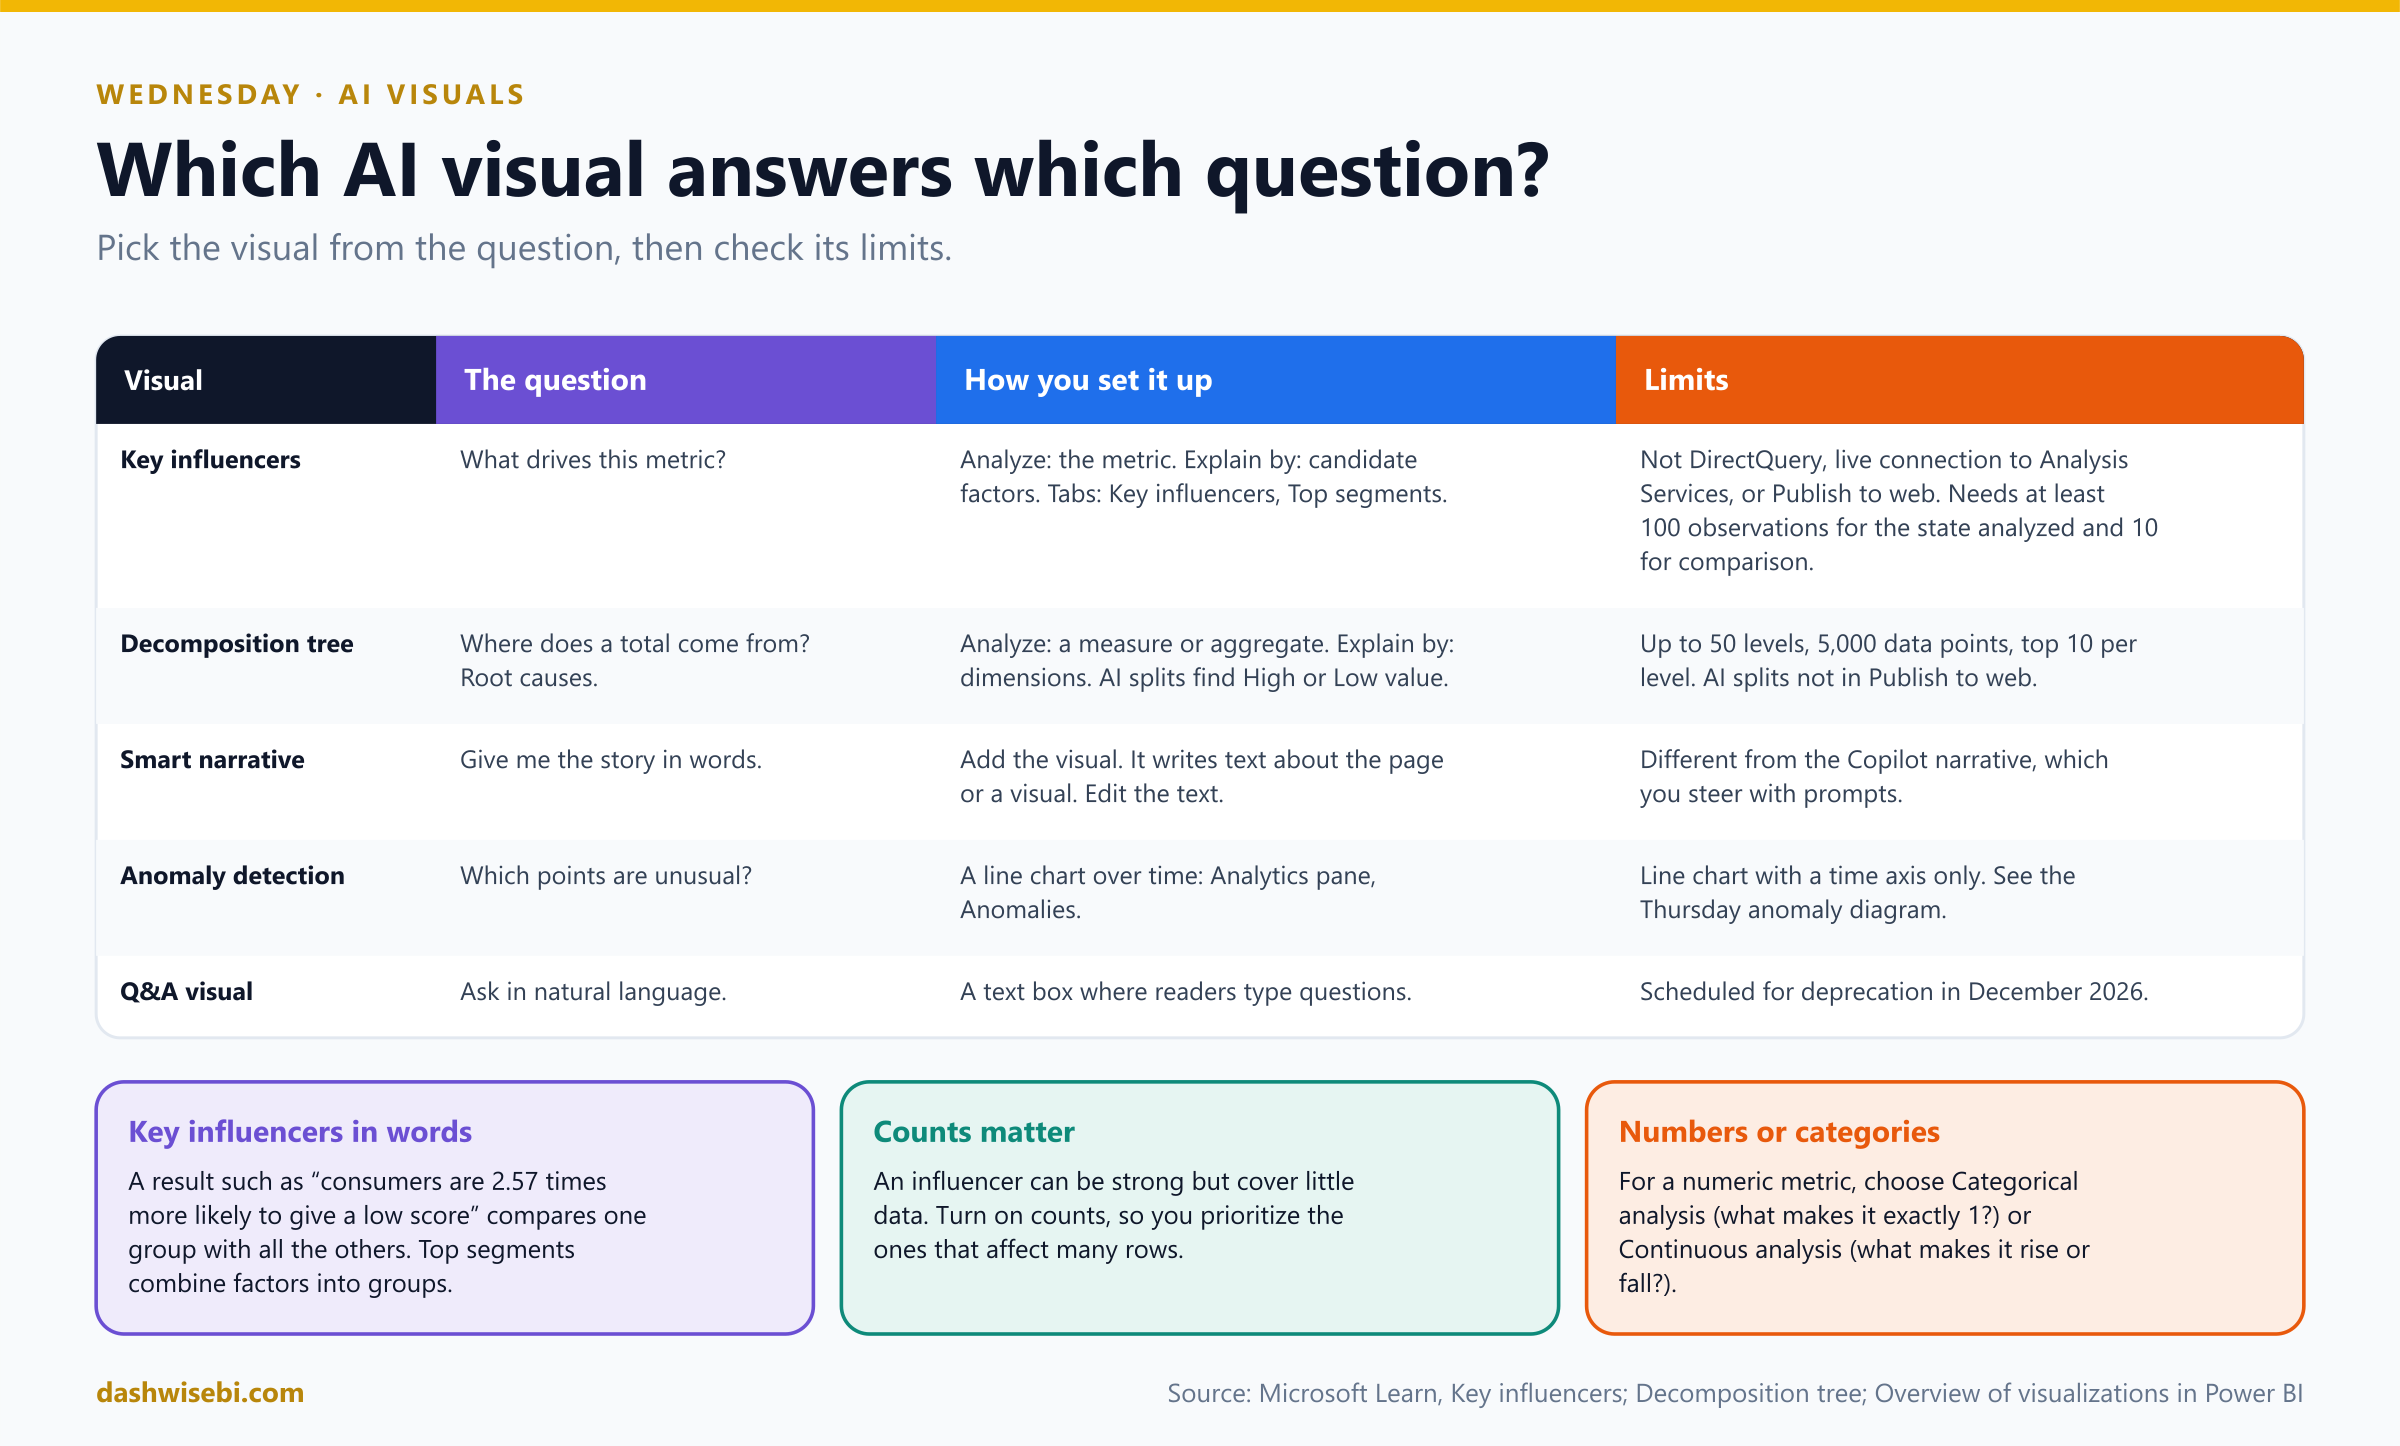
Pause and decide. “What makes a delivery late?” Which AI visual?
Key influencers. Put the metric in Analyze (for example Delivery late = Yes) and the candidate factors in Explain by. The Key influencers tab ranks what increases the likelihood. A result reads like “when the order is placed after 8 p.m., delivery is 2.5 times more likely to be late”. Top segments shows groups of customers with combined factors.
Pause and decide. Key influencers lists a factor in the third place, but the factor covers only a few orders. Should you act on it first?
Not necessarily. An influencer can be strong and still cover very little data. Turn on the count information and weigh both how strong it is and how many rows it affects.
Pause and decide. The metric is a number (minutes late), not Yes or No. What choice does the visual ask you to make?
Between Categorical analysis (what makes it exactly this value, such as 1?) and Continuous analysis (what makes it increase or decrease?).
Pause and decide. “Total late minutes is 1.2 million. Where does it come from?” Which visual?
The decomposition tree. Put the measure in Analyze, the dimensions (city, product, hub) in Explain by, and drill down in any order. The AI splits (High value and Low value) suggest the dimension that most increases or decreases the metric, so you do not have to guess where to look next.
Why: know the limits, they get tested
- Key influencers: not supported with DirectQuery, live connections to Analysis Services, or Publish to web. It needs enough data: at least 100 observations for the state you analyze and 10 for the comparison.
- Decomposition tree: up to 50 levels, 5,000 data points and the top 10 values per level. AI splits are not available in Publish to web.
- Smart narrative writes text about a page or a visual. It is different from the Copilot narrative (Tuesday), and you edit its text directly.
- Q&A visual: readers type questions. It is scheduled for deprecation in December 2026, so do not build new reports around it.
- These visuals show associations in the data. They suggest where to look, and they do not prove cause.
The tree splits the late minutes by hub. One hub owns most of them. The key influencers visual says orders after 8 p.m. are the biggest driver. Two visuals, one story, and you did not write a line of DAX.
Exam lens
- What drives X? Key influencers (Analyze, Explain by). Where does the total come from? Decomposition tree.
- Key influencers: categorical vs continuous analysis, counts, top segments, minimum rows.
- Not available with DirectQuery (key influencers) or in Publish to web (AI splits).
Thursday, part 1. “Orders fell in week three. Why?”
Thursday morning, a dip on the weekly line. Meera points at it. “That one. What happened?”
The Analyze feature answers exactly that, in two clicks. Right-click a data point on a bar or line chart, choose Analyze, then Explain the increase (or Explain the decrease, when the previous bar was higher) or Find where this distribution is different. Power BI compares the point with the one before it, so the first point has nothing to compare to.
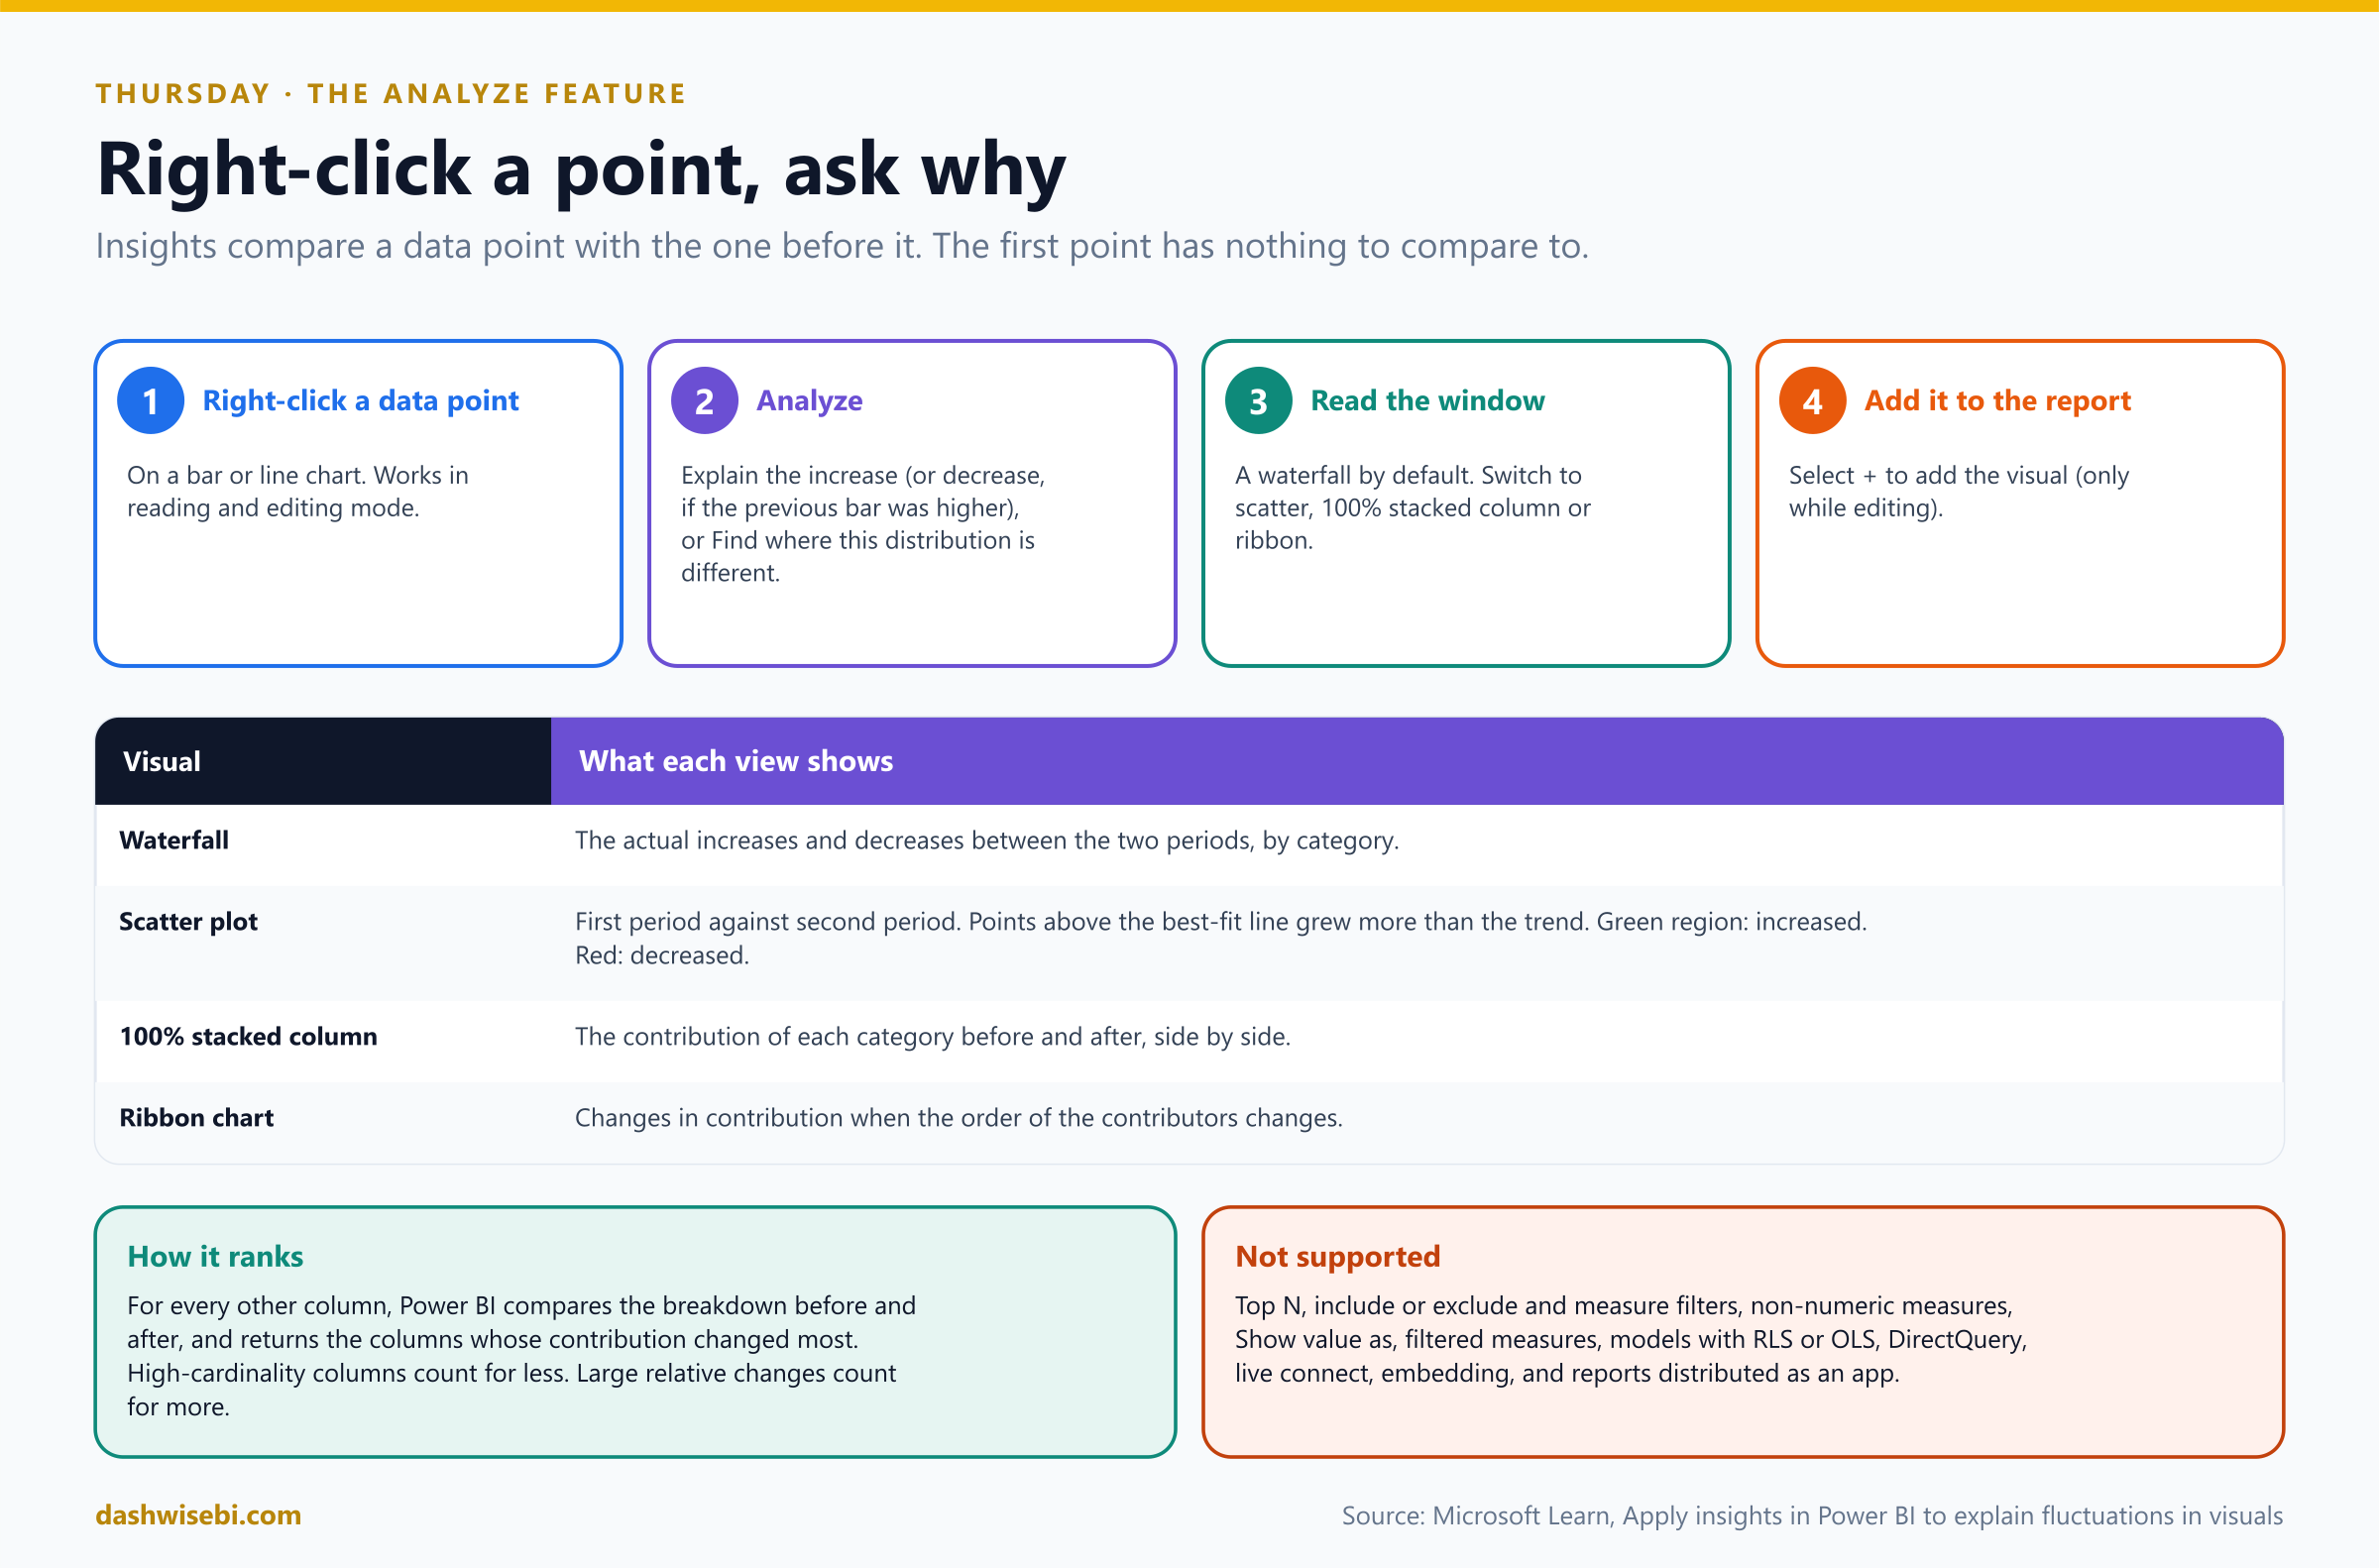
Pause and decide. Which data point do you right-click to ask “why did week three drop?”
Week three itself. The insight compares week three with week two. Power BI looks at every other column in the model, compares the before and after breakdown, and returns the columns whose contribution changed the most.
Pause and decide. The window opens with a waterfall chart. What are your other views, and when does each one help?
Scatter (first period against second period: points above the best-fit line grew faster than the trend), 100% stacked column (each category's share before and after), and ribbon (how the order of contributors changed). Switch between them until the story is clear.
Pause and decide. You like the waterfall and want it on the report page. How?
Select the + button to add the visual to the report. That works only while editing the report. You can open the Analyze window in reading and editing mode.
Pause and decide. Analyze is missing from the right-click menu on one chart. What are the usual blockers?
Unsupported situations include Top N, include/exclude and measure filters, non-numeric measures, Show value as, filtered measures, models with row-level or object-level security, DirectQuery, live connections, embedded reports and reports distributed as an app.
Why: it ranks columns, so wording matters
- High-cardinality columns (many distinct values) count for less, and large relative changes count for more. A column that explains a big part of the change is shown first.
- It is a starting explanation. Always confirm with a visual of your own before you tell Meera what happened.
Exam lens
- Right-click a point, Analyze, Explain the increase/decrease or Find where this distribution is different.
- Views: waterfall, scatter, 100% stacked column, ribbon. Add to report with + (edit mode).
- Not with RLS, DirectQuery, live connection, Top N or measure filters.
Thursday, part 2. “Which days were truly strange?”
The dip had a cause, but Meera wants more. “Did we have other odd days this quarter? Do not make me read ninety dots.”
Two different tools, two different shapes of data:
- Anomaly detection is for a time series. Select the line chart, open the Analytics pane, and add Anomalies. Power BI draws an expected range and marks the points that fall outside it.
- Outliers in other data are found with ordinary tools: a scatter chart (points far from the crowd), percentile reference lines, or the Analyze feature's Find where this distribution is different.
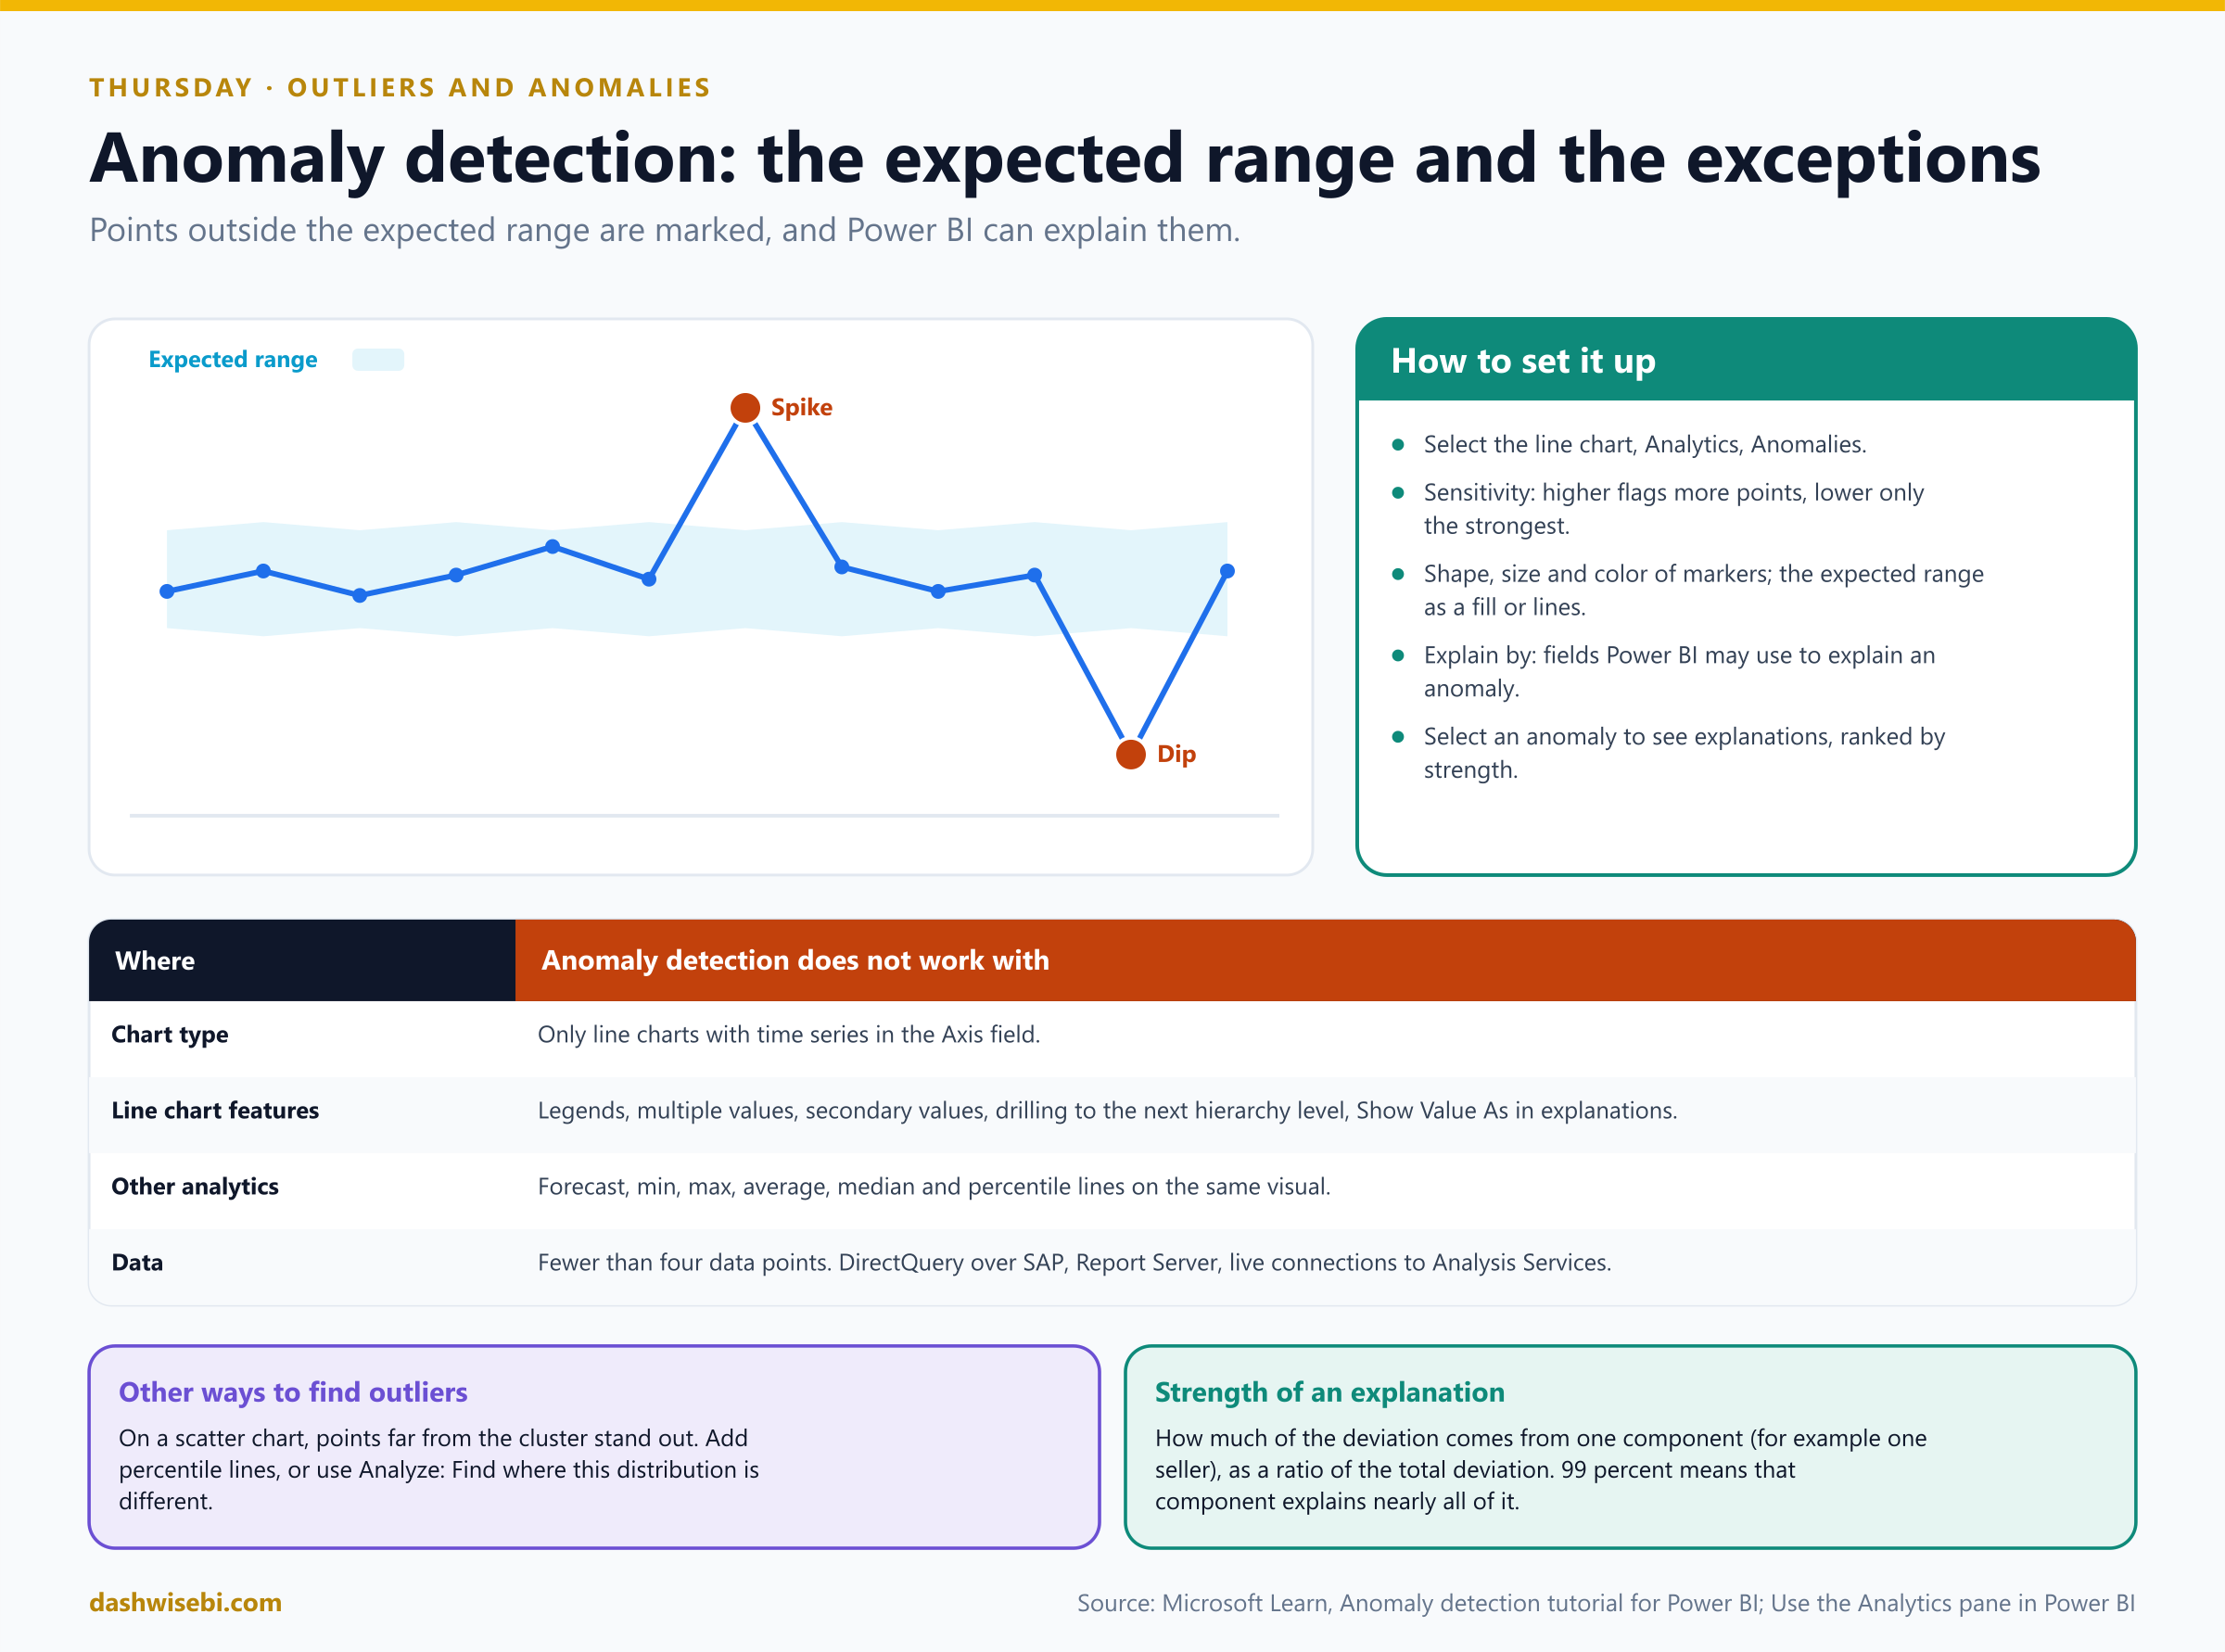
Pause and decide. The chart marks too many dots. What do you adjust?
The sensitivity. A higher setting flags more points, and a lower one flags only the strongest anomalies. You can also change the marker shape, size and color, and show the expected range as a fill or as lines.
Pause and decide. Select an anomaly and Power BI offers “possible explanations”. How is a strength such as 99 percent read?
It is how much of the deviation comes from one component (for example, one hub), as a ratio of the total deviation. Roughly, 99 percent means that one component explains nearly all of the anomaly. You can choose which fields it may use in Explain by.
Pause and decide. You add both anomaly detection and a forecast to the same line chart. What happens?
They do not work together. Anomaly detection also does not work with min, max, average, median or percentile lines on the same visual. Use a copy of the chart for each.
Pause and decide. Which of these charts can show anomaly detection: a column chart, a line chart with a legend, a line chart with a date on the Axis?
Only the line chart with a time series on the Axis. Legends, multiple values, secondary values, and drilling to the next hierarchy level are not supported. It also needs enough points (fewer than four does not work) and does not work on DirectQuery over some sources or live connections to Analysis Services.
Why: an anomaly is not an error
- The expected range comes from the pattern in your own data. Holidays, launches and outages look like anomalies, and they are real events. Decide whether to investigate, explain or correct.
- For non-time data, a scatter chart makes outliers visible. Add a percentile line (for example, the 95th) to mark an agreed cutoff.
- An outlier is not always to be deleted. A single huge order may be your best customer.
Exam lens
- Anomaly detection: line chart + time series, Analytics pane, sensitivity, explain by.
- Not with forecast or min/max/average/median/percentile lines on the same visual.
- Other outlier approaches: scatter chart, percentile lines, Analyze.
Thursday, part 3. “And what about next month? And how sure are you?”
Meera again, last question of the day. “Give me a target line on the chart, and a guess for next month. And please show me how uncertain the numbers are. I do not want a fairy tale.”
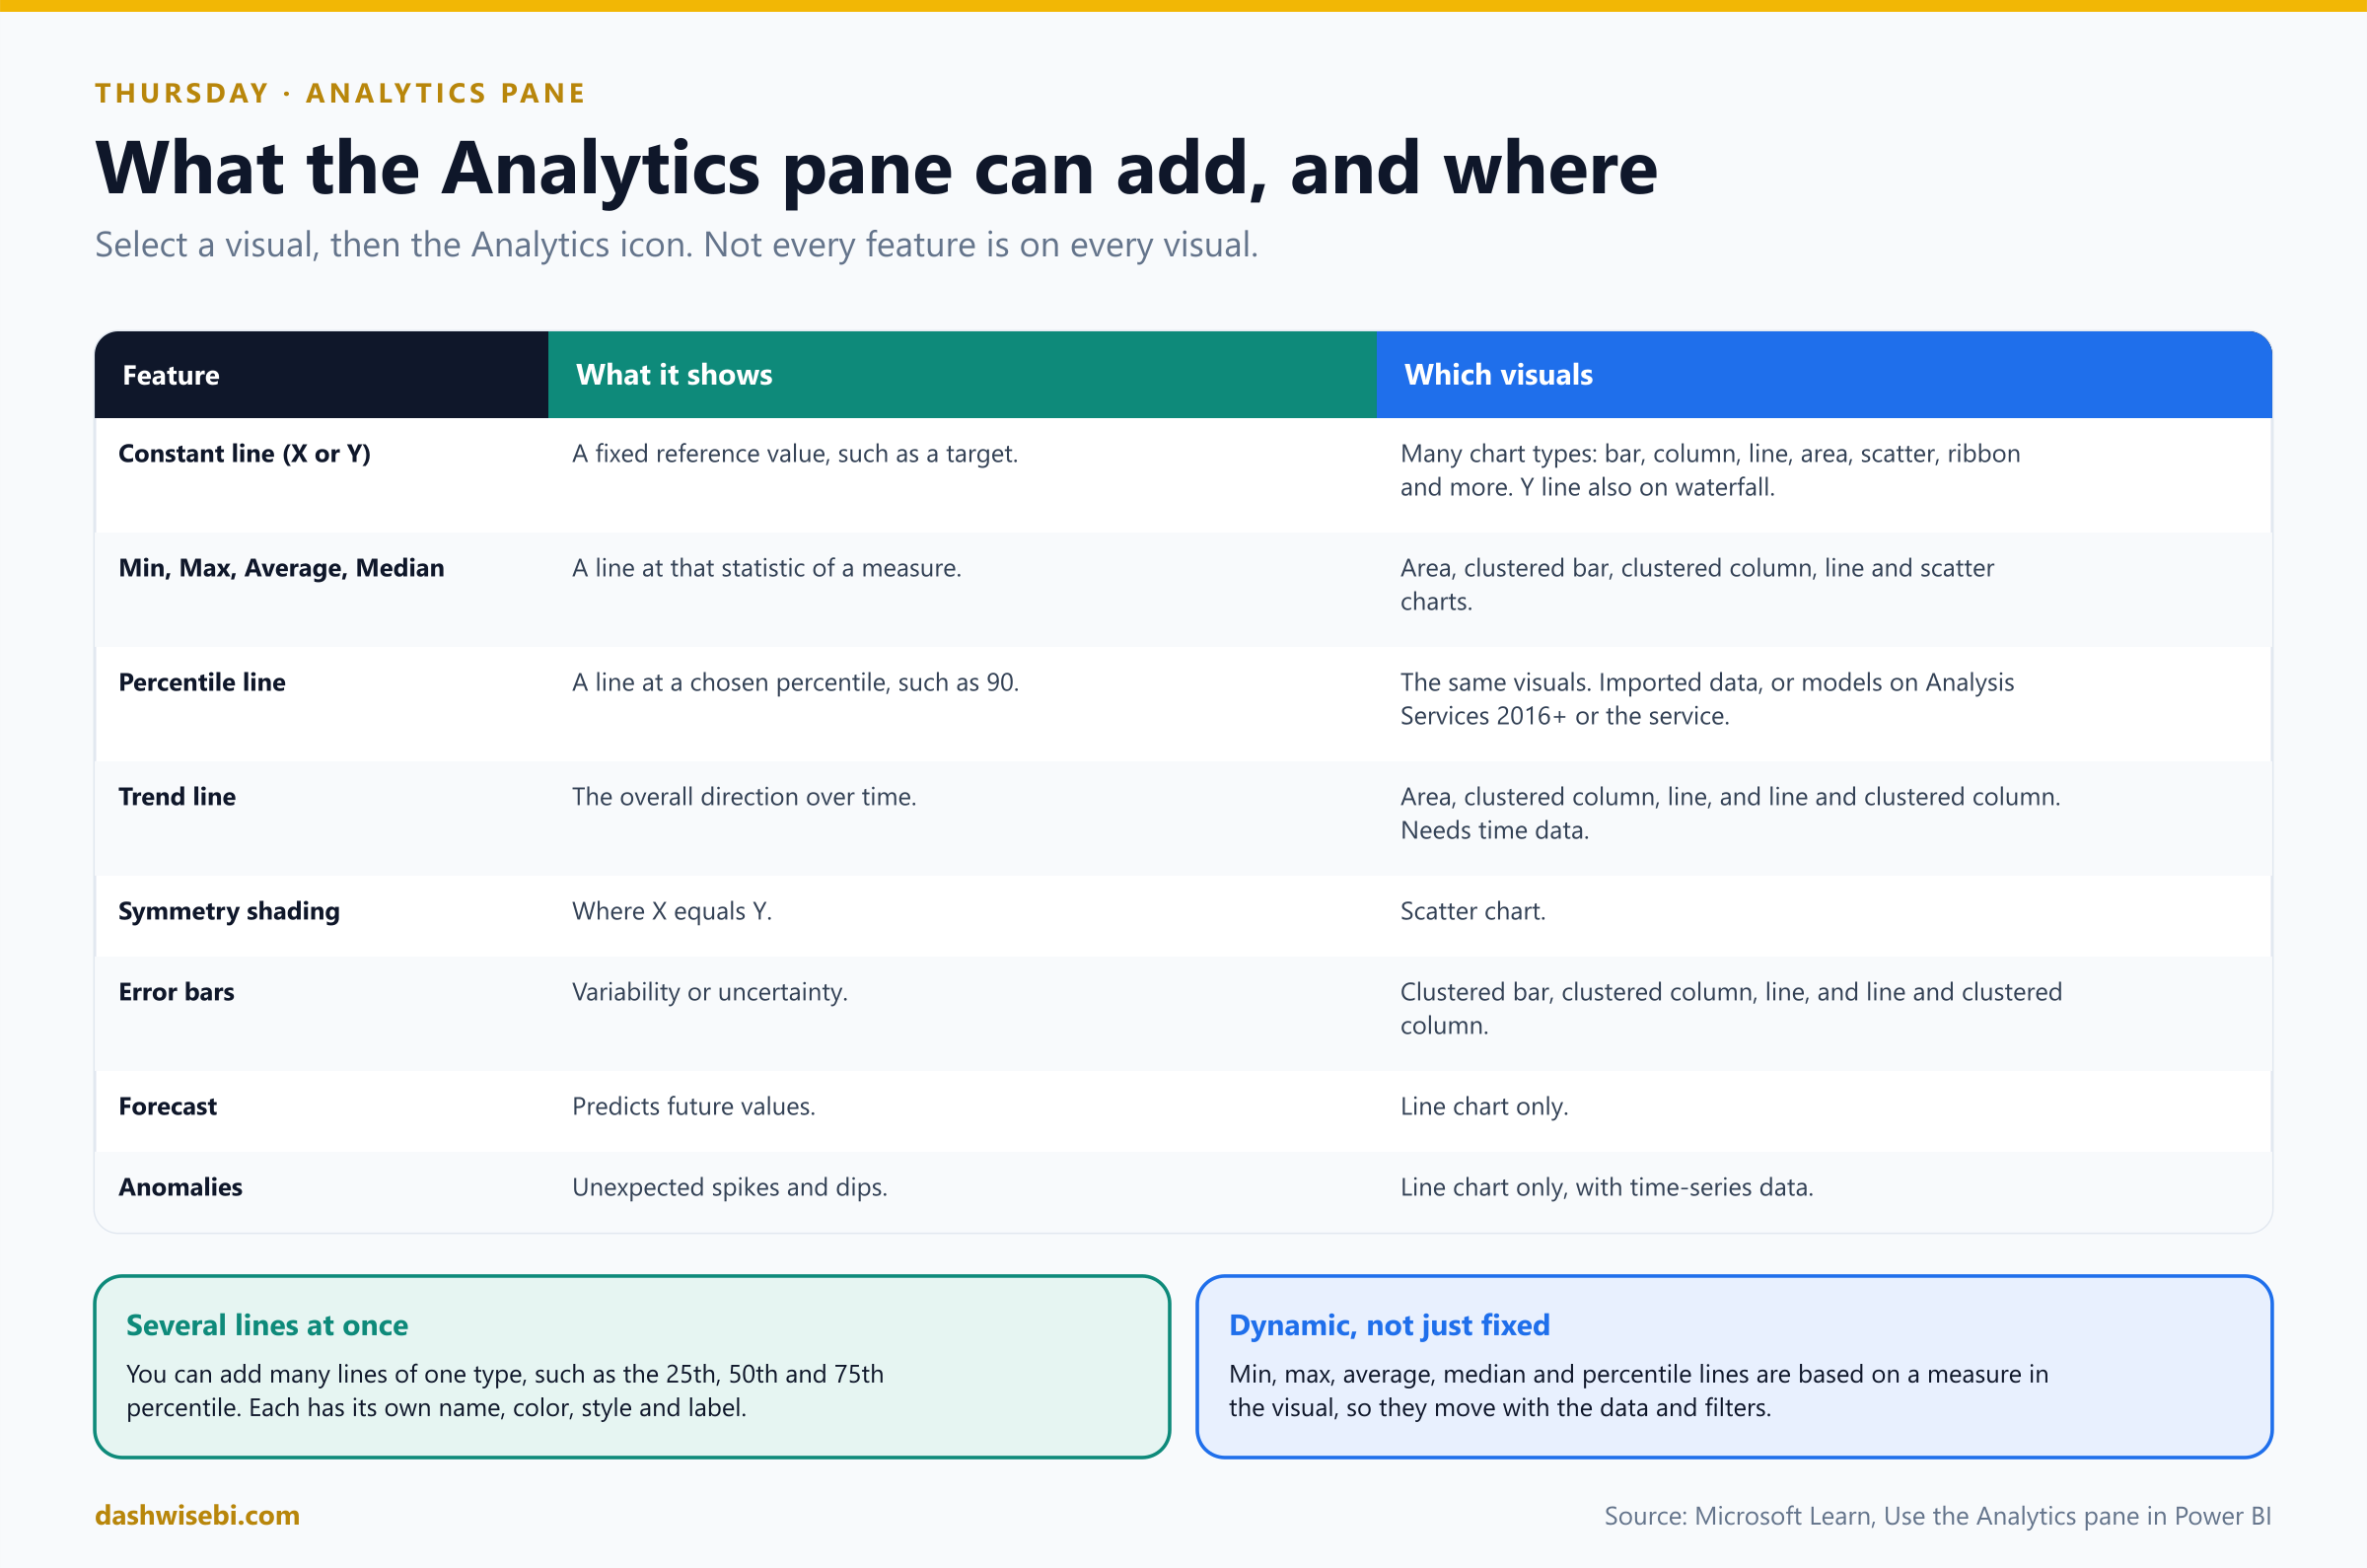
Everything here lives in one place: the Analytics pane. Select a visual, then the magnifying-glass icon. Which options appear depends on the visual type.
Pause and decide. The target is 5,000 orders a week and must be drawn on the column chart. Which feature?
A constant line (X or Y) at 5,000. For a statistic that follows the data instead, use min, max, average, median or a percentile line, which are based on a measure in the visual and move with filters. You can add several lines of one type, such as the 25th, 50th and 75th percentile.
Pause and decide. Forecast is missing from the pane on a clustered column chart. Why?
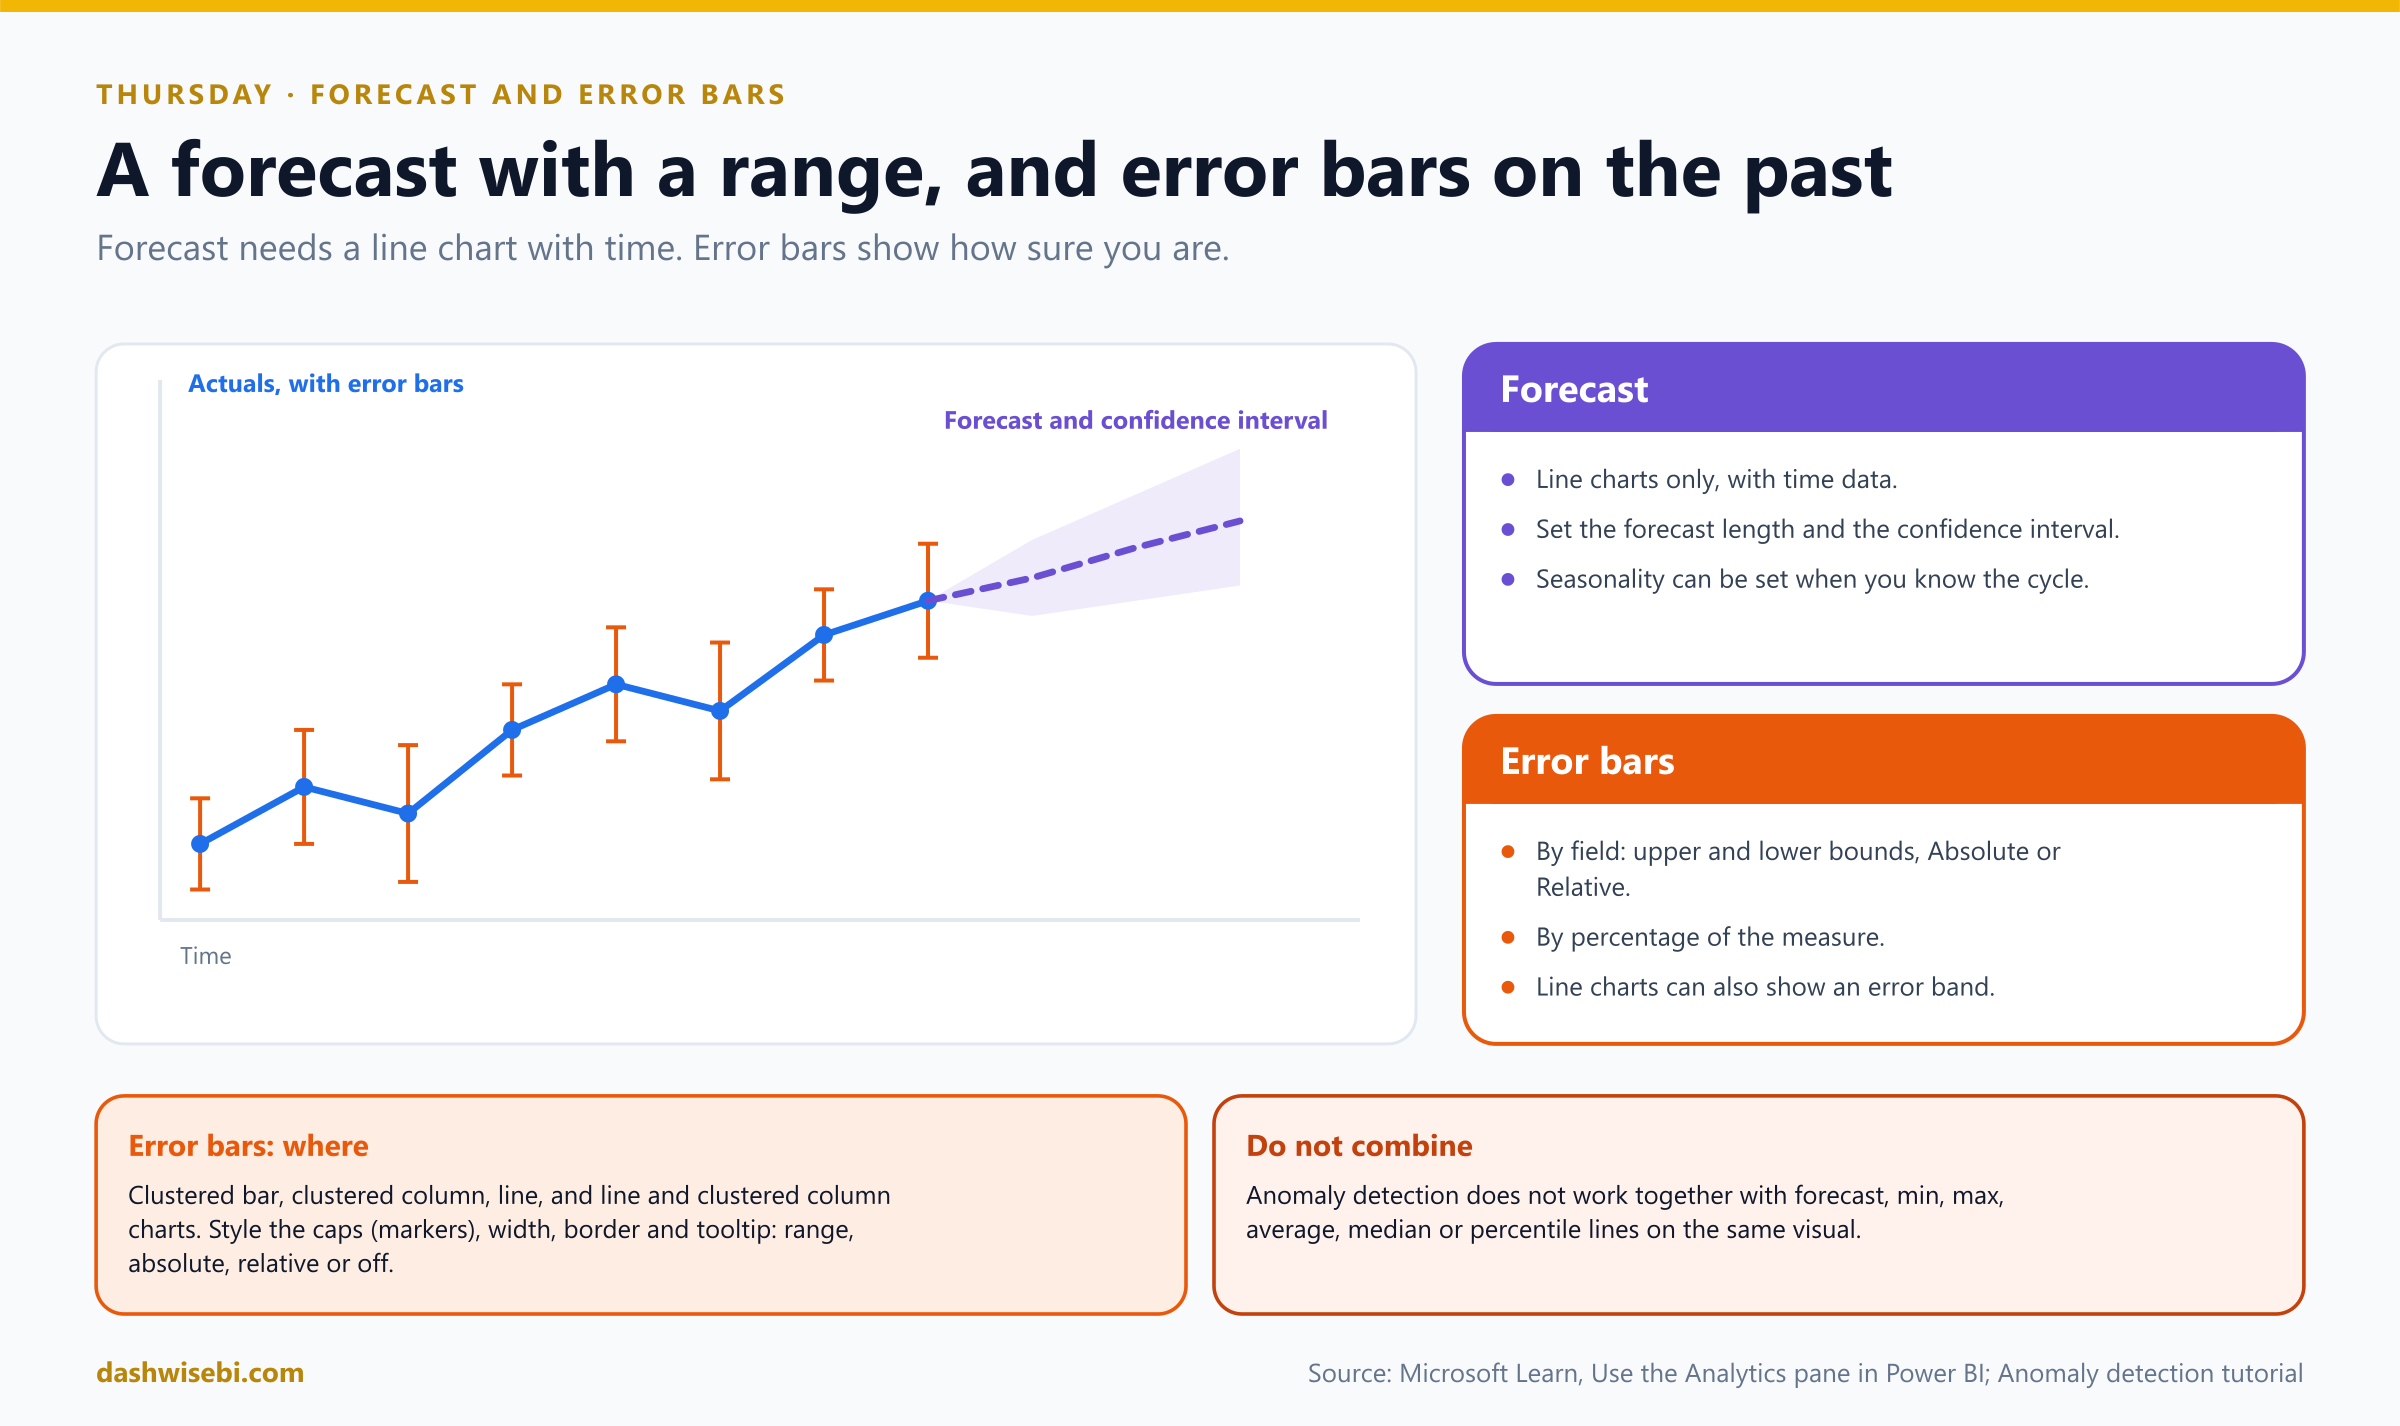
Forecast works on line charts only, with time data. Convert the chart to a line chart.
Pause and decide. What do you set when you add a forecast?
The forecast length, the confidence interval (the shaded range around the forecast) and, if you know the cycle (such as weekly), the seasonality. The shaded range widens further out, because uncertainty grows with distance.
Pause and decide. Meera wants to show how reliable the monthly average delivery time is. Which feature?
Error bars. Add them from the Analytics pane for clustered bar, clustered column, line, and line and clustered column charts. They show variability: set them by field (upper and lower bound, absolute or relative) or by a percentage. You can style the caps, width and border, and choose what the tooltip shows. Line charts can also show an error band.
Why: forecasts are guesses with a range
- A forecast extends the pattern in the data you have. It does not know about a price change, a new city or a holiday next month.
- Show the confidence interval. A single line looks more certain than it is, and this is the point of Meera's “fairy tale” remark.
- The Analytics pane is for exploring. For a number that every report must agree on (a target, a threshold), put it in a measure.
- Constant lines are fixed values you type. The statistic lines are dynamic.
Your forecast says about 5,400 orders next month, with a band from 4,900 to 5,900. Meera studies the band for a long time. “That is the first honest forecast I have seen here,” she says.
Exam lens
- Analytics pane: constant, min, max, average, median, percentile lines; trend line; symmetry shading; error bars; forecast; anomalies.
- Forecast: line chart only. Set length, confidence interval and seasonality.
- Error bars: clustered bar and column, line, line and clustered column. By field or by percentage.
Friday. “Show me what you found, and how sure you are”
Friday, 4 p.m. Meera sits at the head of the table. The model has a name for every field. The report has a Copilot-drafted first page, a visual calculation, four customer clusters, two AI visuals, a flagged anomaly and a forecast with a band. She turns to you. “Answer ten quick questions, then we ship it.”
Pause and decide. 1. You need the story of an unknown model in a minute. What first?
Ask Copilot to summarize the semantic model.
Pause and decide. 2. Copilot cannot create a page for a model. Name three possible causes.
Q&A switch off, a streaming model, a live Analysis Services connection, or implicit measures disabled.
Pause and decide. 3. A running total that restarts each year, on a matrix. Which feature, and which argument?
A visual calculation with RUNNINGSUM and the reset argument (HIGHESTPARENT).
Pause and decide. 4. A business definition used in ten reports. Visual calculation or measure?
A measure. Visual calculations cannot be shared across visuals.
Pause and decide. 5. The Copilot narrative shows old numbers after a filter. What do you do?
Select refresh on the narrative. It does not update by itself.
Pause and decide. 6. Revenue must be shown in ranges of 500. Which feature? Can it use a measure?
Binning. You can bin numeric and date fields and calculated columns, not measures.
Pause and decide. 7. “What drives churn?” versus “Where does the churn total come from?”
Key influencers versus the decomposition tree.
Pause and decide. 8. Which visual types can show forecast and anomaly detection?
The line chart, with time data, and the two cannot be combined on one visual.
Pause and decide. 9. A column chart should show uncertainty around each bar. What do you add?
Error bars from the Analytics pane.
Pause and decide. 10. A data point jumped up. How do you ask Power BI why?
Right-click the point, Analyze, Explain the increase.
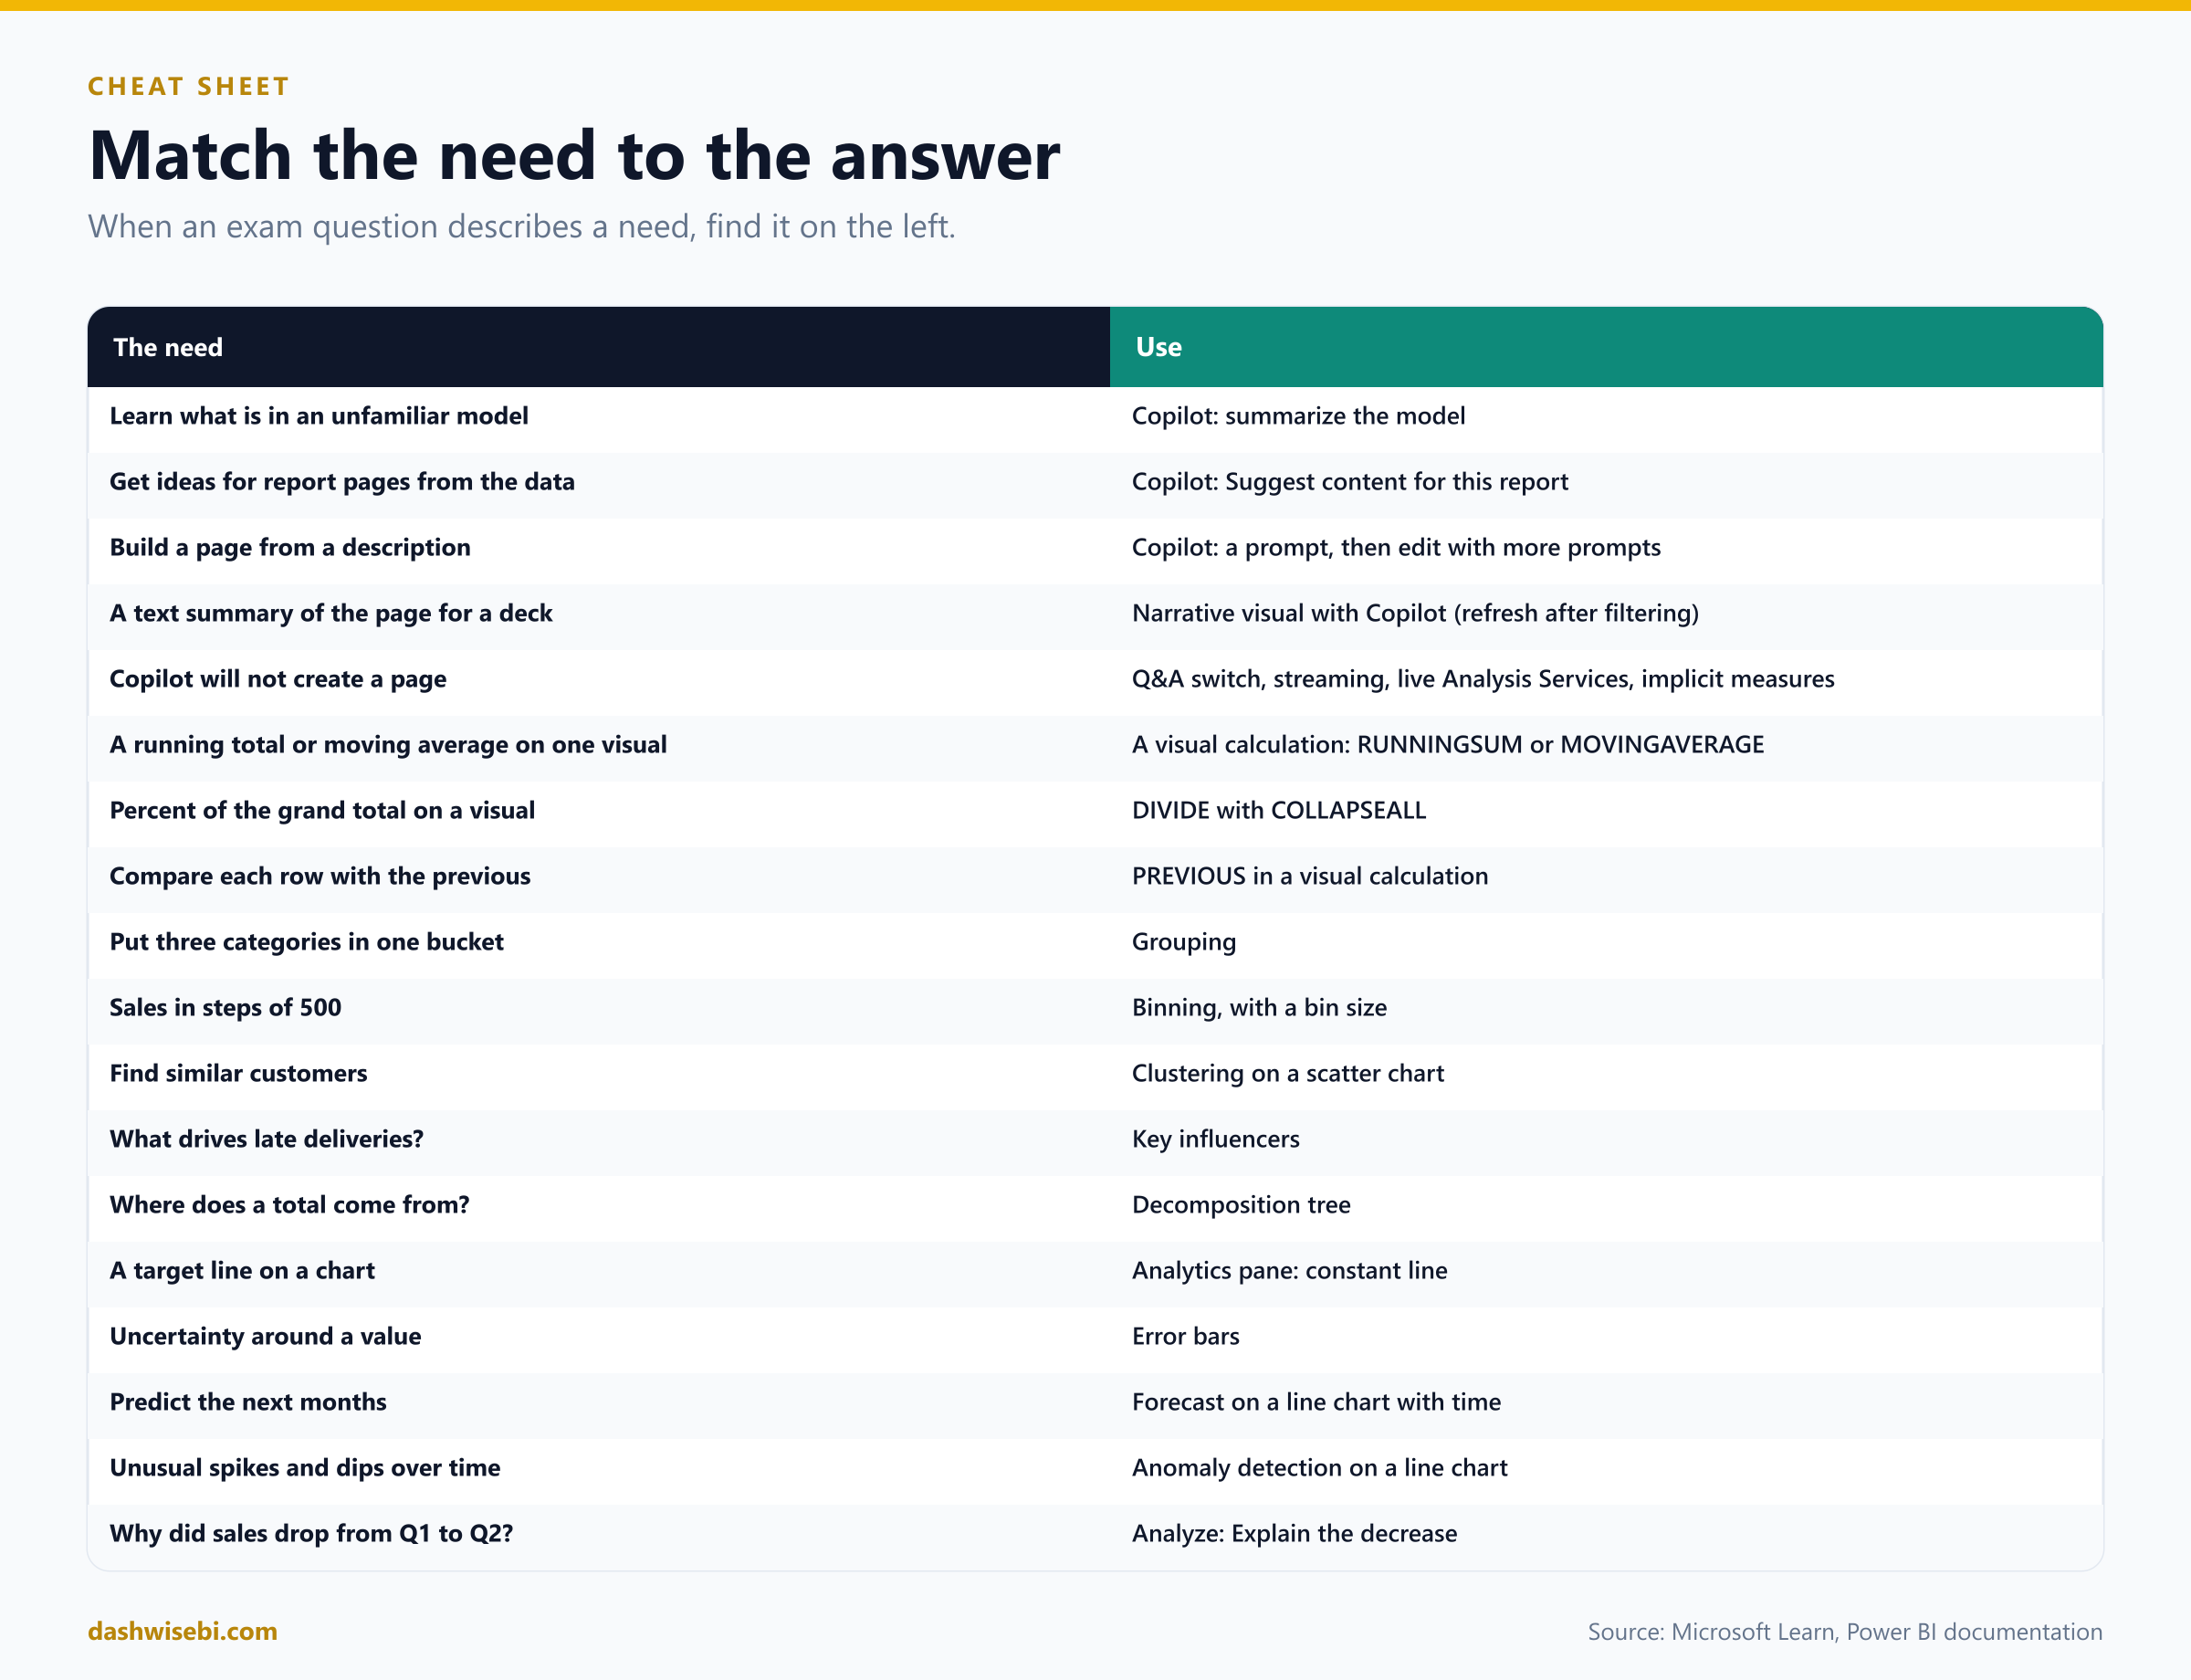
The cheat sheet
Myth or fact?
- “Copilot works in any workspace.” Myth. It needs paid capacity, a supported region and tenant settings.
- “Copilot can restyle my page.” Myth. It does not apply formatting or styling changes.
- “The narrative visual refreshes when I change a slicer.” Myth. Select refresh.
- “A visual calculation can be reused in other visuals.” Myth. It lives on one visual.
- “Visual calculations need CALCULATE and filter context.” Myth. They work on the visual's own aggregated rows.
- “You can bin a measure.” Myth. Numeric and date fields and calculated columns only.
- “Key influencers proves what causes an outcome.” Myth. It finds associations.
- “Forecast works on any chart.” Myth. Line charts only.
- “Anomaly detection and forecast can share a visual.” Myth. They cannot.
- “Analyze compares a point with the next one.” Myth. It compares with the previous one.
Where to go next
- Open an unfamiliar model and ask Copilot to summarize it. Then check three of its claims yourself.
- Build a matrix with a running sum, a percent of grand total and a moving average, then add a Year hierarchy and set the reset.
- Create a group, a bin set and a cluster on one customer table, and compare them.
- On a weekly line chart, add anomaly detection, change the sensitivity, then replace it with a forecast.
- Right-click a bar and use Analyze. Switch through all four views.
- Coming later: the rest of the Visualize and analyze skill area, including interactions, tooltips, bookmarks and navigation.
- Read the sources behind this post: PL-300 study guide, Copilot for Power BI reports overview, Create and edit reports with Copilot, Create a narrative visual with Copilot, Evaluate data with Copilot, Prepare your data for Copilot, Visual calculations overview, Use grouping and binning, Apply clustering techniques (training), Key influencers visual, Decomposition tree, Apply insights to explain fluctuations, Anomaly detection and The Analytics pane.
Keep reading
PL-300 Episode 4: Advanced DAX & Model Performance
PL-300 study guide as a story: time intelligence, semi-additive measures, calculation groups, Performance Analyzer, DAX query view and shrinking a model.
PL-300 Episode 3: Design the Data Model
PL-300 Episode 3: star, snowflake and galaxy schemas, properties, relationships, role-playing dimensions, date tables, calculated columns and tables, with M and DAX.