From Connection to Confidence: Getting, Connecting & Profiling Data in Power BI
A Power BI report is only as reliable as the data behind it.
We often spend significant time designing semantic models, writing DAX measures, optimizing performance, and creating interactive reports. But before any of that, two fundamental questions need answers:
Are we connecting to the right data, and can we trust its quality?
Imagine a sales dashboard that performs beautifully but produces inaccurate results. The cause may not be DAX or the data model. It could be a missed source refresh, an invalid data type, inconsistent region names, or unexpected values that were never identified during data preparation.
This is why data connectivity and profiling are foundational skills for every Power BI developer.
As part of Microsoft Data Days 2026, this first article explores the concepts covered in our PL-300 session, Get, Connect & Profile Data, aligned with the Microsoft Learn certification objectives.
1. Understanding the PL-300 Certification Scope
The Microsoft Power BI Data Analyst (PL-300) examination evaluates four primary skill areas:
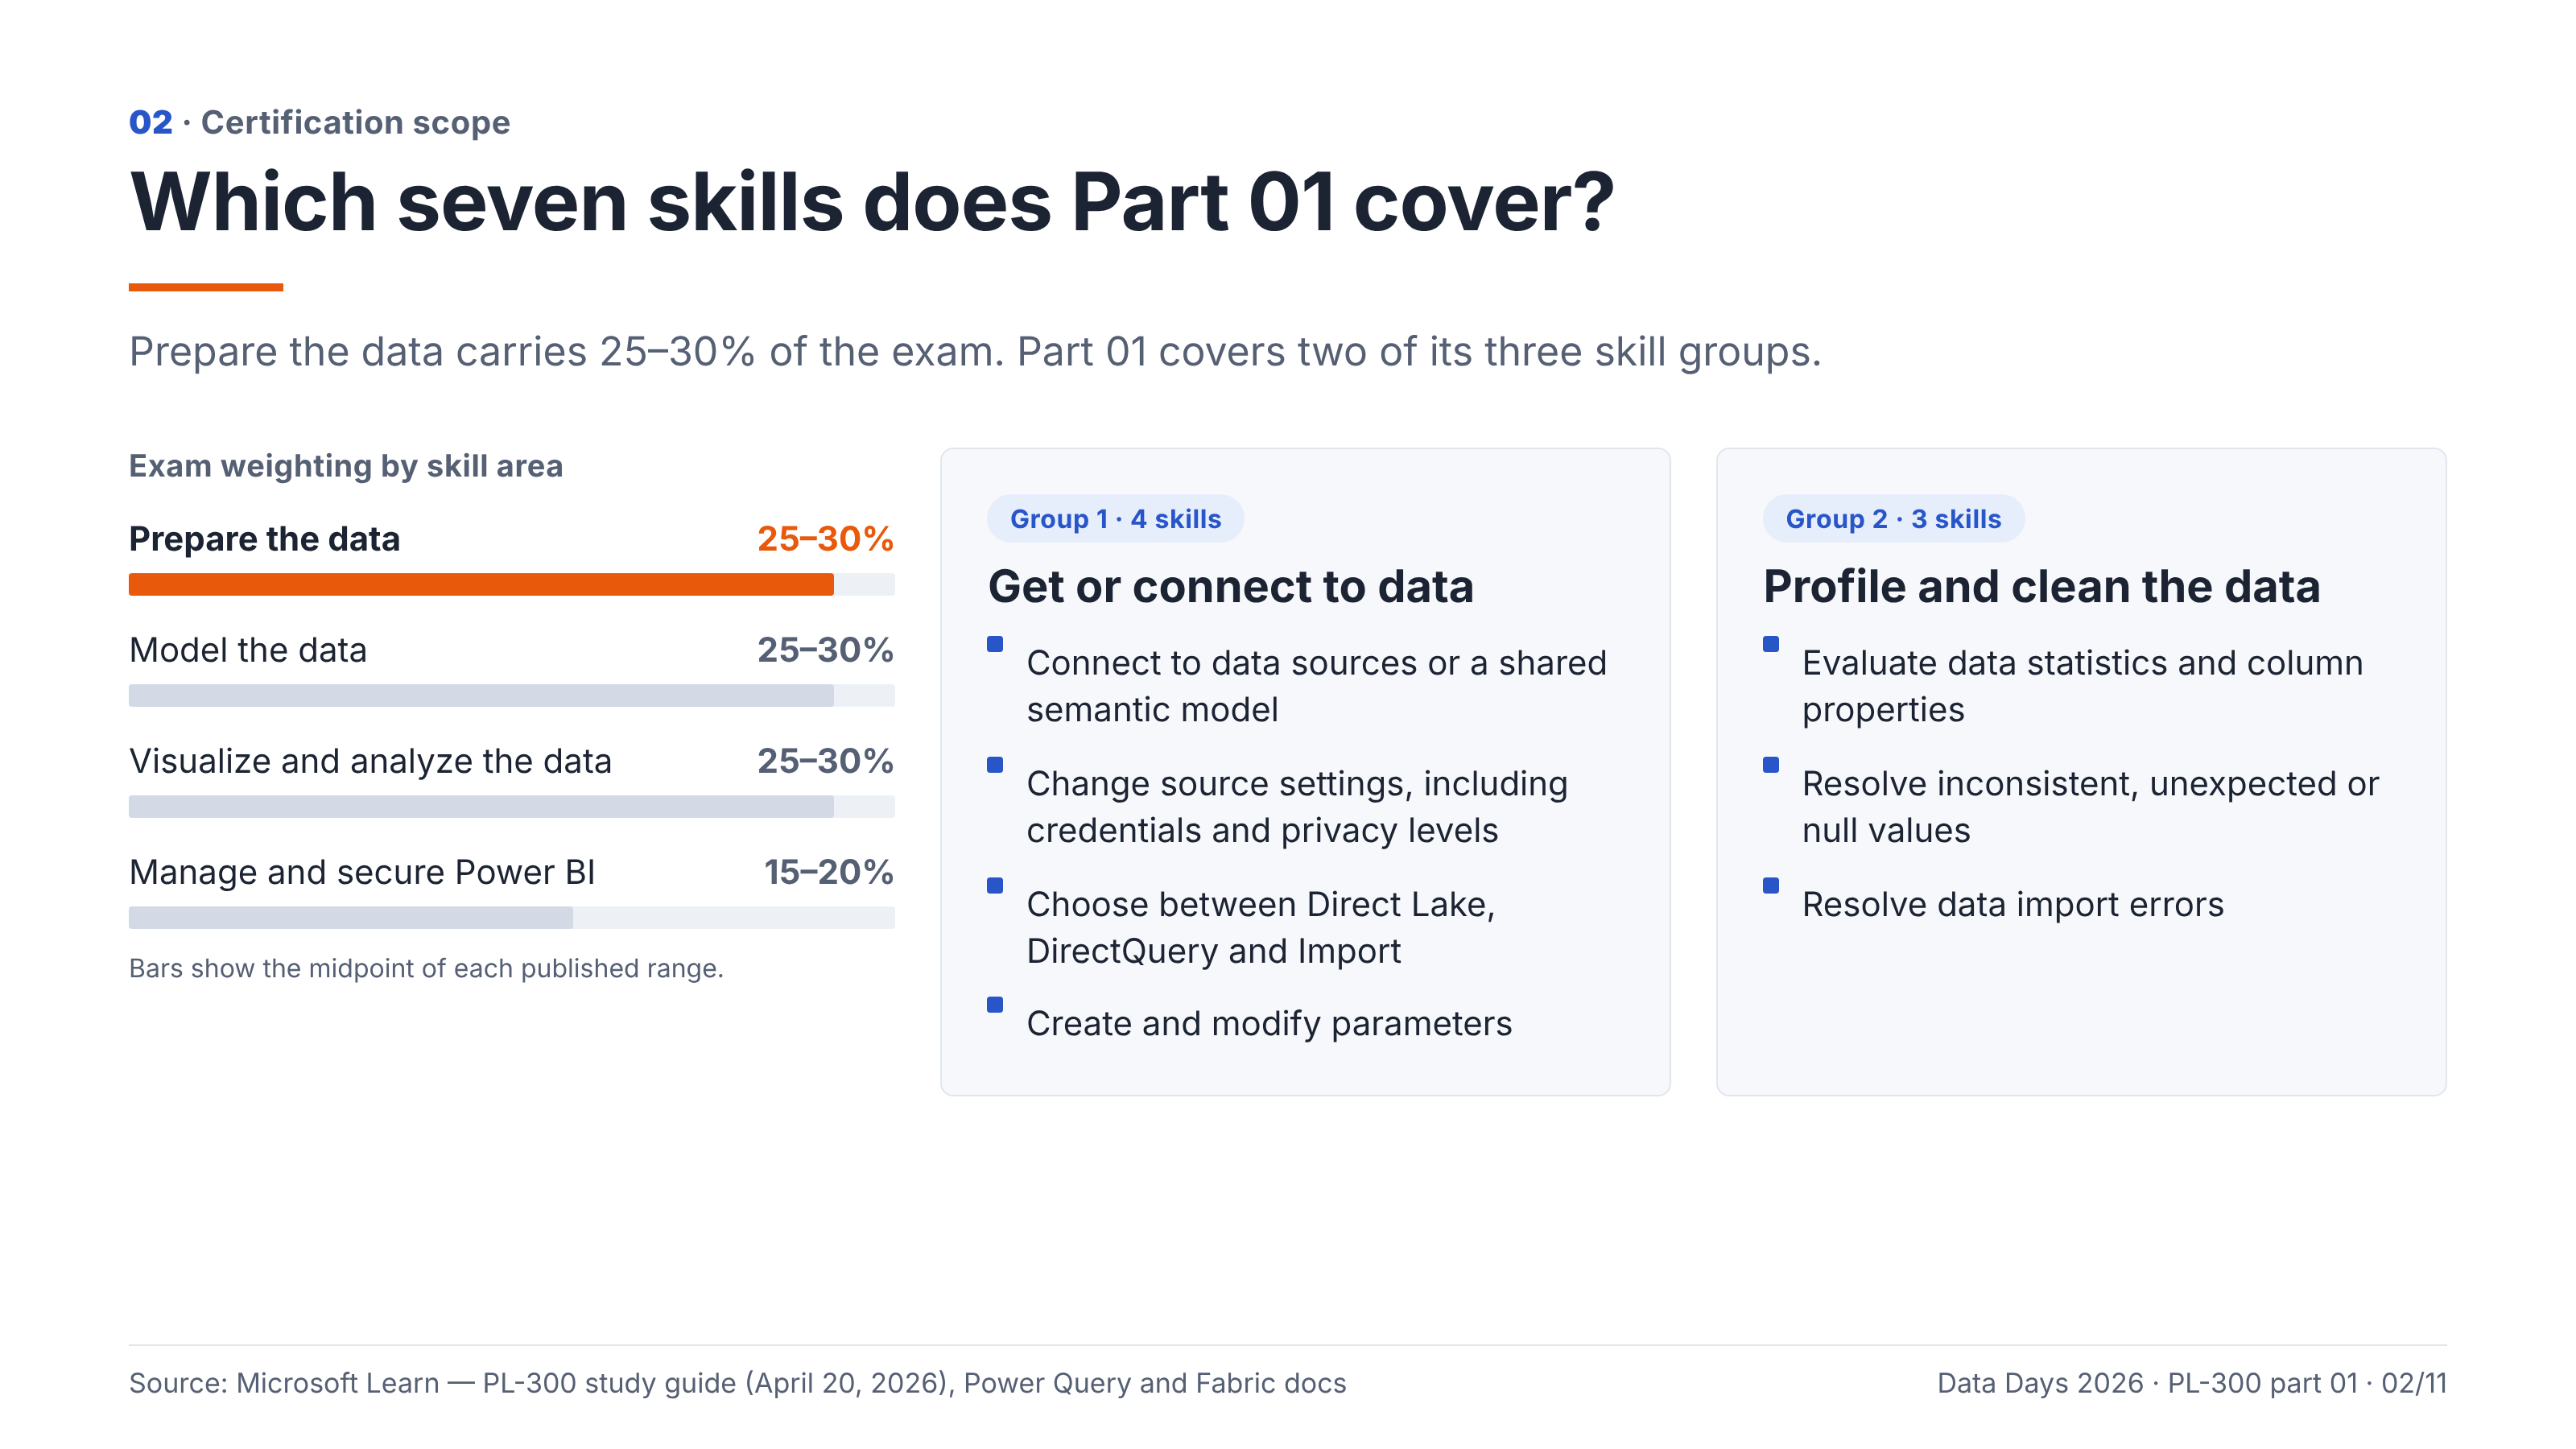
According to the Microsoft study guide applicable from April 20, 2026, the Prepare the data domain includes three skill groups.
Our first session focuses on Get or connect to data and Profile and clean the data.
These cover seven essential skills: connecting to appropriate sources, configuring connection settings, selecting storage modes, managing parameters, evaluating data statistics, resolving data quality issues, and troubleshooting import errors.
The key to passing scenario-based questions is not remembering where every button is located. It is recognizing the requirements and choosing the correct technical approach.
2. Connecting to Data: Choosing the Right Starting Point
Power BI supports a broad range of data sources, including Excel, CSV, SQL Server, Azure SQL Database, SharePoint, Dataverse, and Microsoft Fabric.
However, selecting a connector is more than simply choosing an available source.
Consider a company that already maintains a certified Sales semantic model with approved revenue calculations and row-level security.
A new reporting team needs to create additional sales reports.
Should they import the original SQL tables and rebuild the calculations?
Not necessarily.
Connecting to the existing shared semantic model is often the better architectural decision.
This allows report developers to reuse governed measures, relationships, and existing security configurations.
Users need appropriate permissions, including Build permission to author new reports from a shared semantic model.
The same principle applies to selecting connectors. If files are maintained in SharePoint Online, using the appropriate SharePoint connection is generally preferable to depending on a locally synchronized folder path for scheduled cloud refresh.
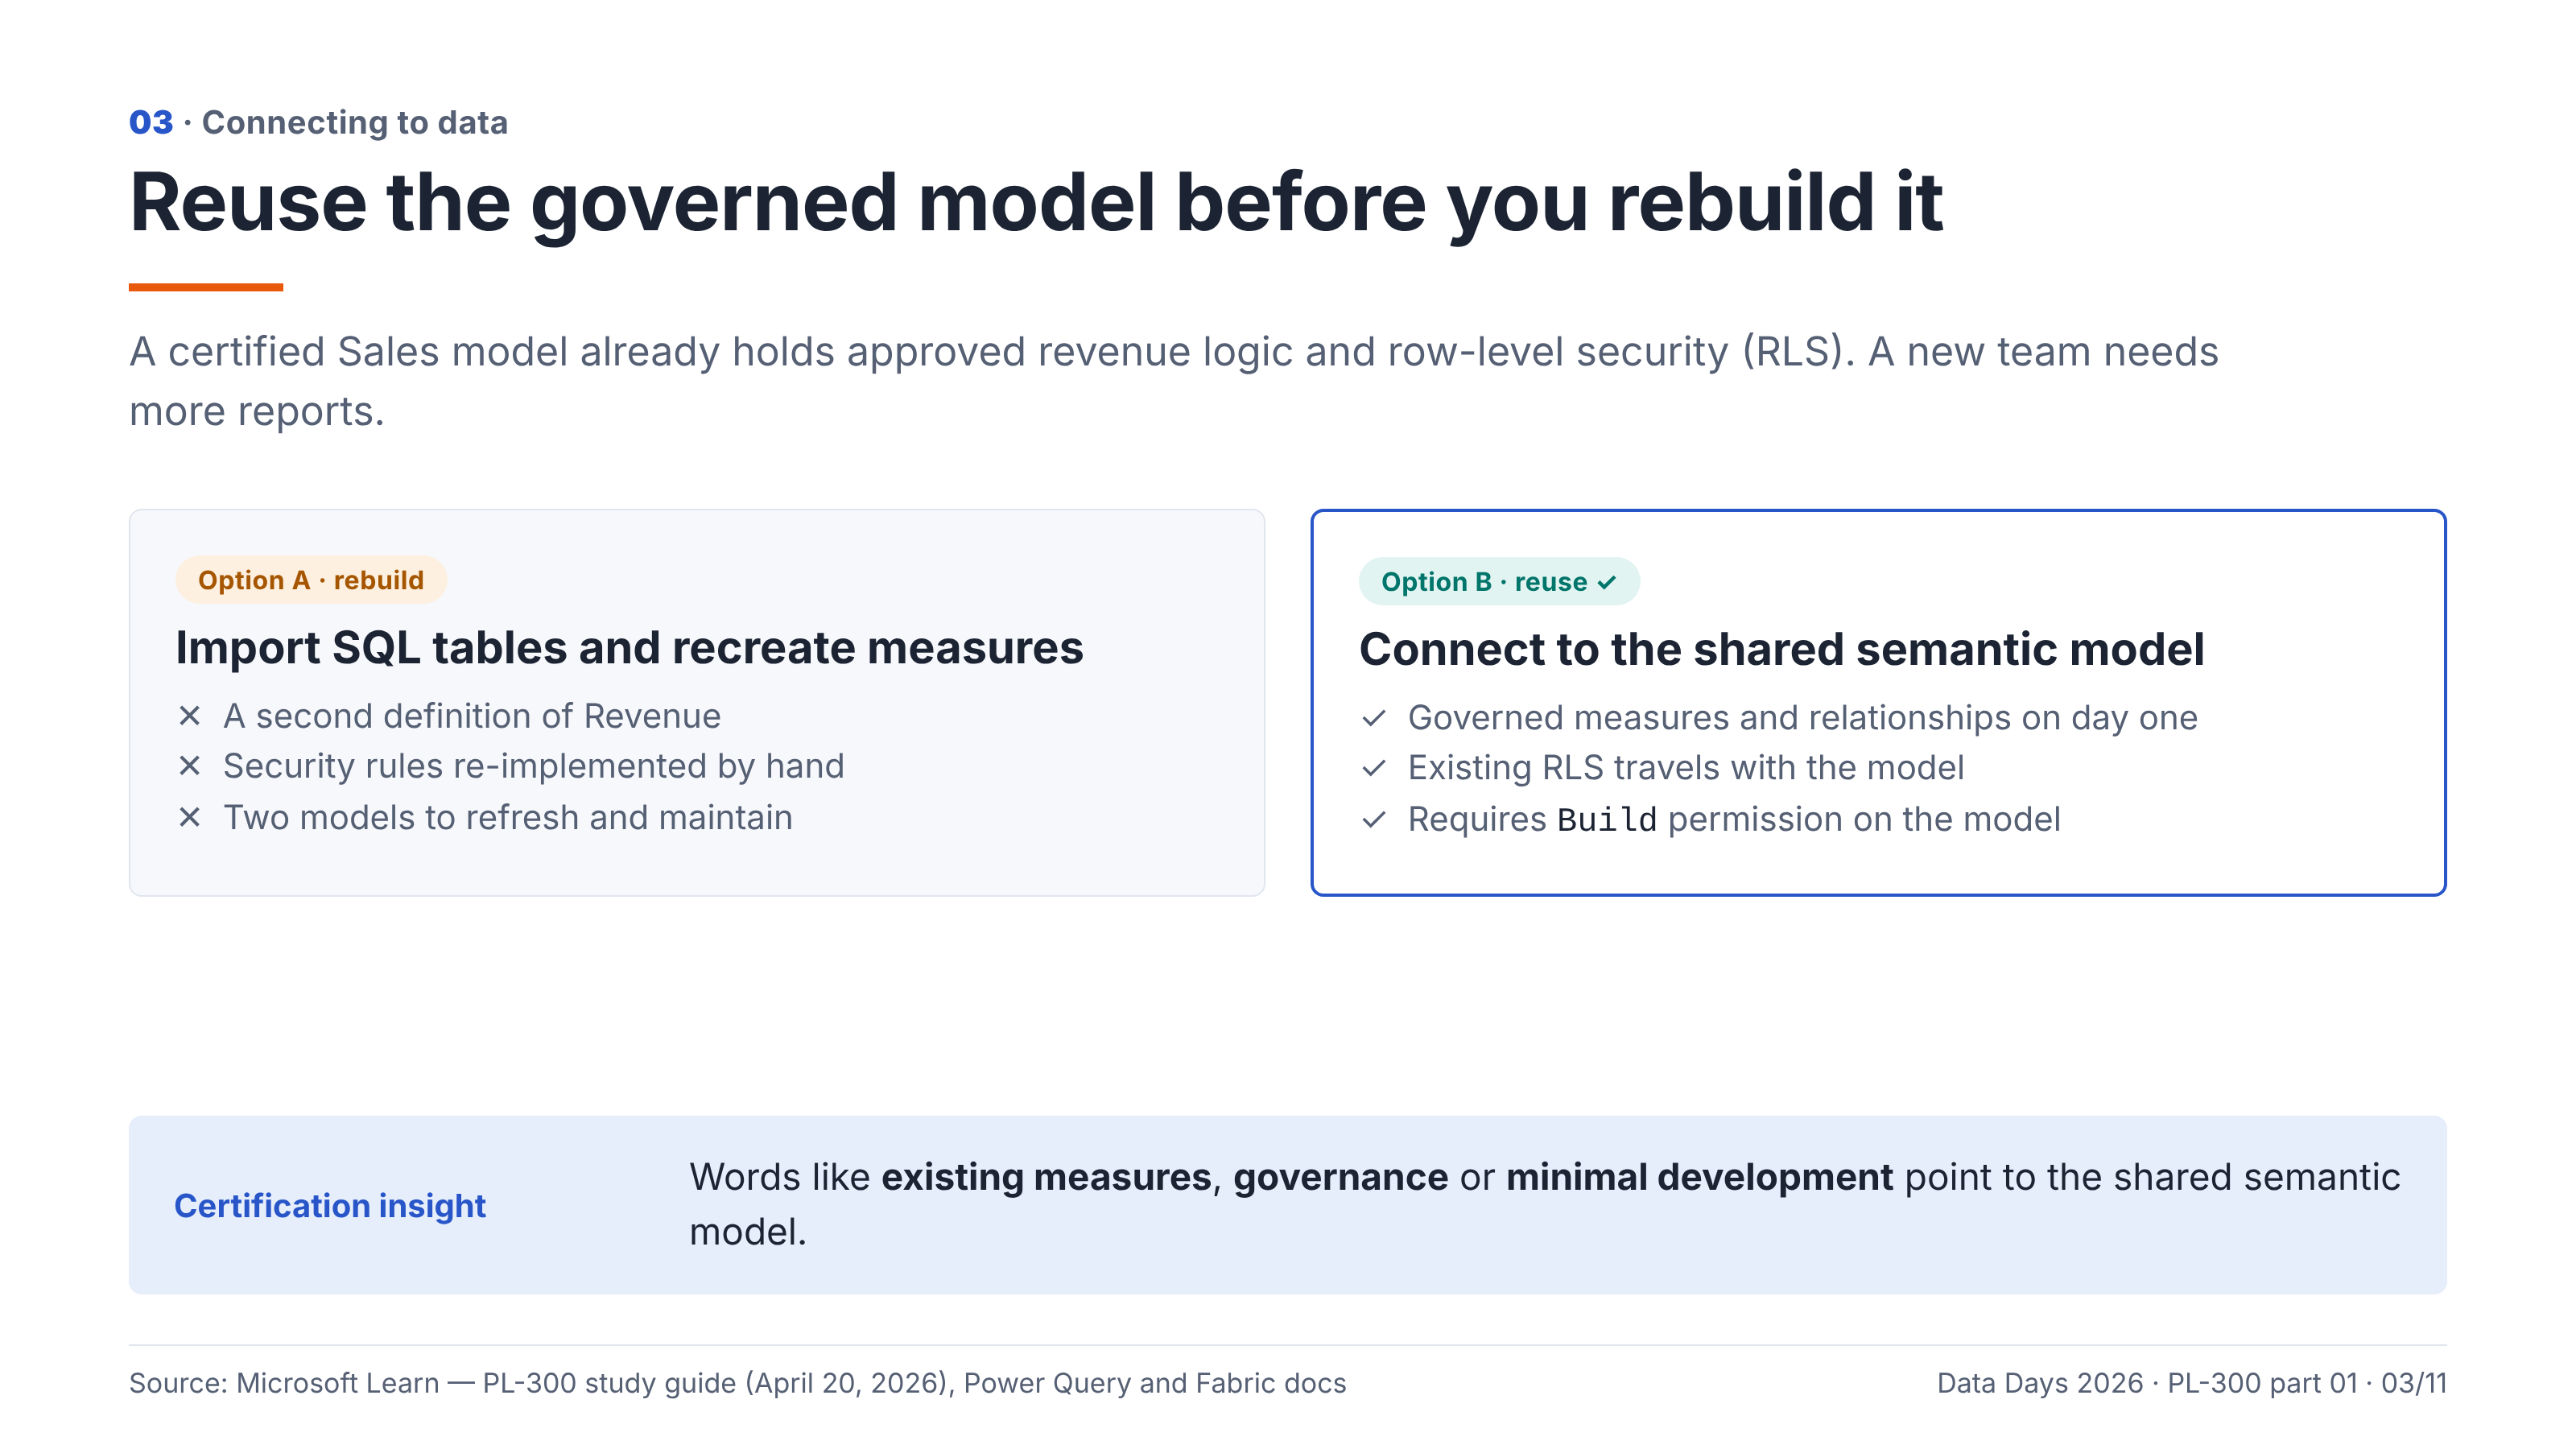
Certification insight: When a question emphasizes existing measures, governance, consistency, or minimal development effort, consider whether reusing a shared semantic model meets the requirements.
3. Credentials and Privacy Levels: Two Different Responsibilities
Power BI data connections introduce two related but distinct security concerns.
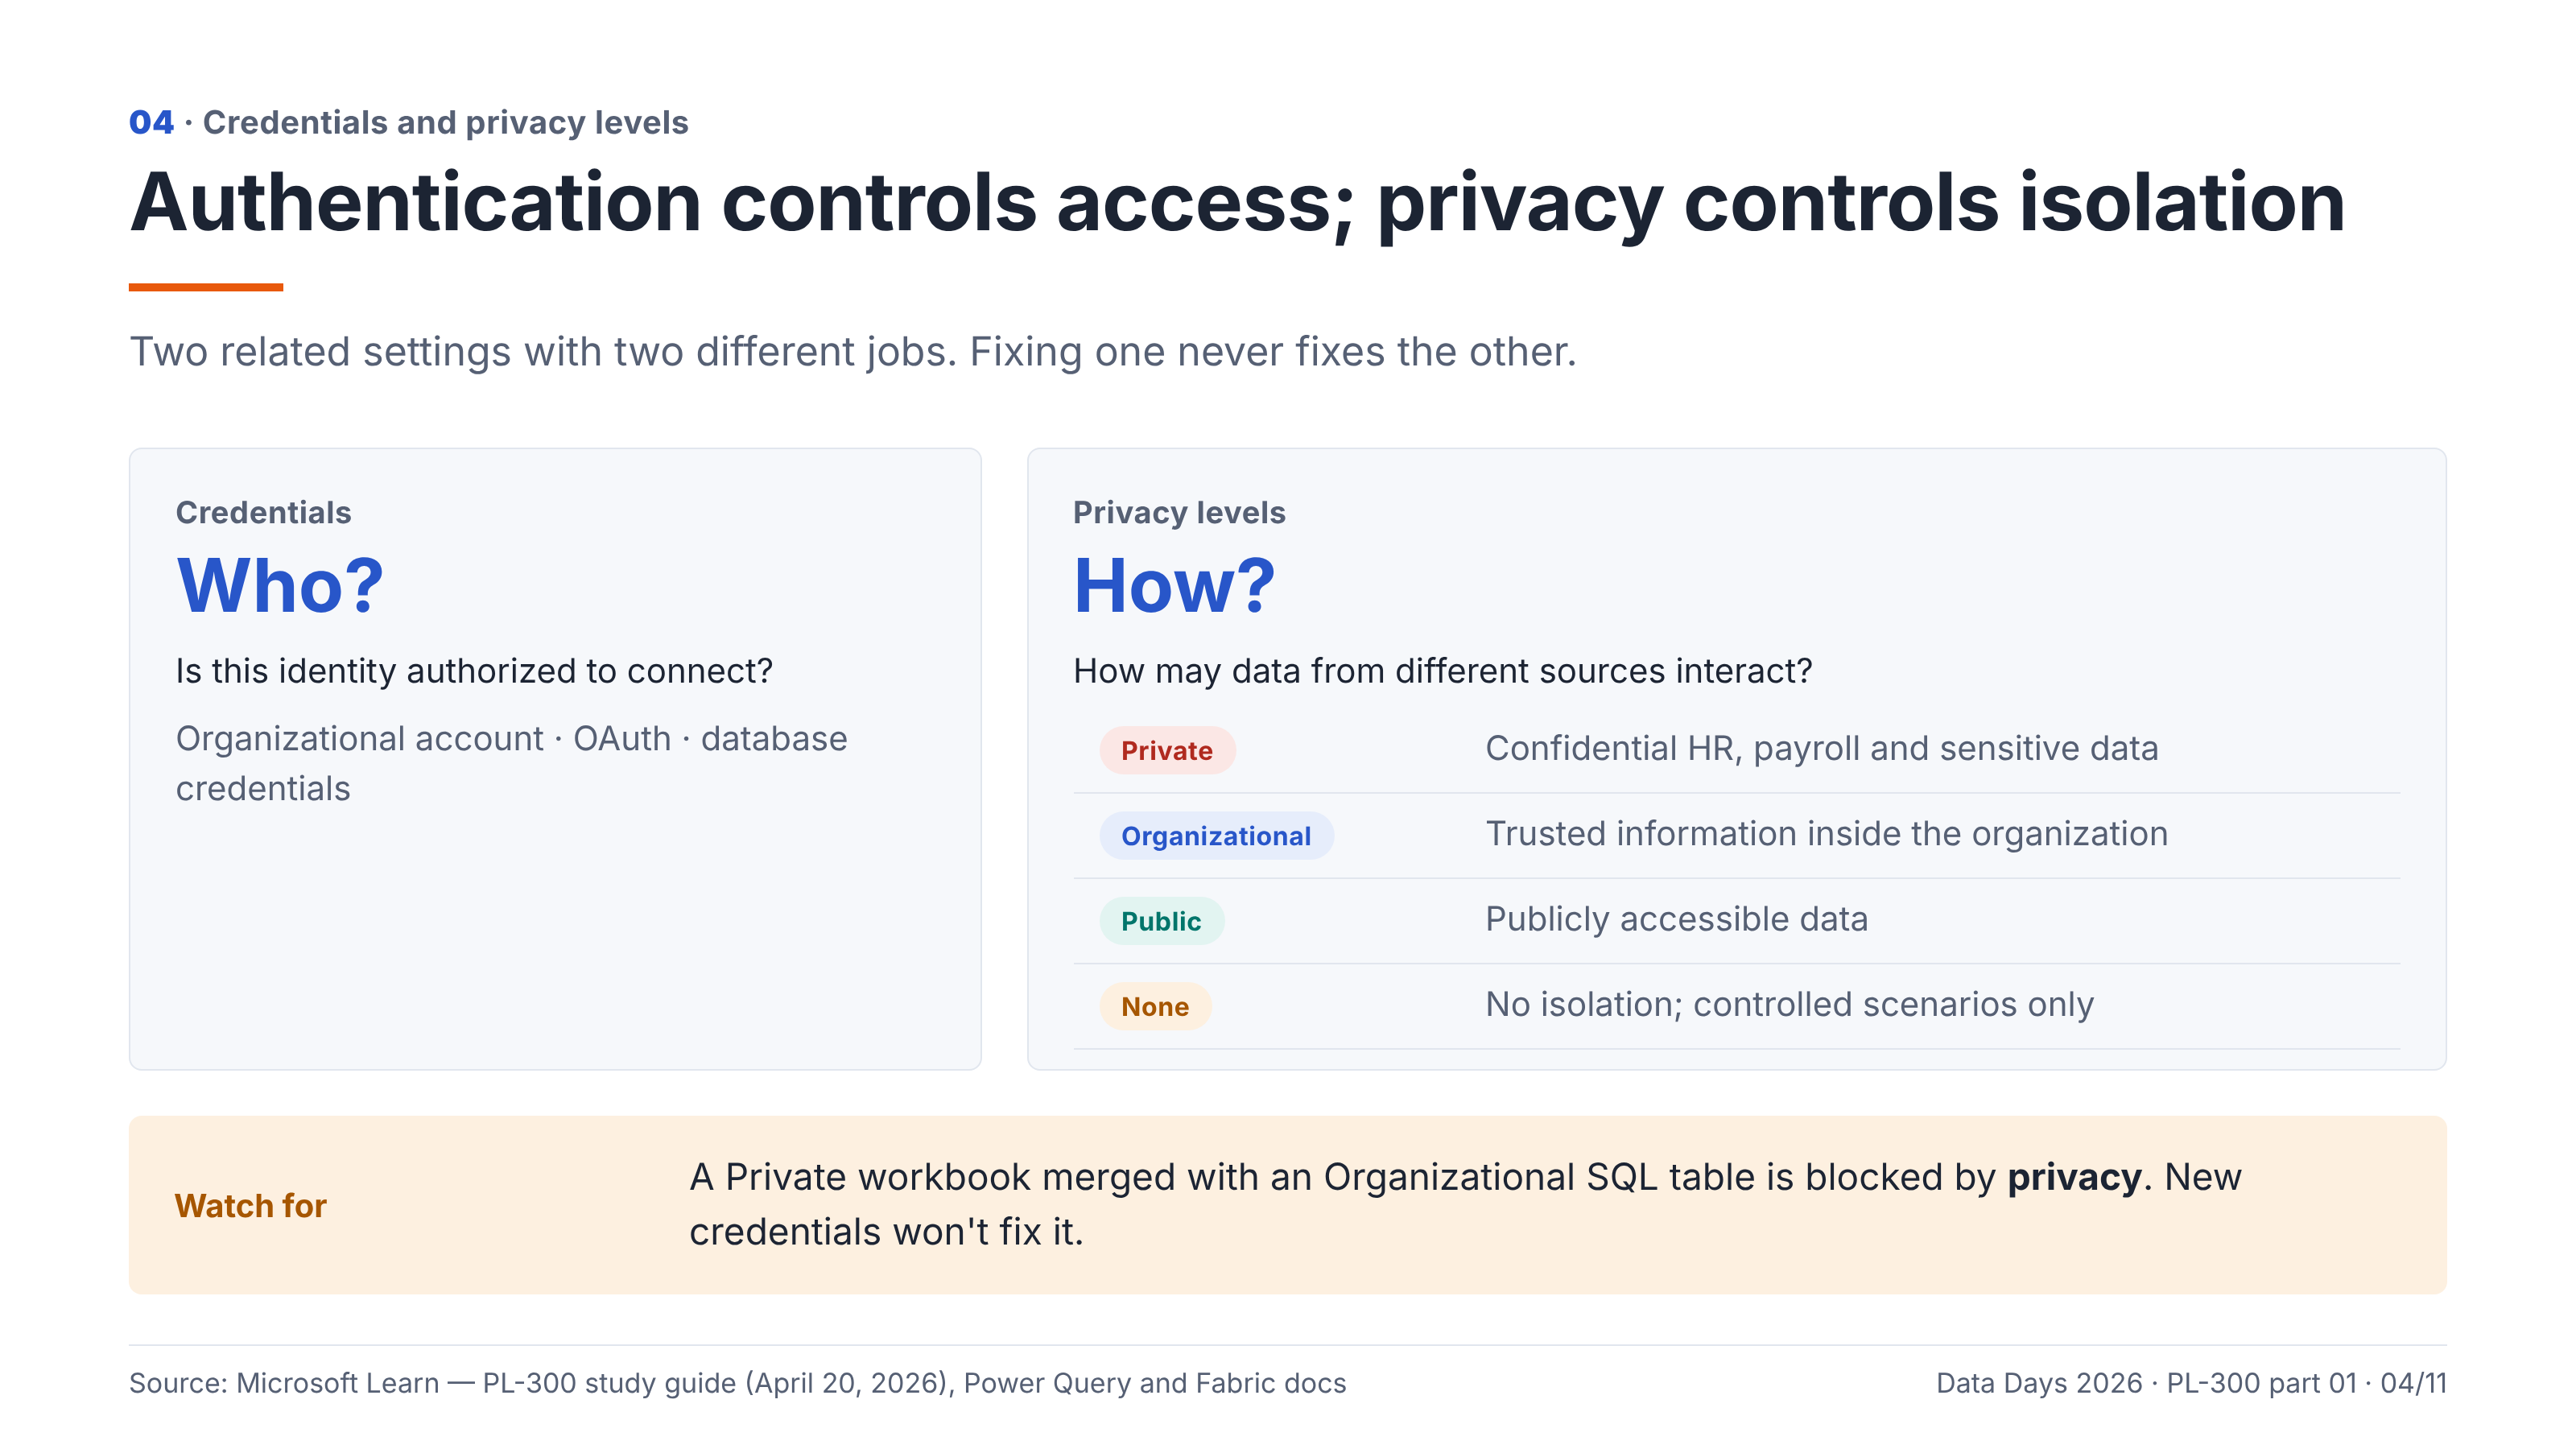
Credentials answer: Who is authorized to connect?
Credentials authenticate the identity accessing a source. Depending on the connector, authentication may use an organizational account, OAuth, database credentials, or another supported mechanism.
Privacy levels answer: How can data from different sources interact?
Power Query supports several privacy classifications.
Privacy levelTypical usePrivateConfidential HR, payroll, or other sensitive informationOrganizationalTrusted information within an organizationPublicPublicly accessible dataNoneNo privacy isolation; use cautiously in controlled scenarios
Suppose a Power Query transformation combines a confidential employee workbook with an organizational SQL database.
Privacy isolation may prevent information from being transferred between the sources during query evaluation or query folding.
Changing the login credentials will not resolve that privacy classification issue.
Similarly, disabling privacy protection purely to bypass an error can introduce data exposure risks.
The important distinction: Authentication controls access. Privacy settings control data isolation when sources are combined.
This is both a certification concept and a practical governance responsibility.
4. Import vs DirectQuery vs Direct Lake: Understanding the Decision
One of the most important PL-300 skills is selecting an appropriate data storage and connectivity mode.
The three approaches solve different business and architectural problems.
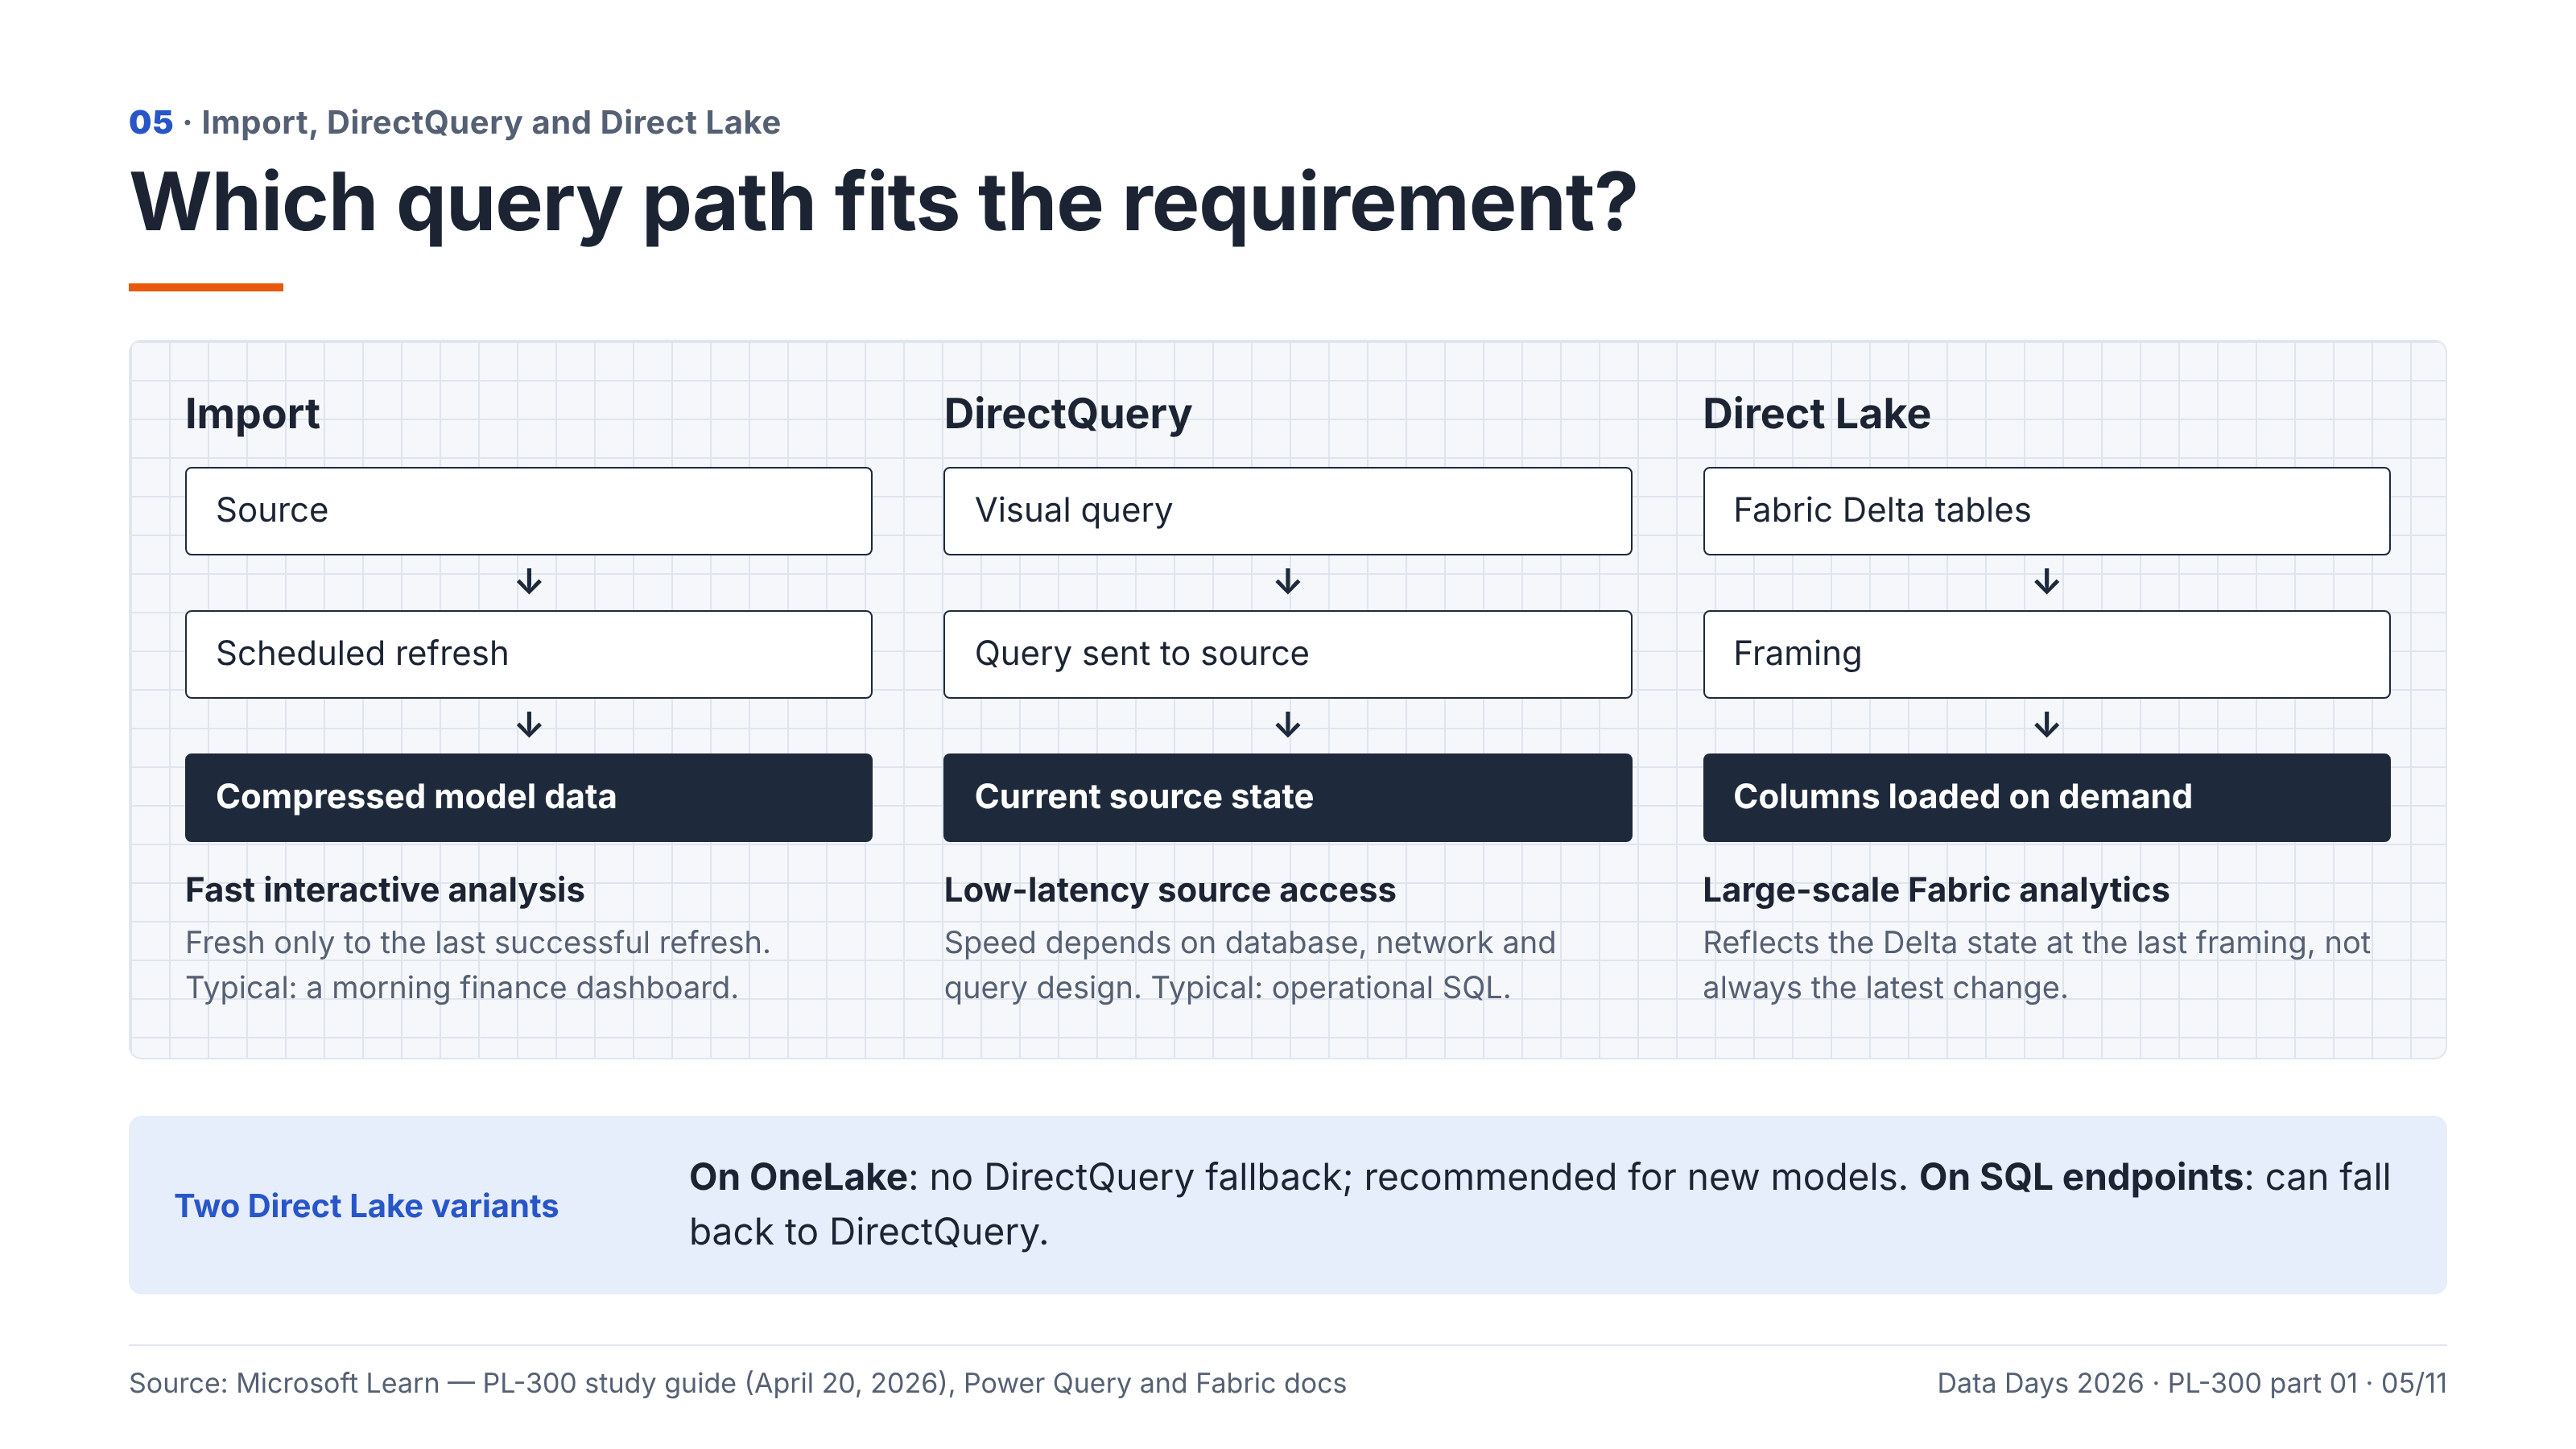
CapabilityImportDirectQueryDirect LakeQuery executionCached model dataQueries the underlying sourceReads supported Delta data through the semantic engineData freshnessBased on successful refreshQueries current source stateBased on Direct Lake framingMain advantageHigh-performance interactive analysisLow-latency source accessEfficient analytical access to Fabric Delta dataMain considerationRefresh and model sizeSource performance and limitationsFabric requirements and supported architectureTypical scenarioScheduled executive reportingFrequently changing operational dataLarge-scale Fabric analytics
When should we choose Import?
Import is often a strong starting choice when fast report interactions matter and periodic refreshes meet business requirements.
For example, a financial dashboard updated each morning may not require source queries for every visual interaction.
Imported data is compressed and served by the Power BI semantic model engine.
When should we choose DirectQuery?
DirectQuery becomes relevant when queries need to reflect changes in the underlying source without waiting for an Import refresh.
Consider an operational dashboard tracking transactions in an Azure SQL database.
If the business requires low-latency visibility into new transactions, DirectQuery may be suitable.
However, DirectQuery does not automatically guarantee real-time performance. The database, network, query design, and available capacity still influence response times.
When should we choose Direct Lake?
Direct Lake is designed for analytical workloads over supported Delta tables in Microsoft Fabric.
It allows semantic models to access columnar data without performing a traditional full Import refresh.
A critical detail is framing.
Direct Lake queries reflect the Delta table state associated with the model's most recent successful framing operation. Therefore, Direct Lake should not simply be described as always showing the latest source changes.
There are also two important architectural variants:
Direct Lake on OneLake: Does not support DirectQuery fallback and is Microsoft's recommended option for new Direct Lake semantic models.
Direct Lake on SQL analytics endpoints: Can fall back to DirectQuery when certain conditions prevent Direct Lake execution. This can affect query performance.
These details are especially important when evaluating Direct Lake solutions in production.
Certification insight: Begin with the requirement—freshness, performance, data source, capacity, or compatibility—before selecting the mode.
5. Power Query Parameters: Designing for Flexibility
Hard-coded values can make Power BI solutions difficult to maintain.
Consider a report that connects to different SQL environments during development, testing, and production.
Without parameters, changing environments may require manually editing the source connection.
Power Query parameters provide a reusable way to manage these values.
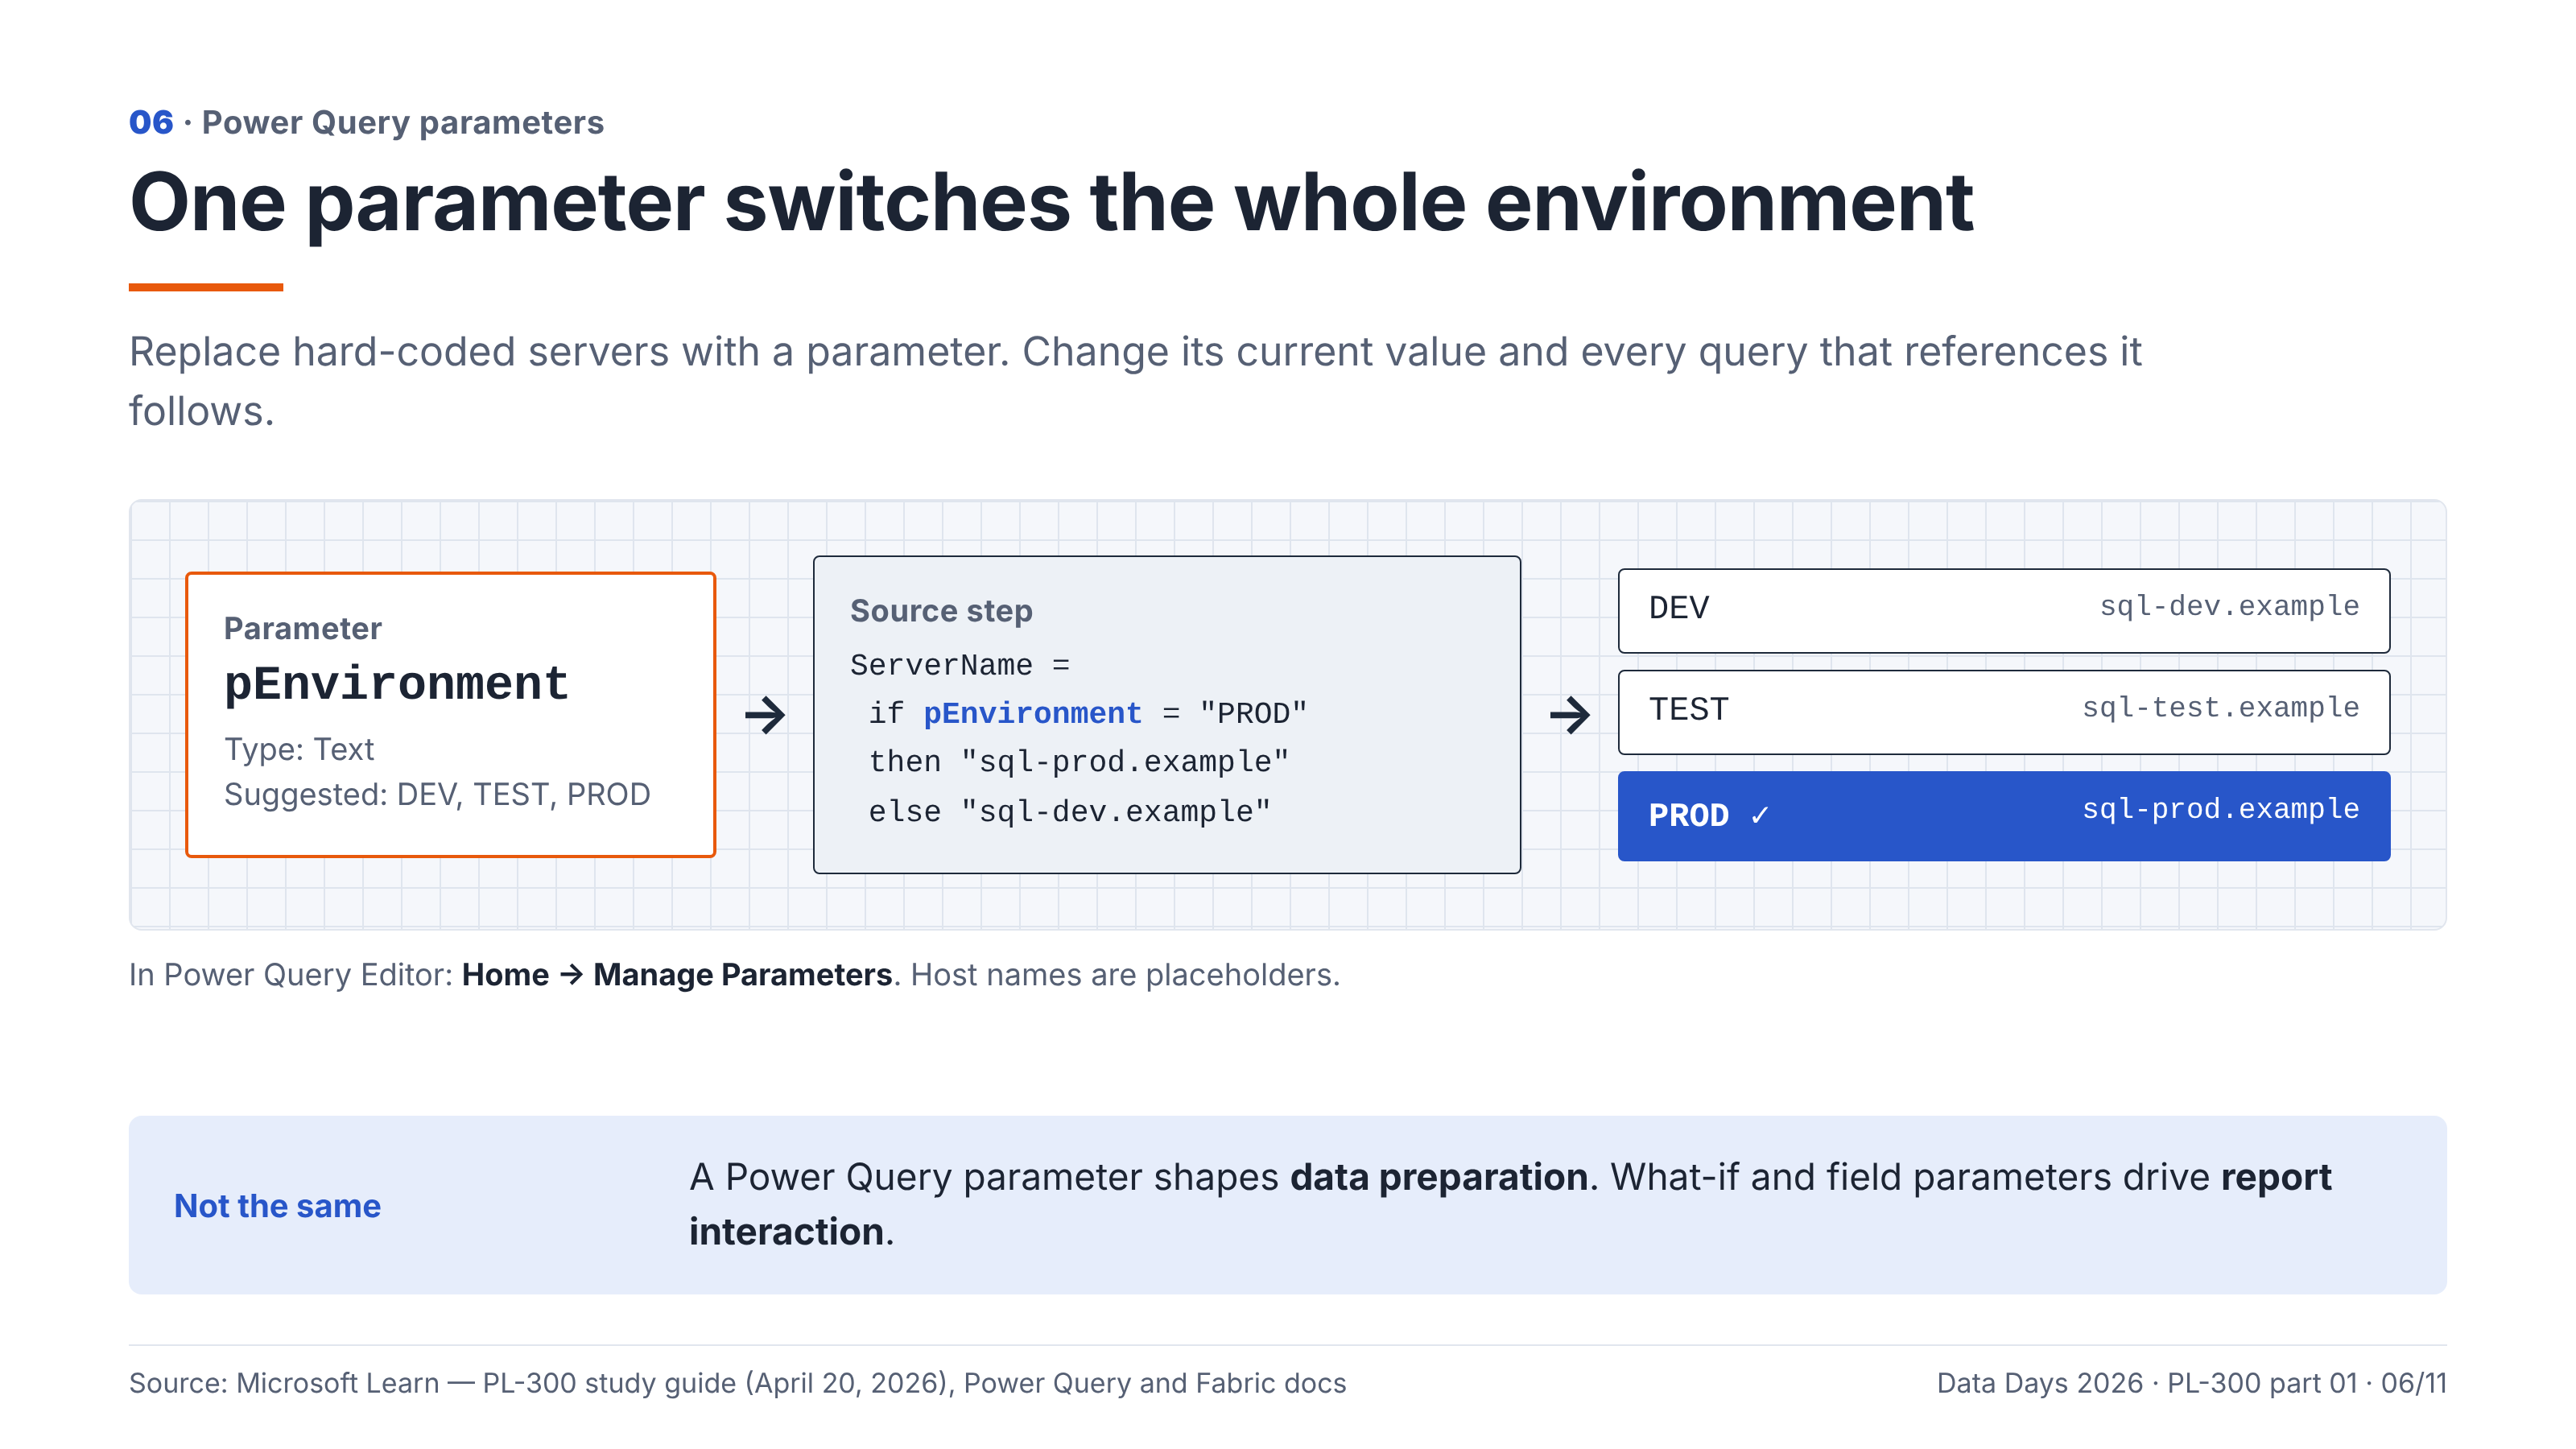
For example, we can create a parameter called pEnvironment with the text values DEV, TEST, and PROD.
The Power Query source step can then reference this parameter to determine the required server or database.
In Power Query Editor, parameters can be managed through Home → Manage Parameters.
A parameter can define its name, data type, suggested values, and current value.
Remember that a Power Query parameter is not the same as a report What-if parameter or field parameter.
Power Query parameters influence query evaluation and data preparation, while report parameters support different interactive analytical experiences.
Certification insight: When a question asks for configurable sources, reusable query values, or reduced maintenance effort, Power Query parameters are often worth considering.
6. Data Profiling: Understanding What Is Actually in the Data
Loading data successfully does not mean the data is valid.
Power Query provides three essential profiling capabilities.
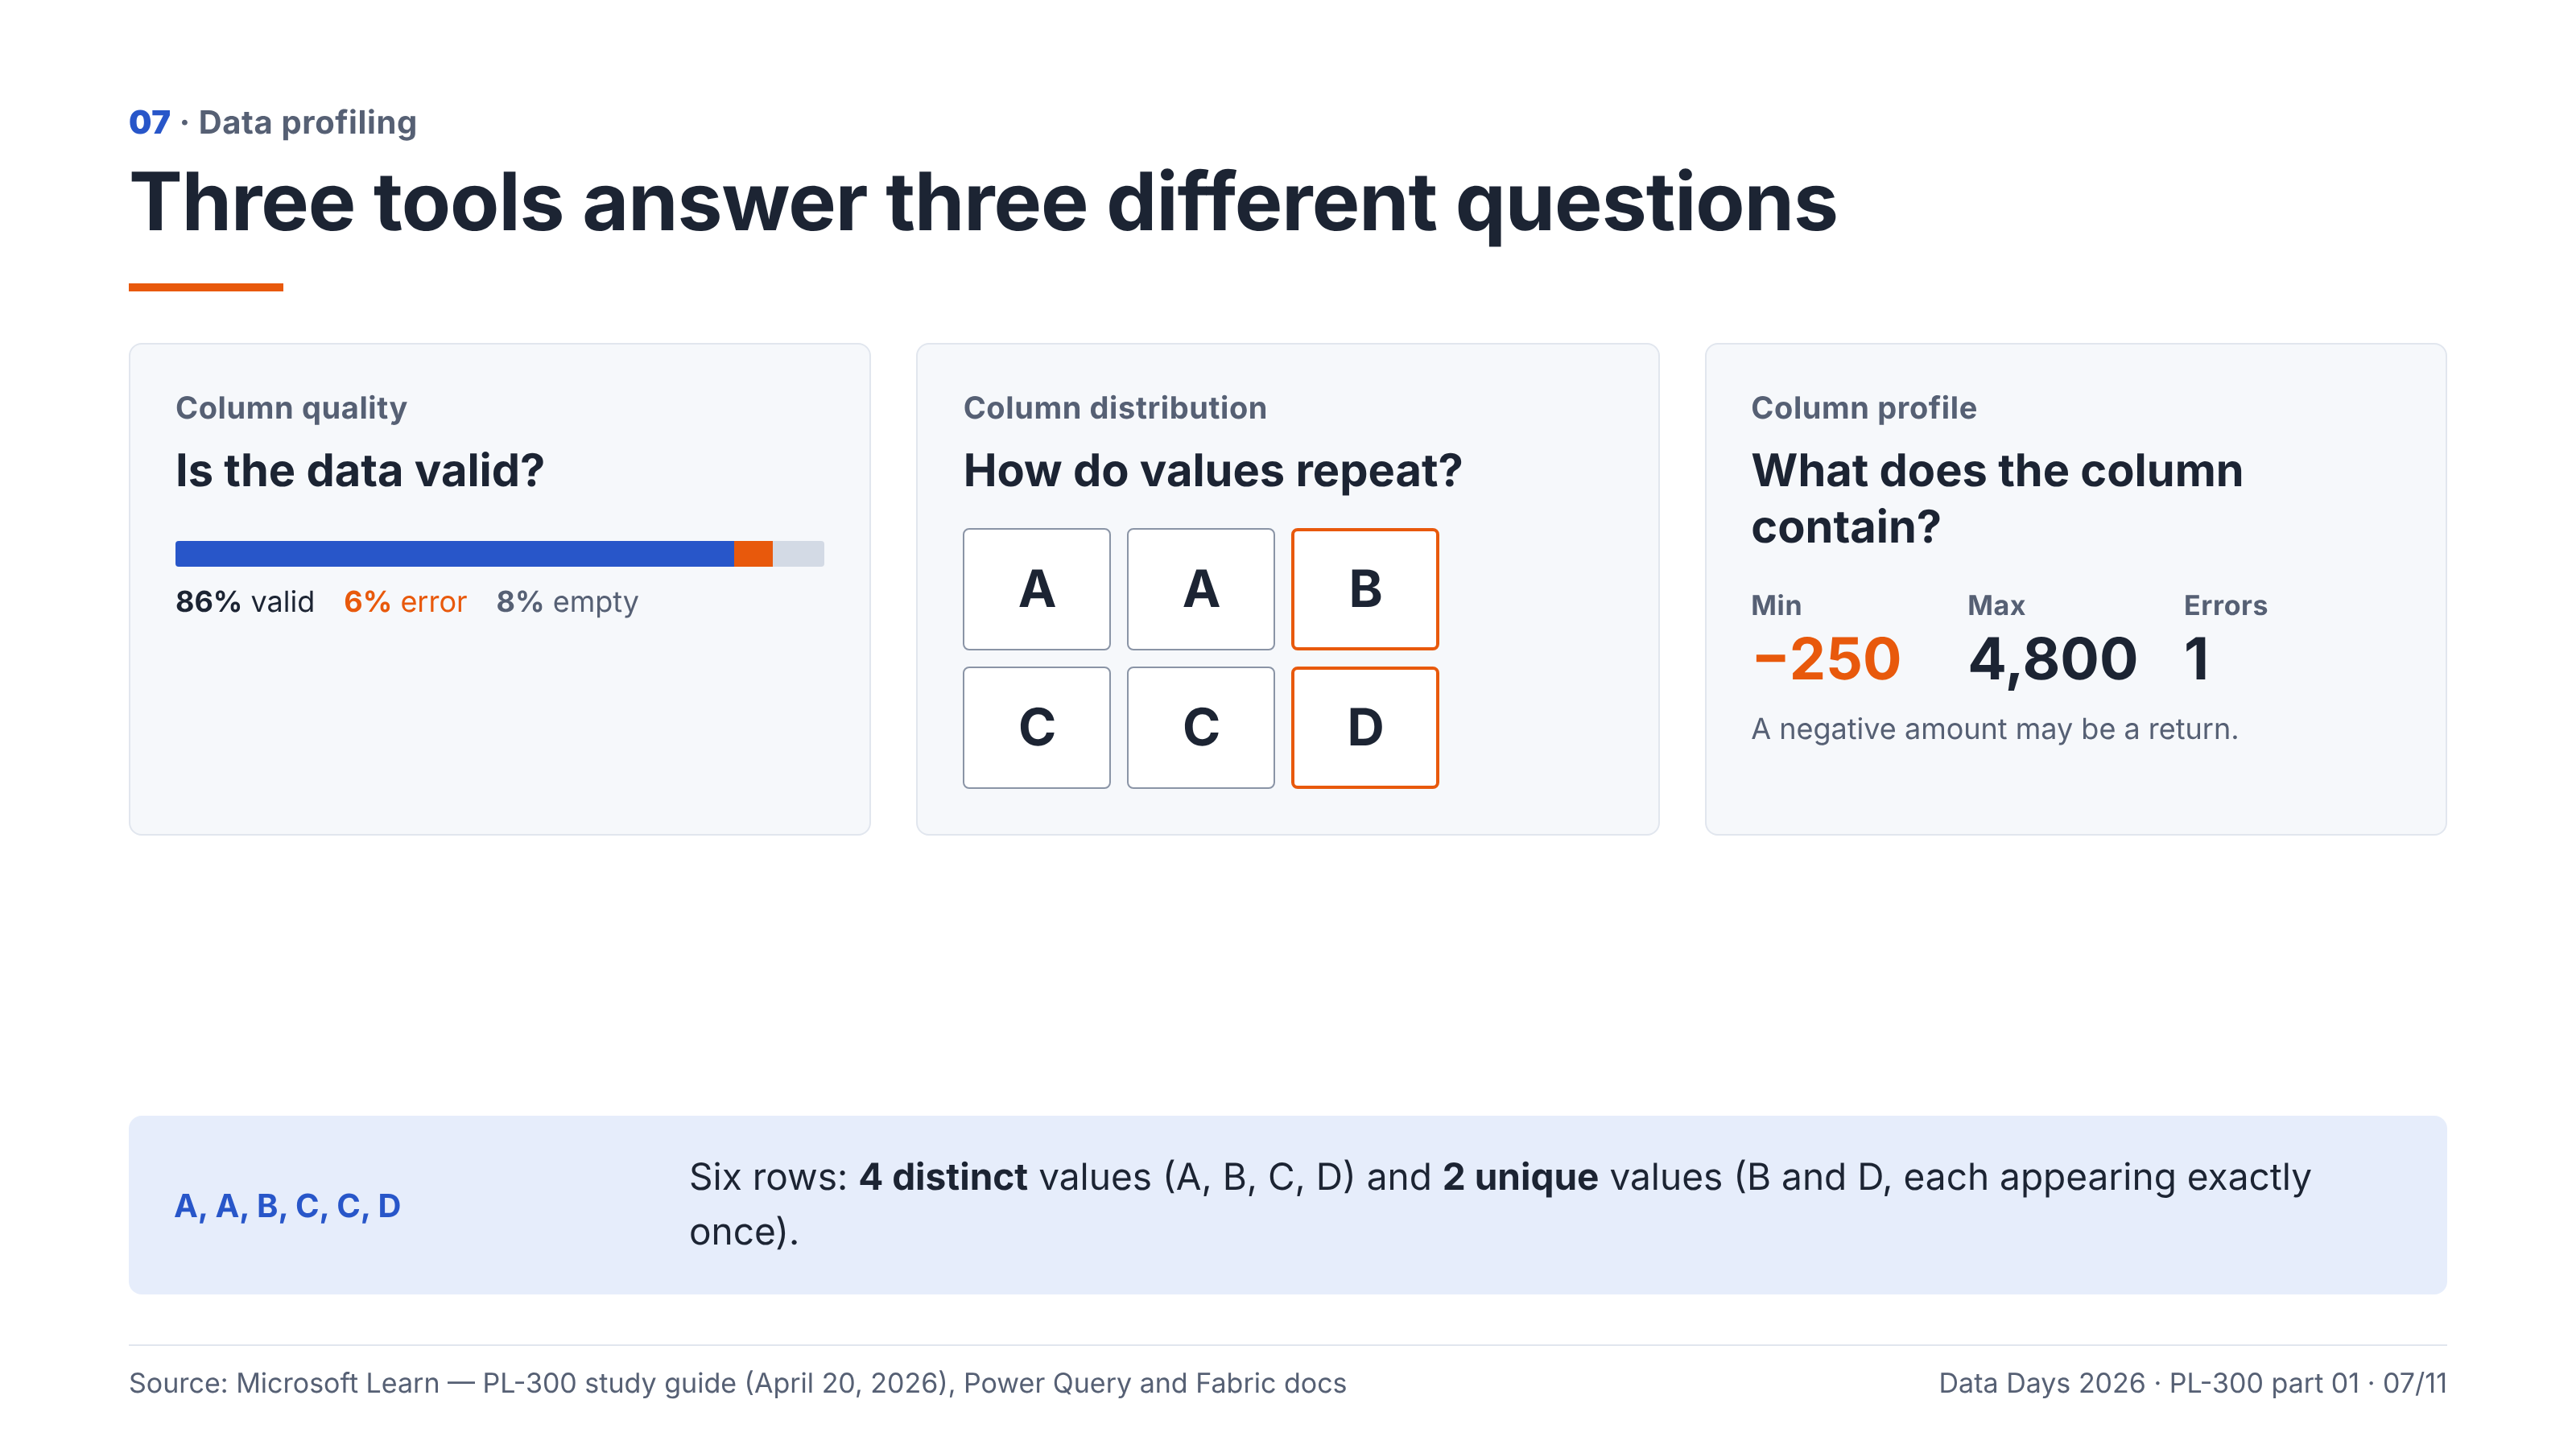
Column Quality — Is the data valid?
Column Quality helps identify valid values, errors, and empty values.
For example, a Sales Amount column may contain mostly valid numbers but also have nulls and conversion errors.
Identifying those issues before loading the semantic model prevents unexpected failures and misleading calculations.
Column Distribution — How do values repeat?
Column Distribution provides insight into the frequency of values, including distinct and unique counts.
These concepts are often confused.
Consider the values:
A, A, B, C, C, D
There are six total rows, but only four distinct values: A, B, C, and D.
There are only two unique values: B and D, because they each appear exactly once.
Therefore:
Distinct count = 4
Unique count = 2
Understanding this difference is useful when checking dimension keys, identifying duplicates, and evaluating source data.
Column Profile — What does the column contain?
Column Profile provides more detailed statistics, such as minimum, maximum, count, empty values, errors, and value distributions, depending on the column's data type.
For example, if a Sales Amount column contains an unexpected negative value, profiling may reveal it.
But the correct action is not necessarily to delete the row.
That amount could represent a return, adjustment, or credit transaction.
Technical anomalies must be evaluated against business rules.
The 1,000-row profiling trap
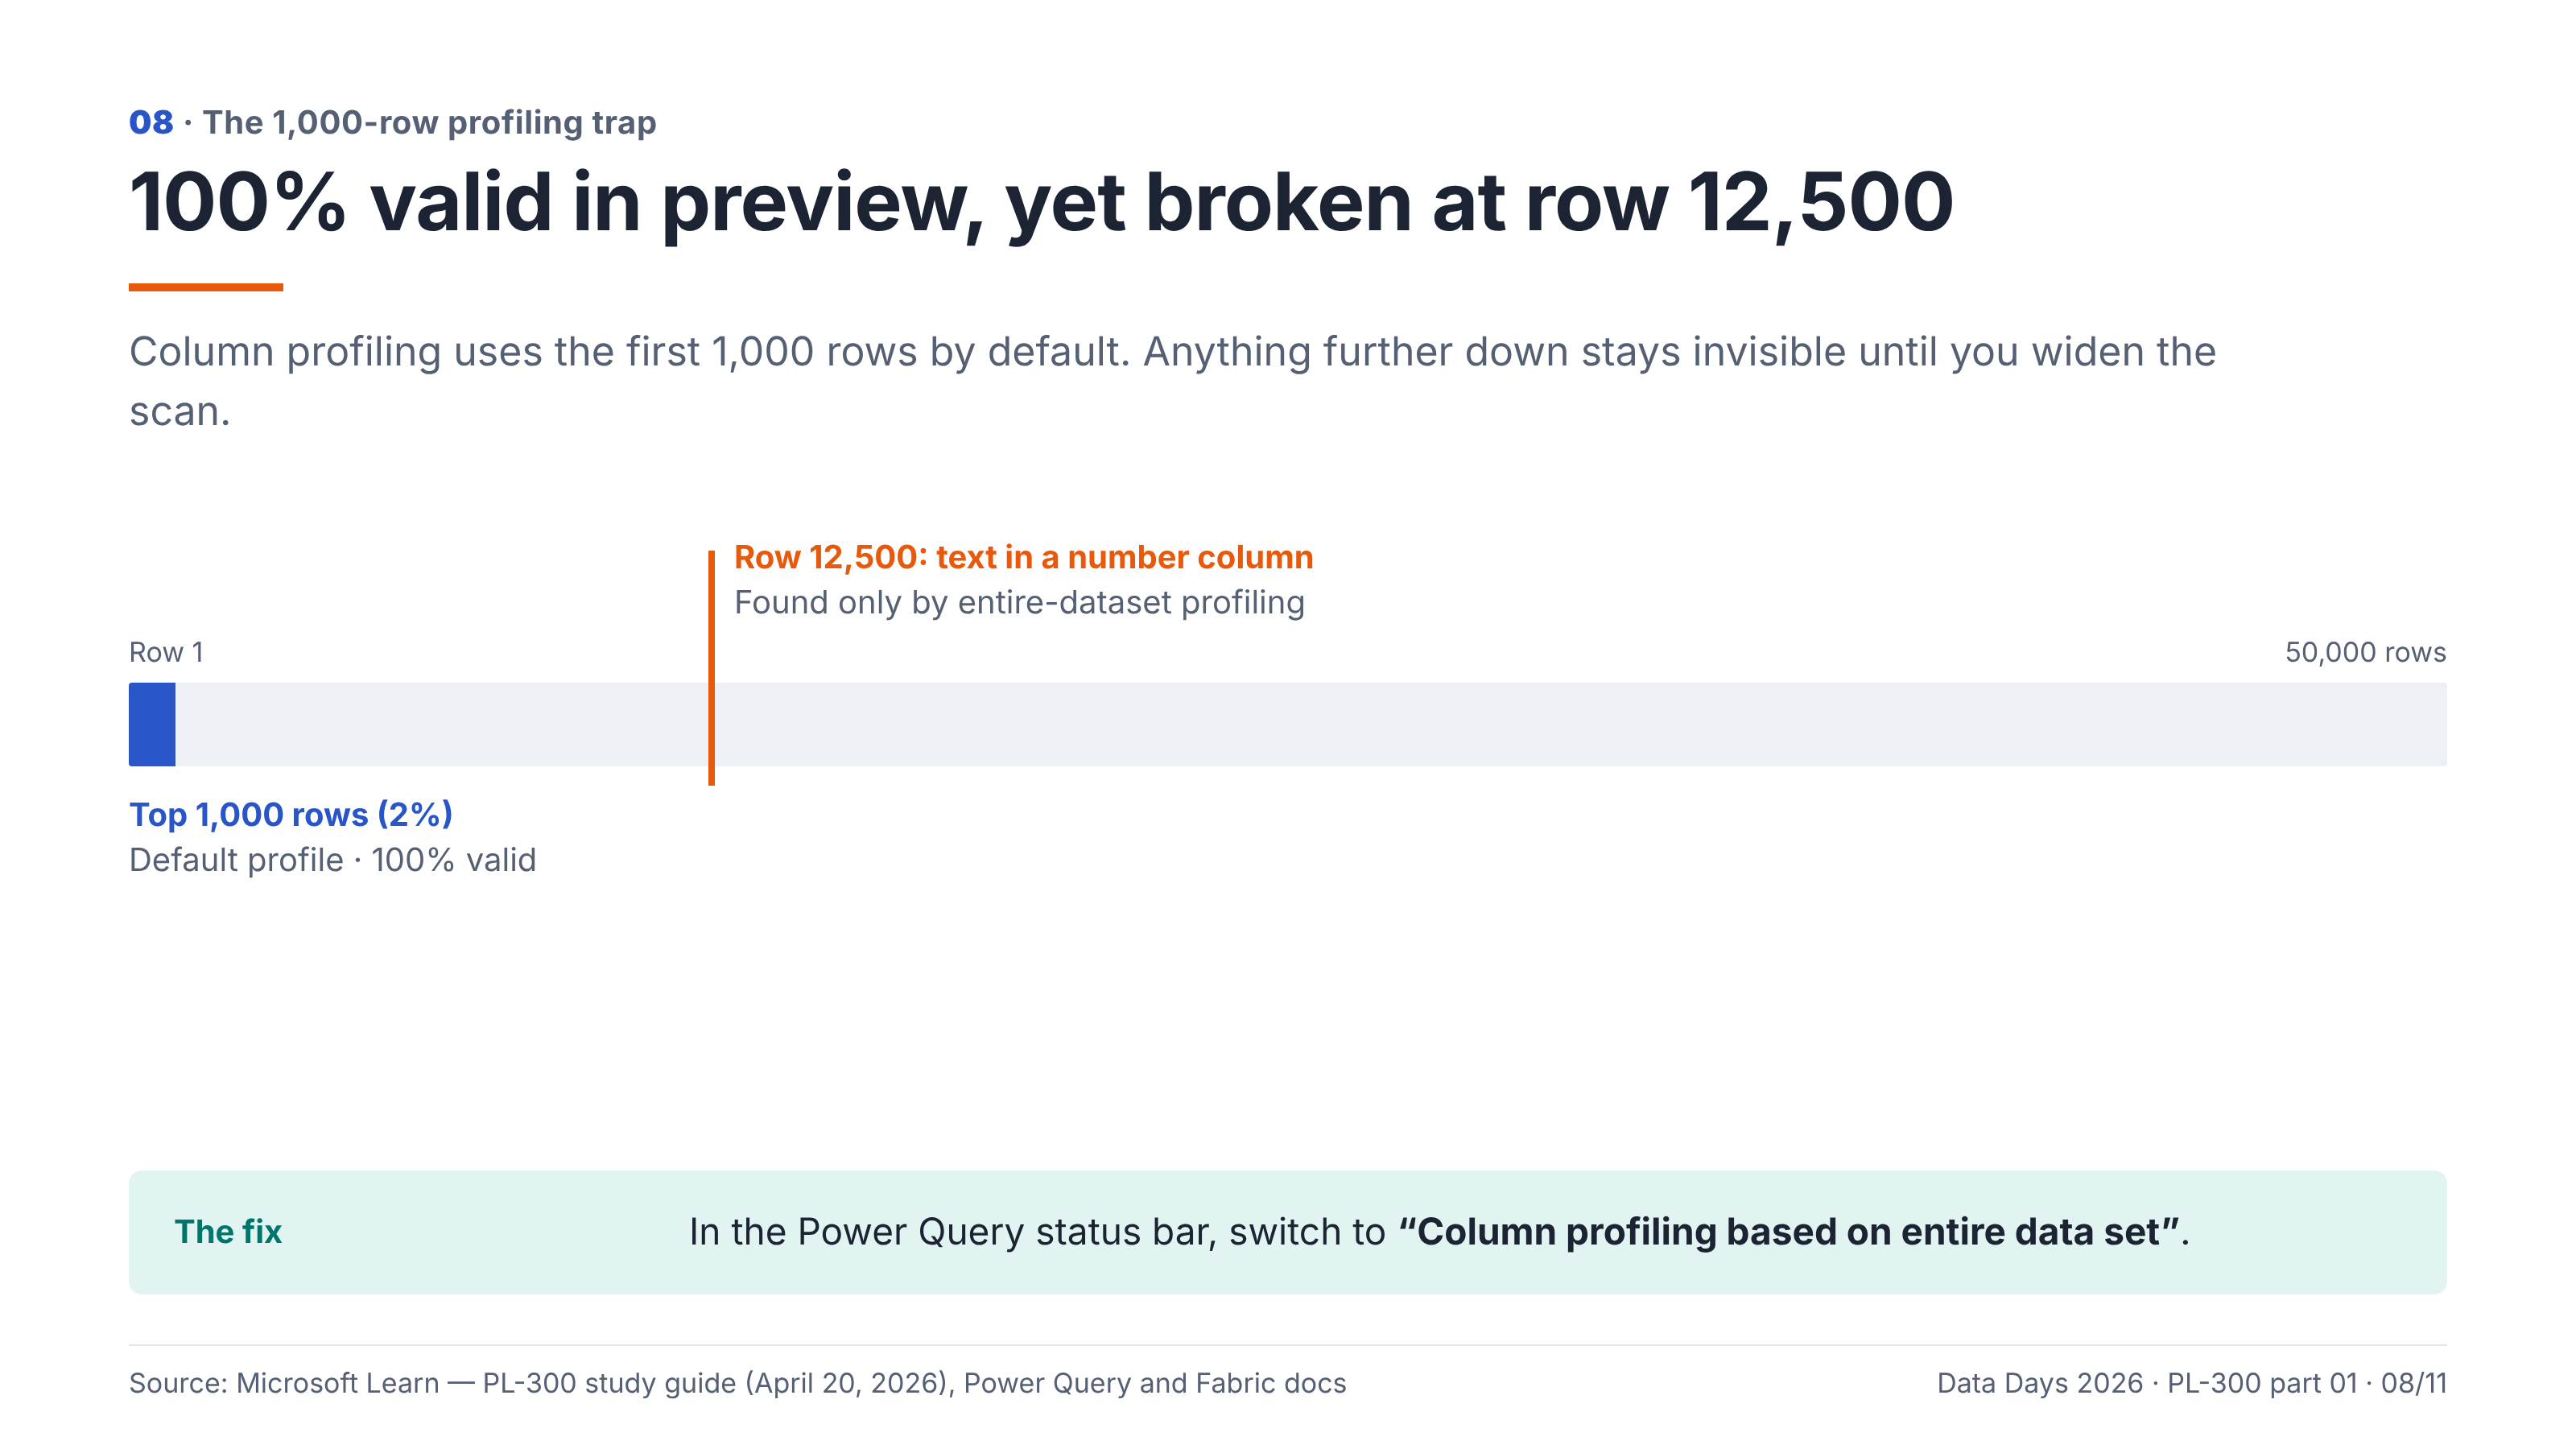
One particularly important Power Query behavior is that column profiling uses the first 1,000 rows by default.
Imagine a dataset containing 50,000 rows.
The first 1,000 contain valid numbers, but row 12,500 contains text where a numeric value is expected.
The default profiling preview may not reveal the issue.
To inspect all rows, use the option in the Power Query Editor status bar to change profiling from the top 1,000 rows to the entire dataset.
This is a small setting with significant practical implications.
7. Cleaning Data: Do Not Confuse Unexpected with Incorrect
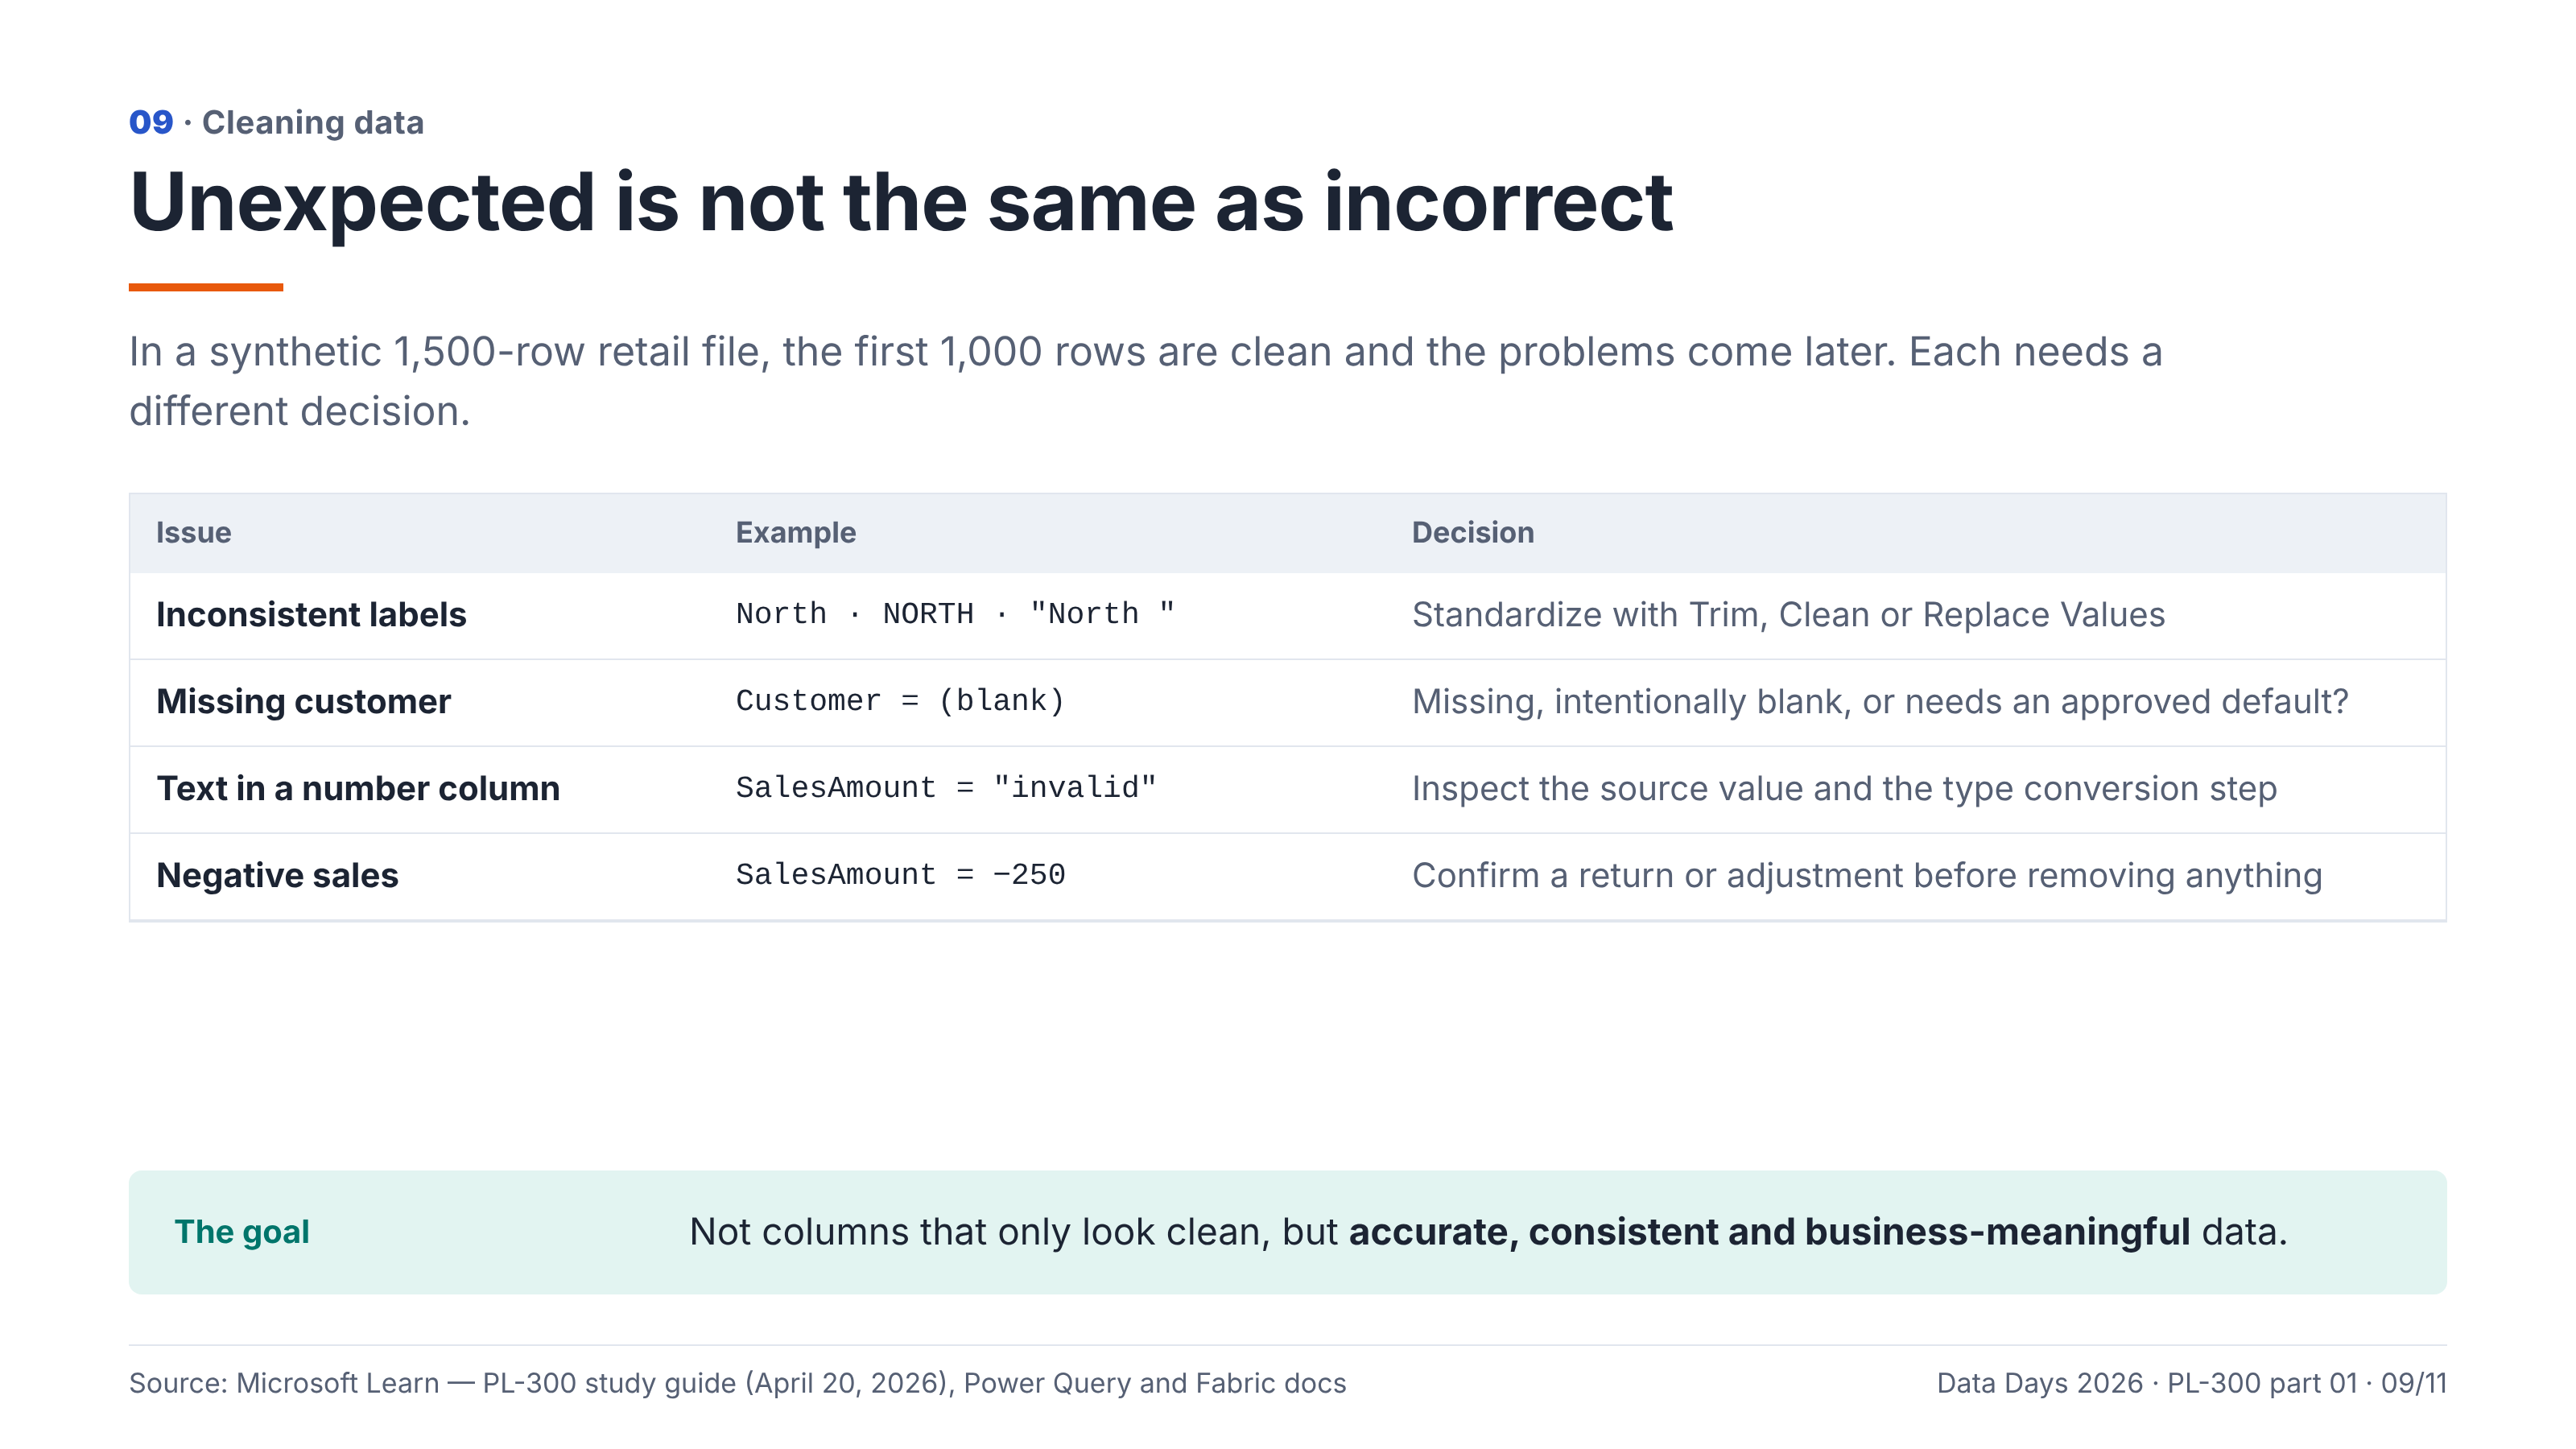
During our Power BI demonstration, we use a synthetic retail sales dataset with 1,500 records.
The first 1,000 records are deliberately clean. Problems appear later in the dataset.
Examples include inconsistent values such as North, NORTH, and North , missing customer names, an invalid sales amount, and a negative transaction.
Each issue requires a different decision.
Inconsistent region labels: Standardization may be appropriate using Trim, Clean, or Replace Values.
Missing customer information: Investigate whether the value is genuinely missing, intentionally blank, or requires a business-approved default.
Text in a numeric column: Inspect the source value and data type conversion step before correcting the error.
Negative sales values: Confirm whether these represent legitimate returns or adjustments rather than automatically removing them.
The goal of data preparation is not to make every column appear clean at any cost.
The goal is to produce accurate, consistent, and business-meaningful data.
8. Resolving Common Data Import Errors
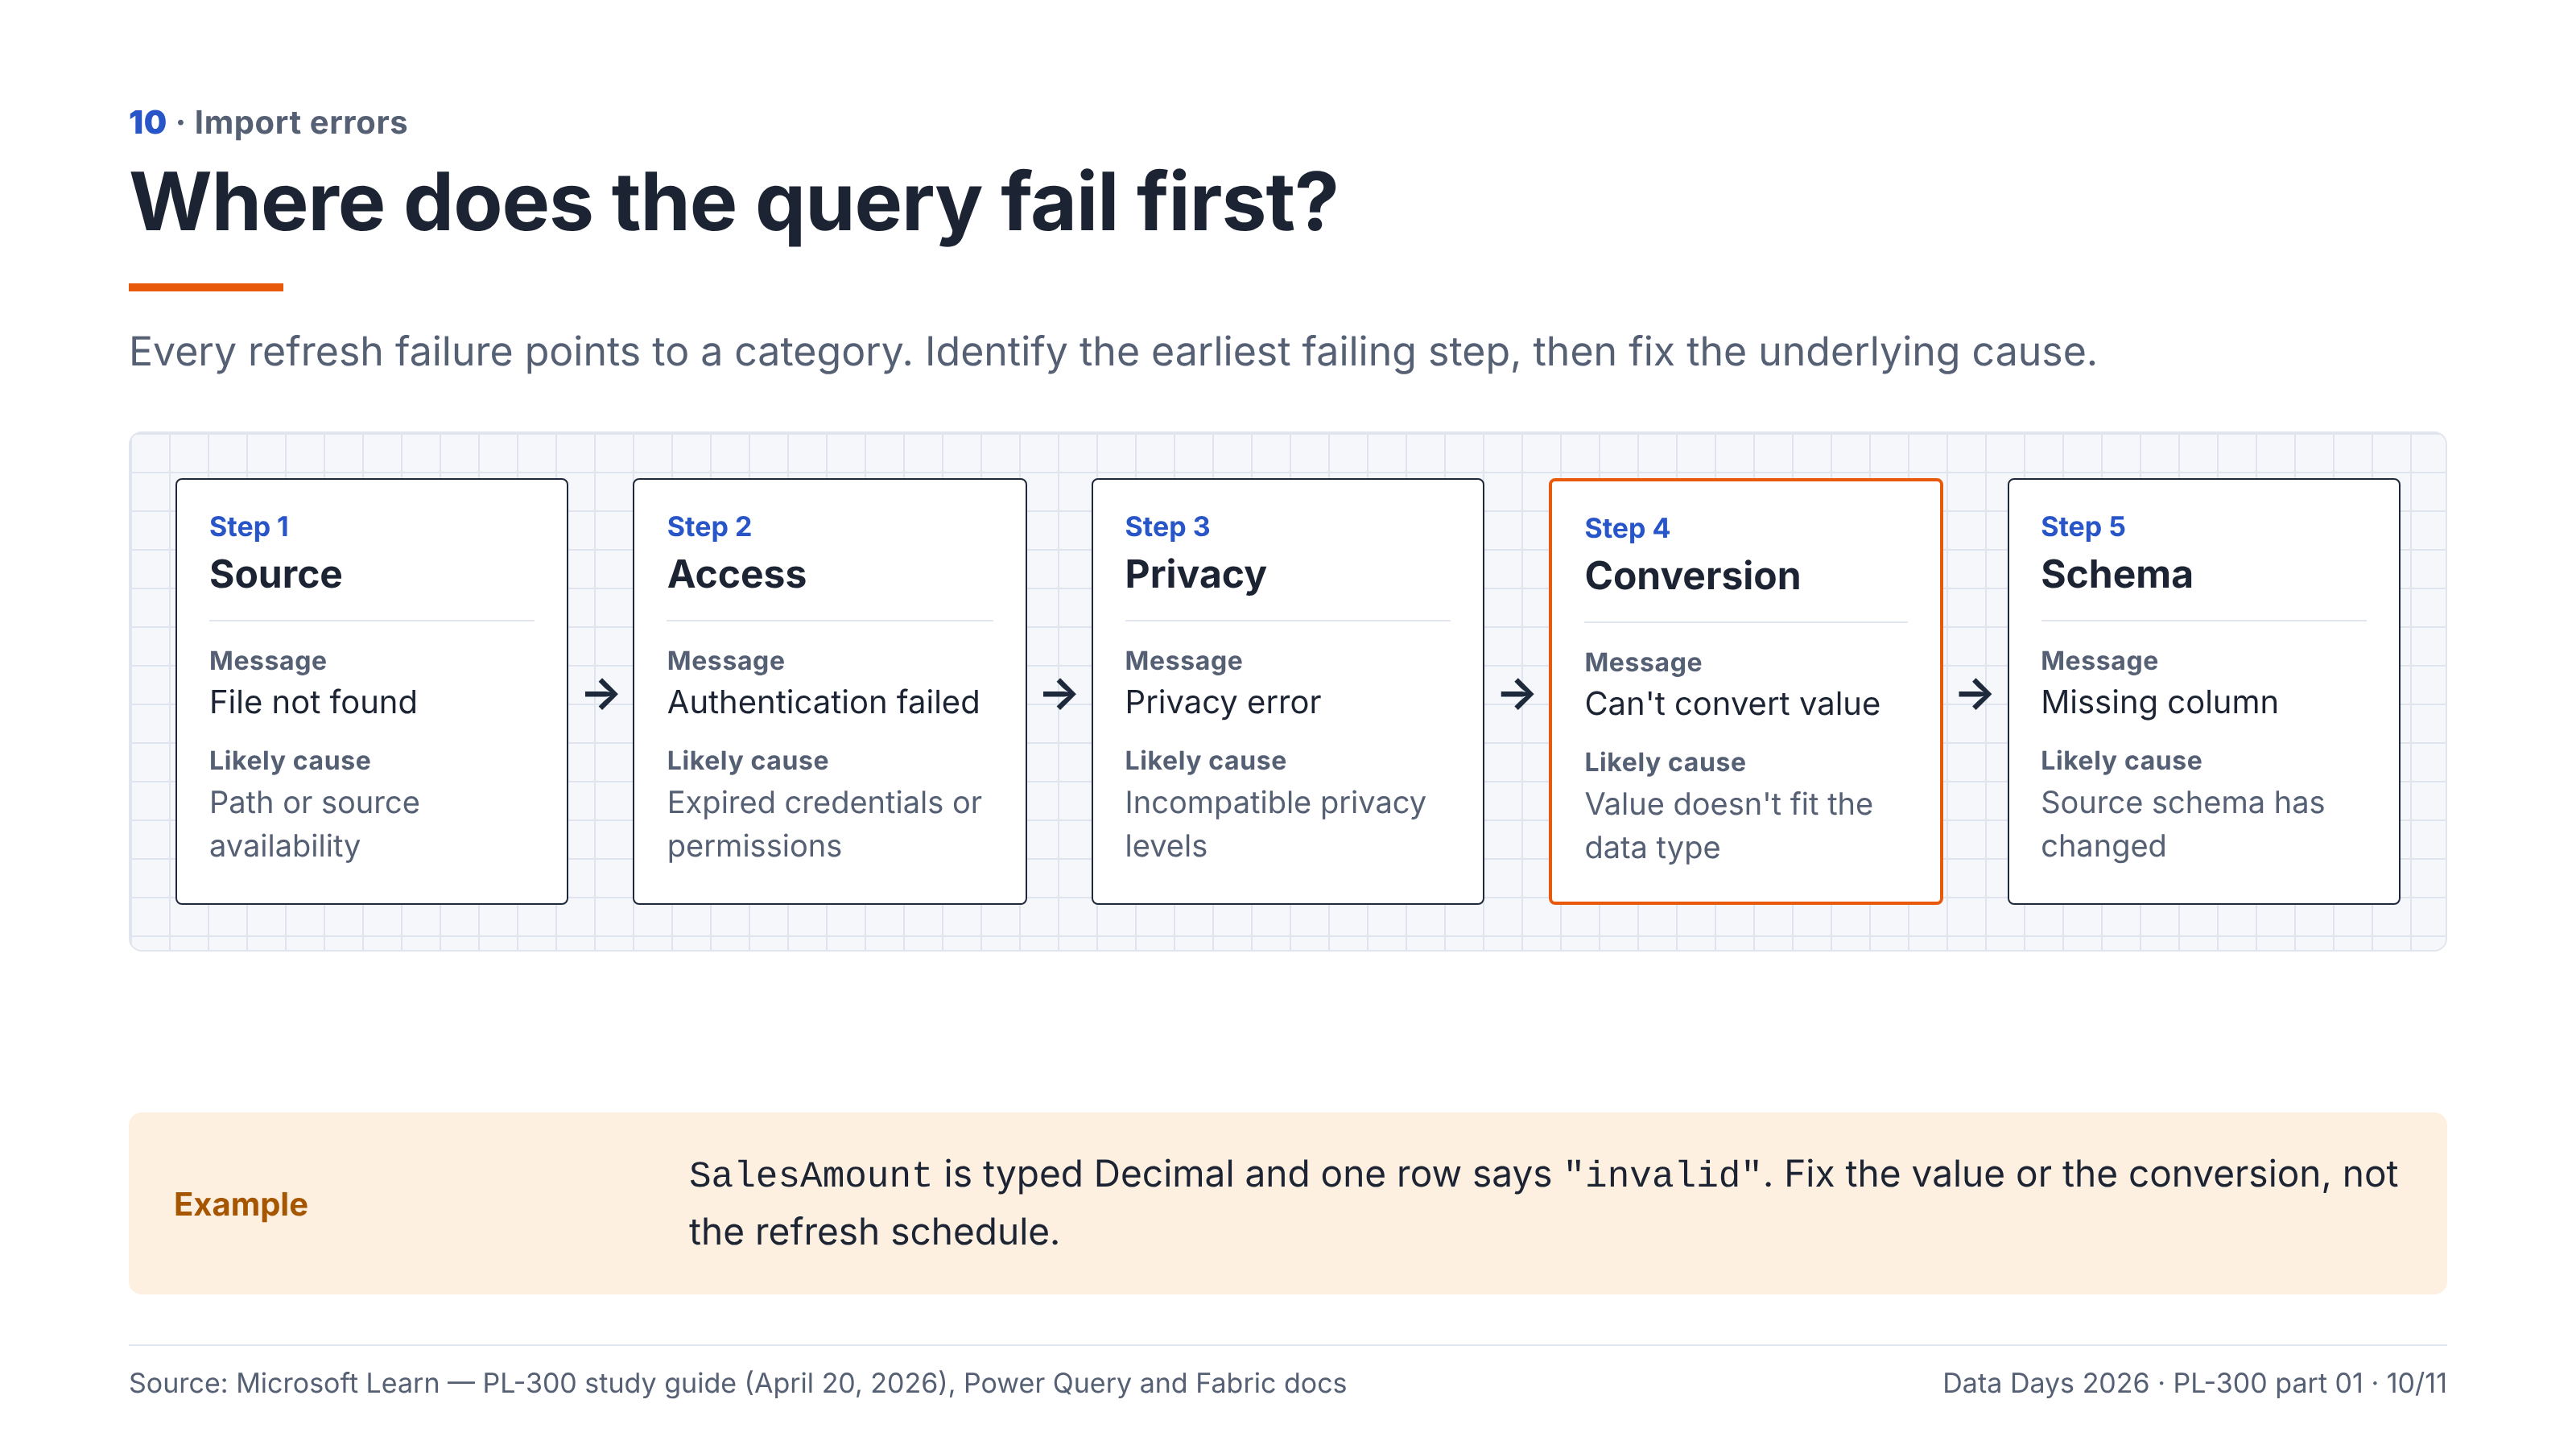
Power BI refresh and import failures usually point toward a specific category of problem.
A file-not-found message suggests a path or source availability issue.
An authentication failure suggests expired credentials or insufficient permissions.
A privacy error suggests incompatible data source privacy configurations.
A conversion error suggests that a value cannot be interpreted using the specified data type.
A missing-column error may indicate that the source schema has changed.
The most effective troubleshooting approach is to identify the earliest failing step in the query and inspect the underlying cause.
For example, suppose the SalesAmount column is converted to Decimal Number, but one row contains the value "invalid".
The problem is not necessarily the refresh schedule, semantic model, or report visual.
The immediate issue is that the value cannot be converted to the required numeric type.
Correcting the source value, applying an approved error-handling rule, or adjusting the transformation should be evaluated before proceeding.
9. PL-300 Practice Corner: Test Your Understanding
The following are original practice scenarios designed around the Microsoft Learn skills measured. They are not actual certification examination questions.
Question 1 — Shared Semantic Model
An organization has an approved semantic model with reusable measures and existing security rules. A new reporting team must build additional reports while minimizing duplicated development.
Which option is most appropriate?
A. Import the original Excel extracts
B. Connect to the existing shared semantic model
C. Recreate all measures in a new PBIX file
D. Export the source data to CSV
Answer: B. Reusing the model preserves the existing governed logic and minimizes duplication, subject to access and licensing requirements.
Question 2 — Storage Mode
An operational SQL database receives frequent updates. A dashboard must query source data with minimal delay, and the source can support interactive query workloads.
Which mode is the strongest initial candidate?
A. Import
B. DirectQuery
C. Manual CSV refresh
D. Calculated table
Answer: B. DirectQuery retrieves data from the underlying source during query execution rather than relying on an imported snapshot.
Question 3 — Data Profiling
A Power Query preview shows 100% valid numeric values, but the full refresh later encounters an invalid value beyond the first 1,000 records.
Which action should the developer take to investigate?
A. Disable query loading
B. Delete all negative transactions
C. Change profiling to the entire dataset
D. Configure a report bookmark
Answer: C. Entire-dataset profiling helps identify issues outside the default profiling sample.
Question 4 — Power Query Parameters
A Power BI solution must switch between development and production SQL environments without repeatedly editing connection strings.
Which feature is appropriate?
A. Report bookmark
B. Row-level security
C. Power Query parameter
D. Visual interaction setting
Answer: C. Power Query parameters allow reusable values to control source and query configuration.
The recurring lesson is simple: read the business requirement first, then choose the technology that satisfies it.
10. Final Takeaways
Building reliable Power BI solutions begins before the first chart is created.
A well-designed report depends on choosing the right source, selecting appropriate connectivity, respecting data security, managing configuration, and validating data quality.
For PL-300 candidates, these are important certification skills.
For practicing data professionals, they are essential engineering habits.
Remember:
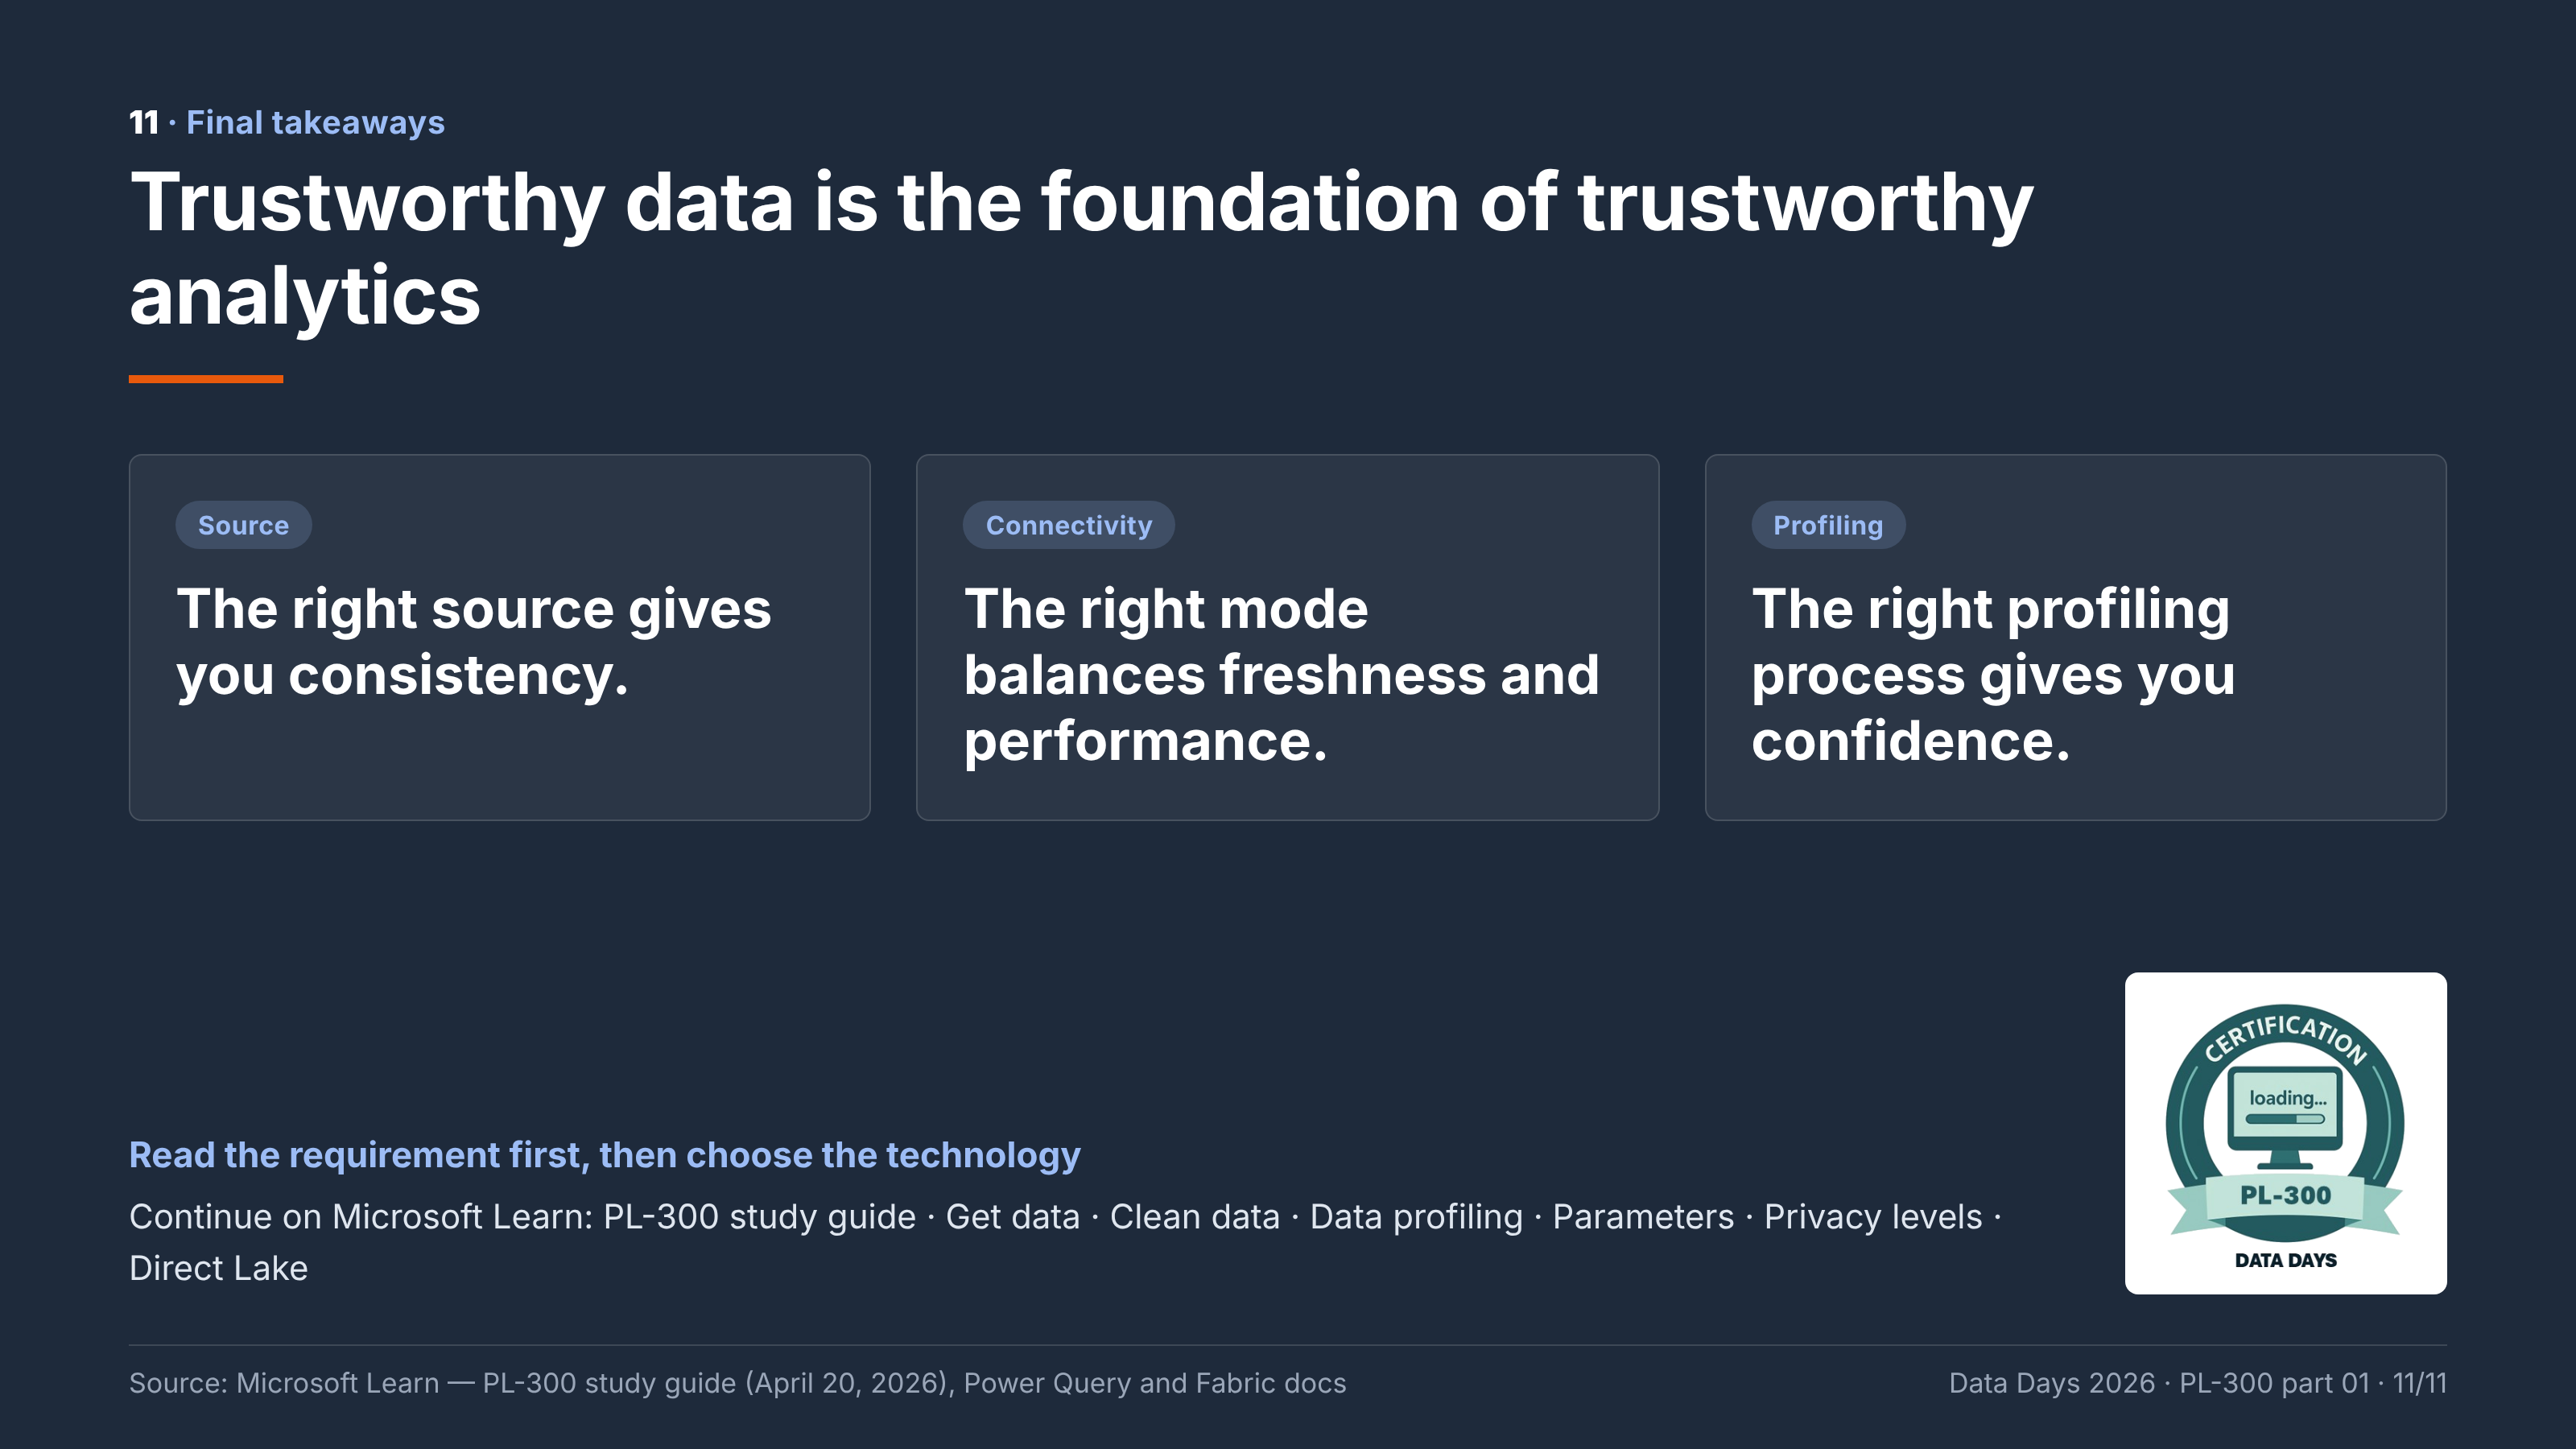
The right source gives you consistency. The right connectivity mode gives you an appropriate balance of freshness and performance. The right profiling process gives you confidence in your data.
And ultimately, trustworthy data is the foundation of trustworthy analytics.
Continue Learning — Official Microsoft Resources
This article is Part 01 of the Microsoft Data Days 2026 Certification Learning Series, accompanying the PL-300 session “Get, Connect & Profile Data” on 4 November 2026.
The series focuses on Microsoft Learn-aligned concepts, real-world demonstrations, and original scenario-based certification preparation.
Disclaimer: This is an independent educational article based on publicly available Microsoft Learn documentation. The practice questions are original and are not official Microsoft exam questions.
#MicrosoftDataDays #PL300 #PowerBI #MicrosoftFabric #MicrosoftLearn #DataAnalytics
Keep reading
PL-300 Episode 2: Transform & Load Data in Power Query
PL-300 Episode 2: set data types, add columns, group, pivot, unpivot, append, merge, build fact and dimension tables, and choose what loads, with screenshots.

Fabric Overview, Domains, Workspaces & OneLake
Fabric in four ideas: the platform, domains for ownership, workspaces for access and OneLake for storage, explained with eight diagrams and a cheat sheet.