PL-300 Episode 5: Build Reports

PowerBI consultant ·
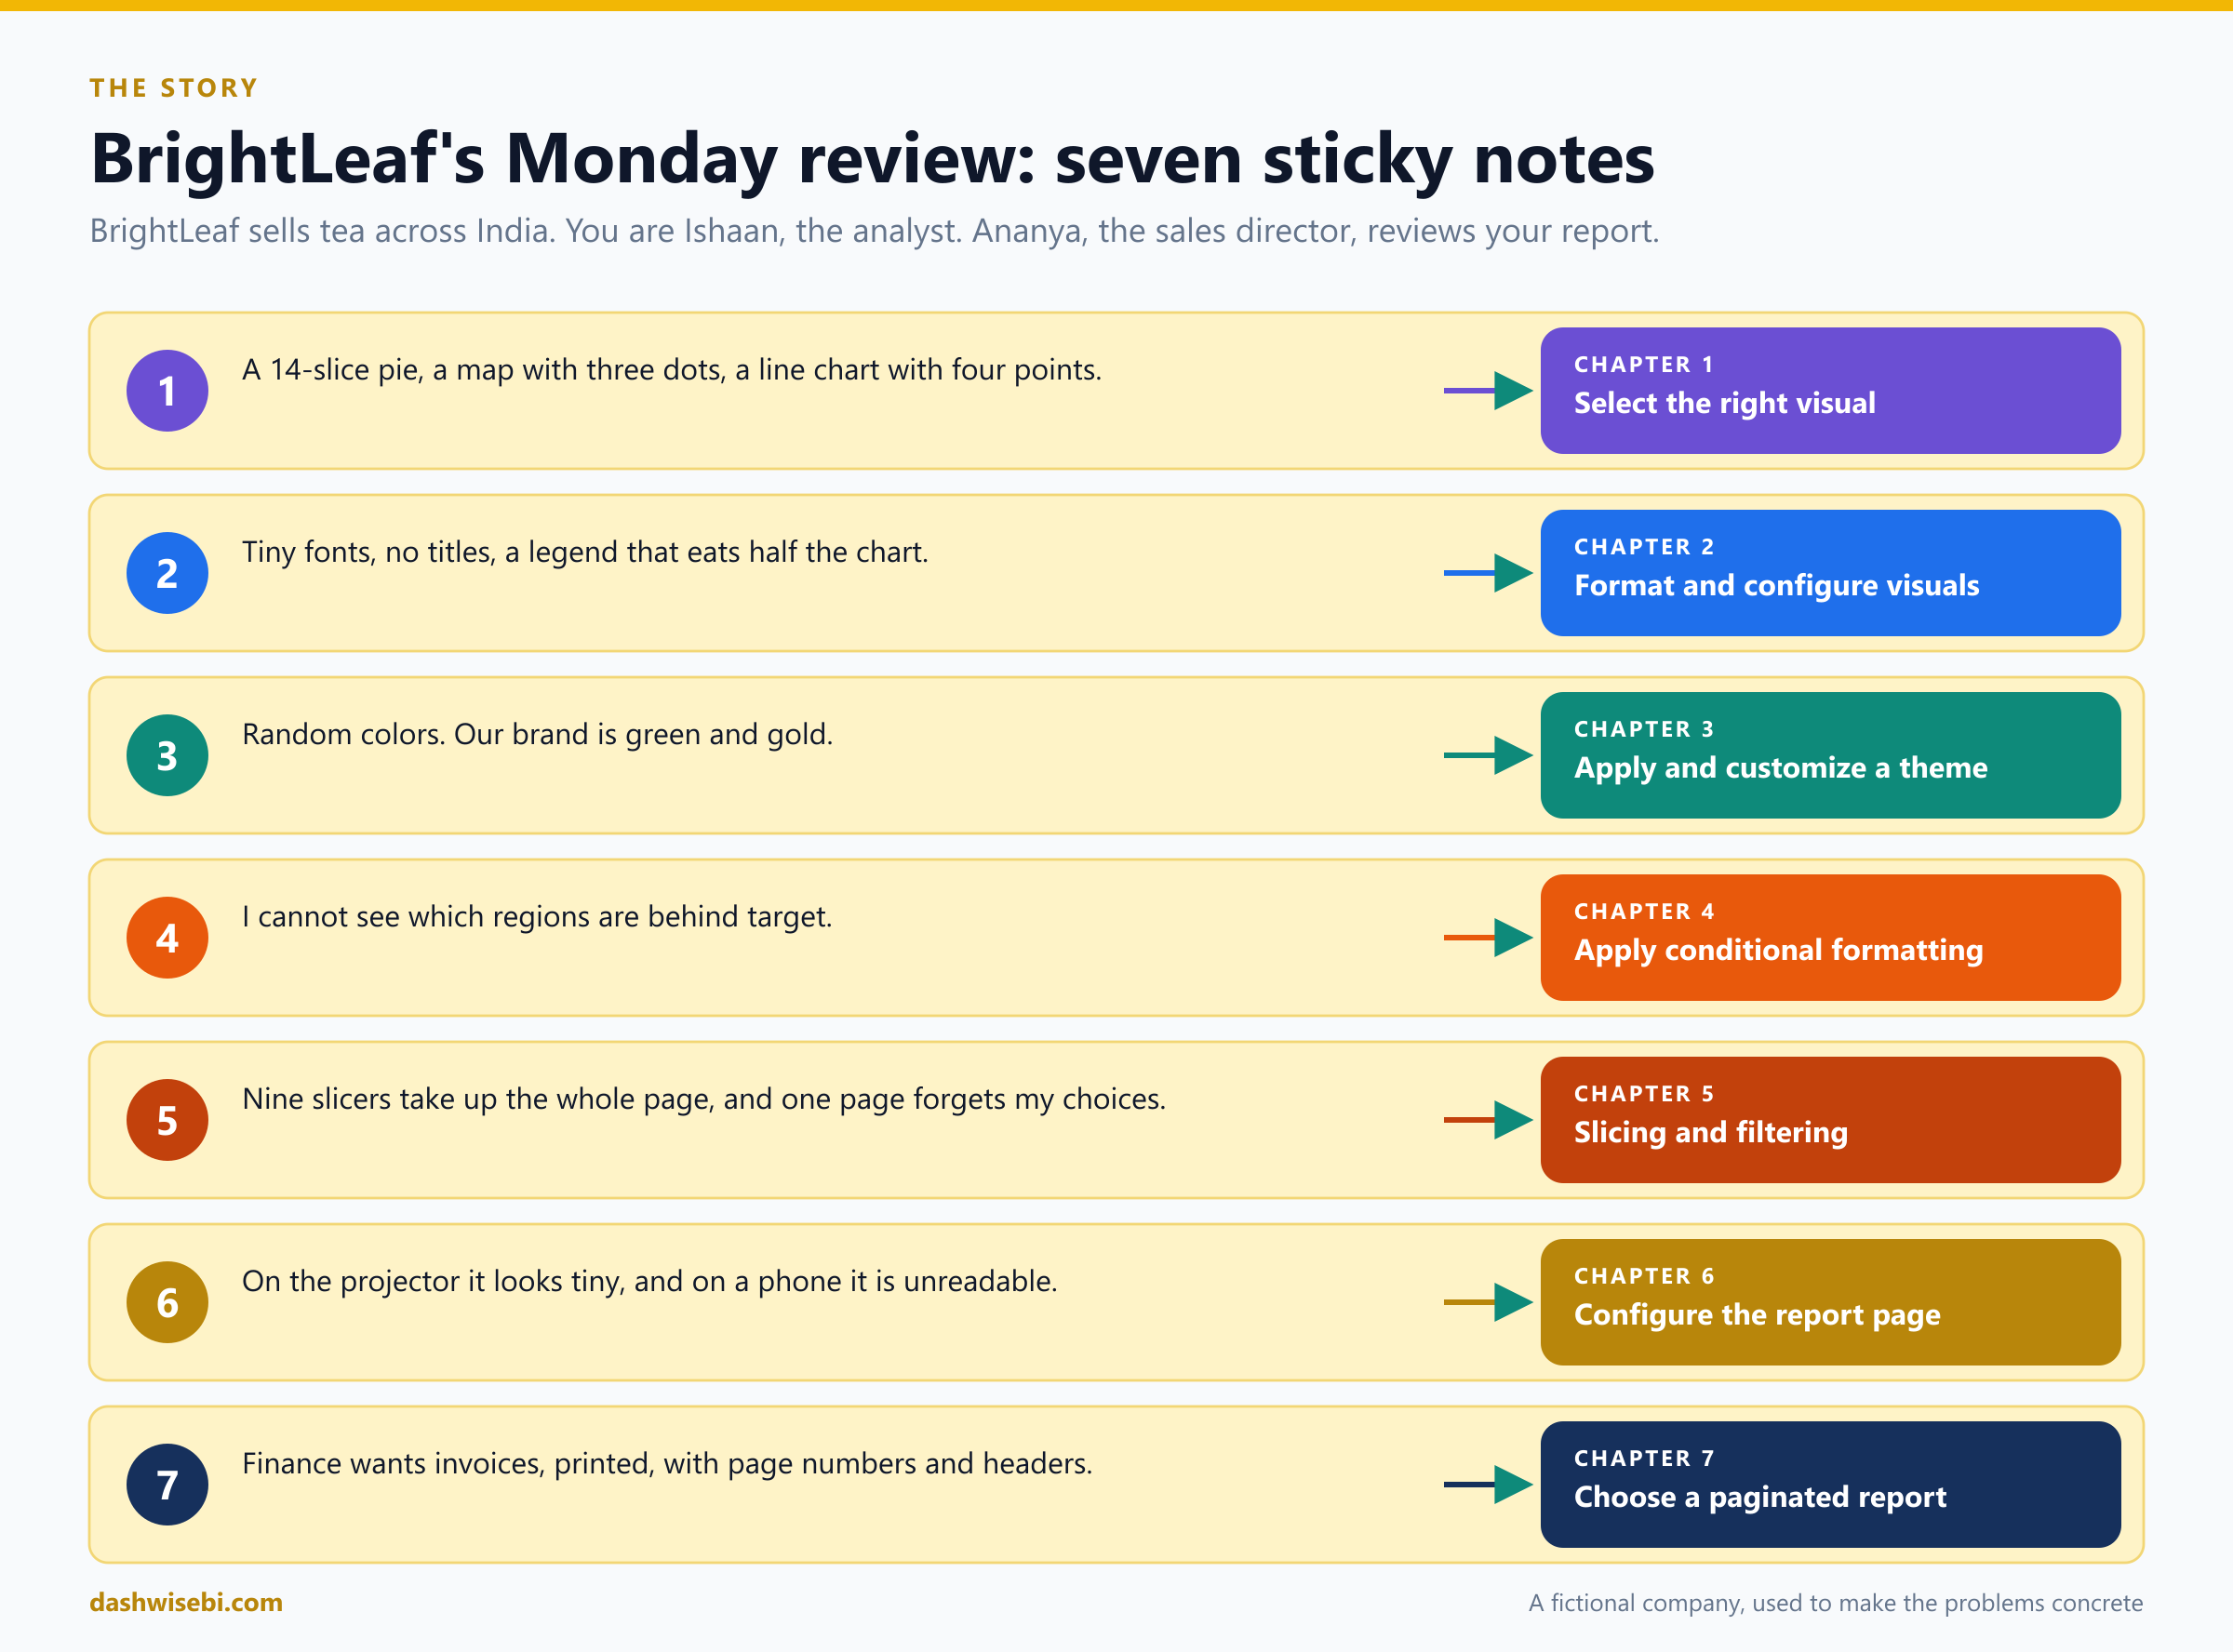
It is Monday, 9:00. In the BrightLeaf meeting room, Ananya, the sales director, spreads a printout of your report across the table. It is covered in yellow sticky notes. You count seven.
Welcome to Episode 5 of our PL-300 series. In Episode 4 you made the model smart and fast. Now the model has to face the people who read it. This episode opens the Visualize and analyze the data skill area (25 to 30 percent of the exam) with the group Create reports. These are the seven topics:
- Select an appropriate visual
- Format and configure visuals
- Apply and customize a theme
- Apply conditional formatting
- Apply slicing and filtering
- Configure the report page
- Choose when to use a paginated report
Like the last few episodes, this post is a working session instead of a reference list. Each sticky note is a chapter, and every chapter has the same rhythm:
- The sticky note. What Ananya does not like.
- Pause and decide. Try the choice first. The answer is behind a click.
- Why. The reasoning, with diagrams.
- Exam lens. What PL-300 tends to ask, and the traps.
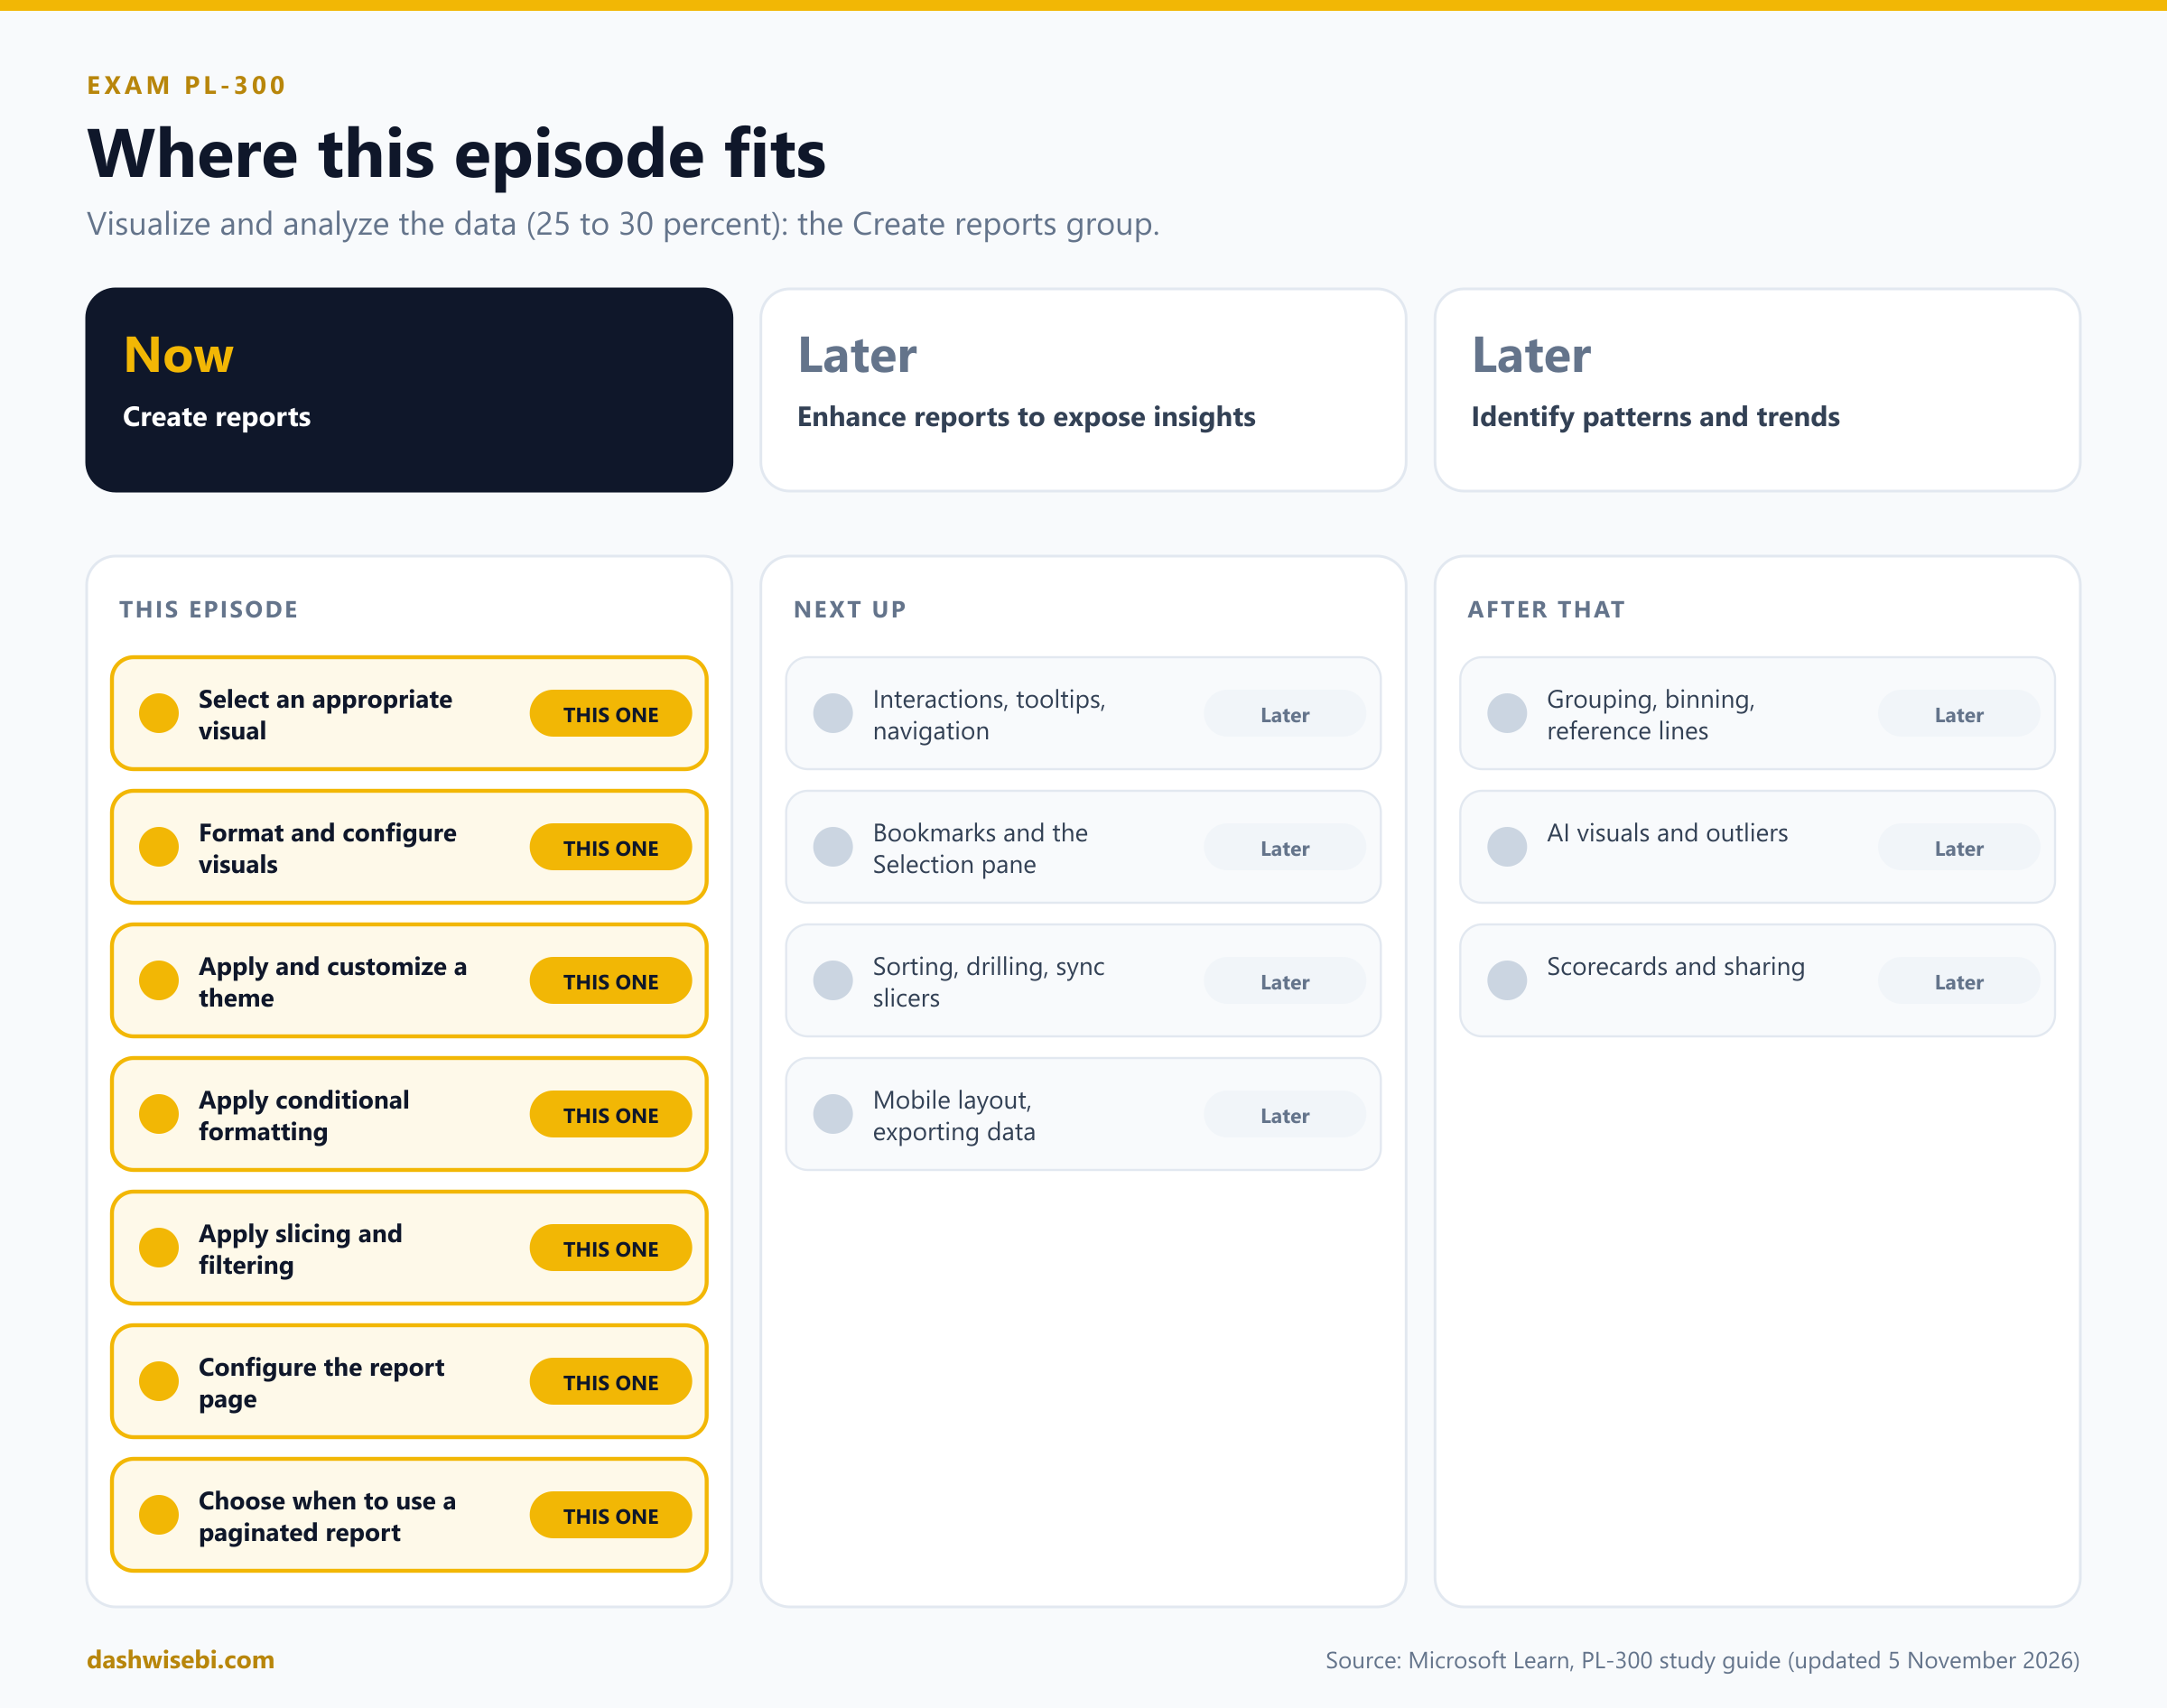
A note on wording. The study guide Microsoft updated on 5 November 2026 puts these seven topics in Create reports. The next groups (interactions, tooltips, bookmarks and navigation, then grouping, AI visuals and scorecards) come in later episodes. A few features here are in preview, and I label them. Before an exam, check the live documentation for their status.
Sticky note 1. “A 14-slice pie, a map with three dots, a line chart with four points”
Ananya taps the first note. “I asked how our fourteen tea categories compare, and I got a rainbow. What am I looking at?”
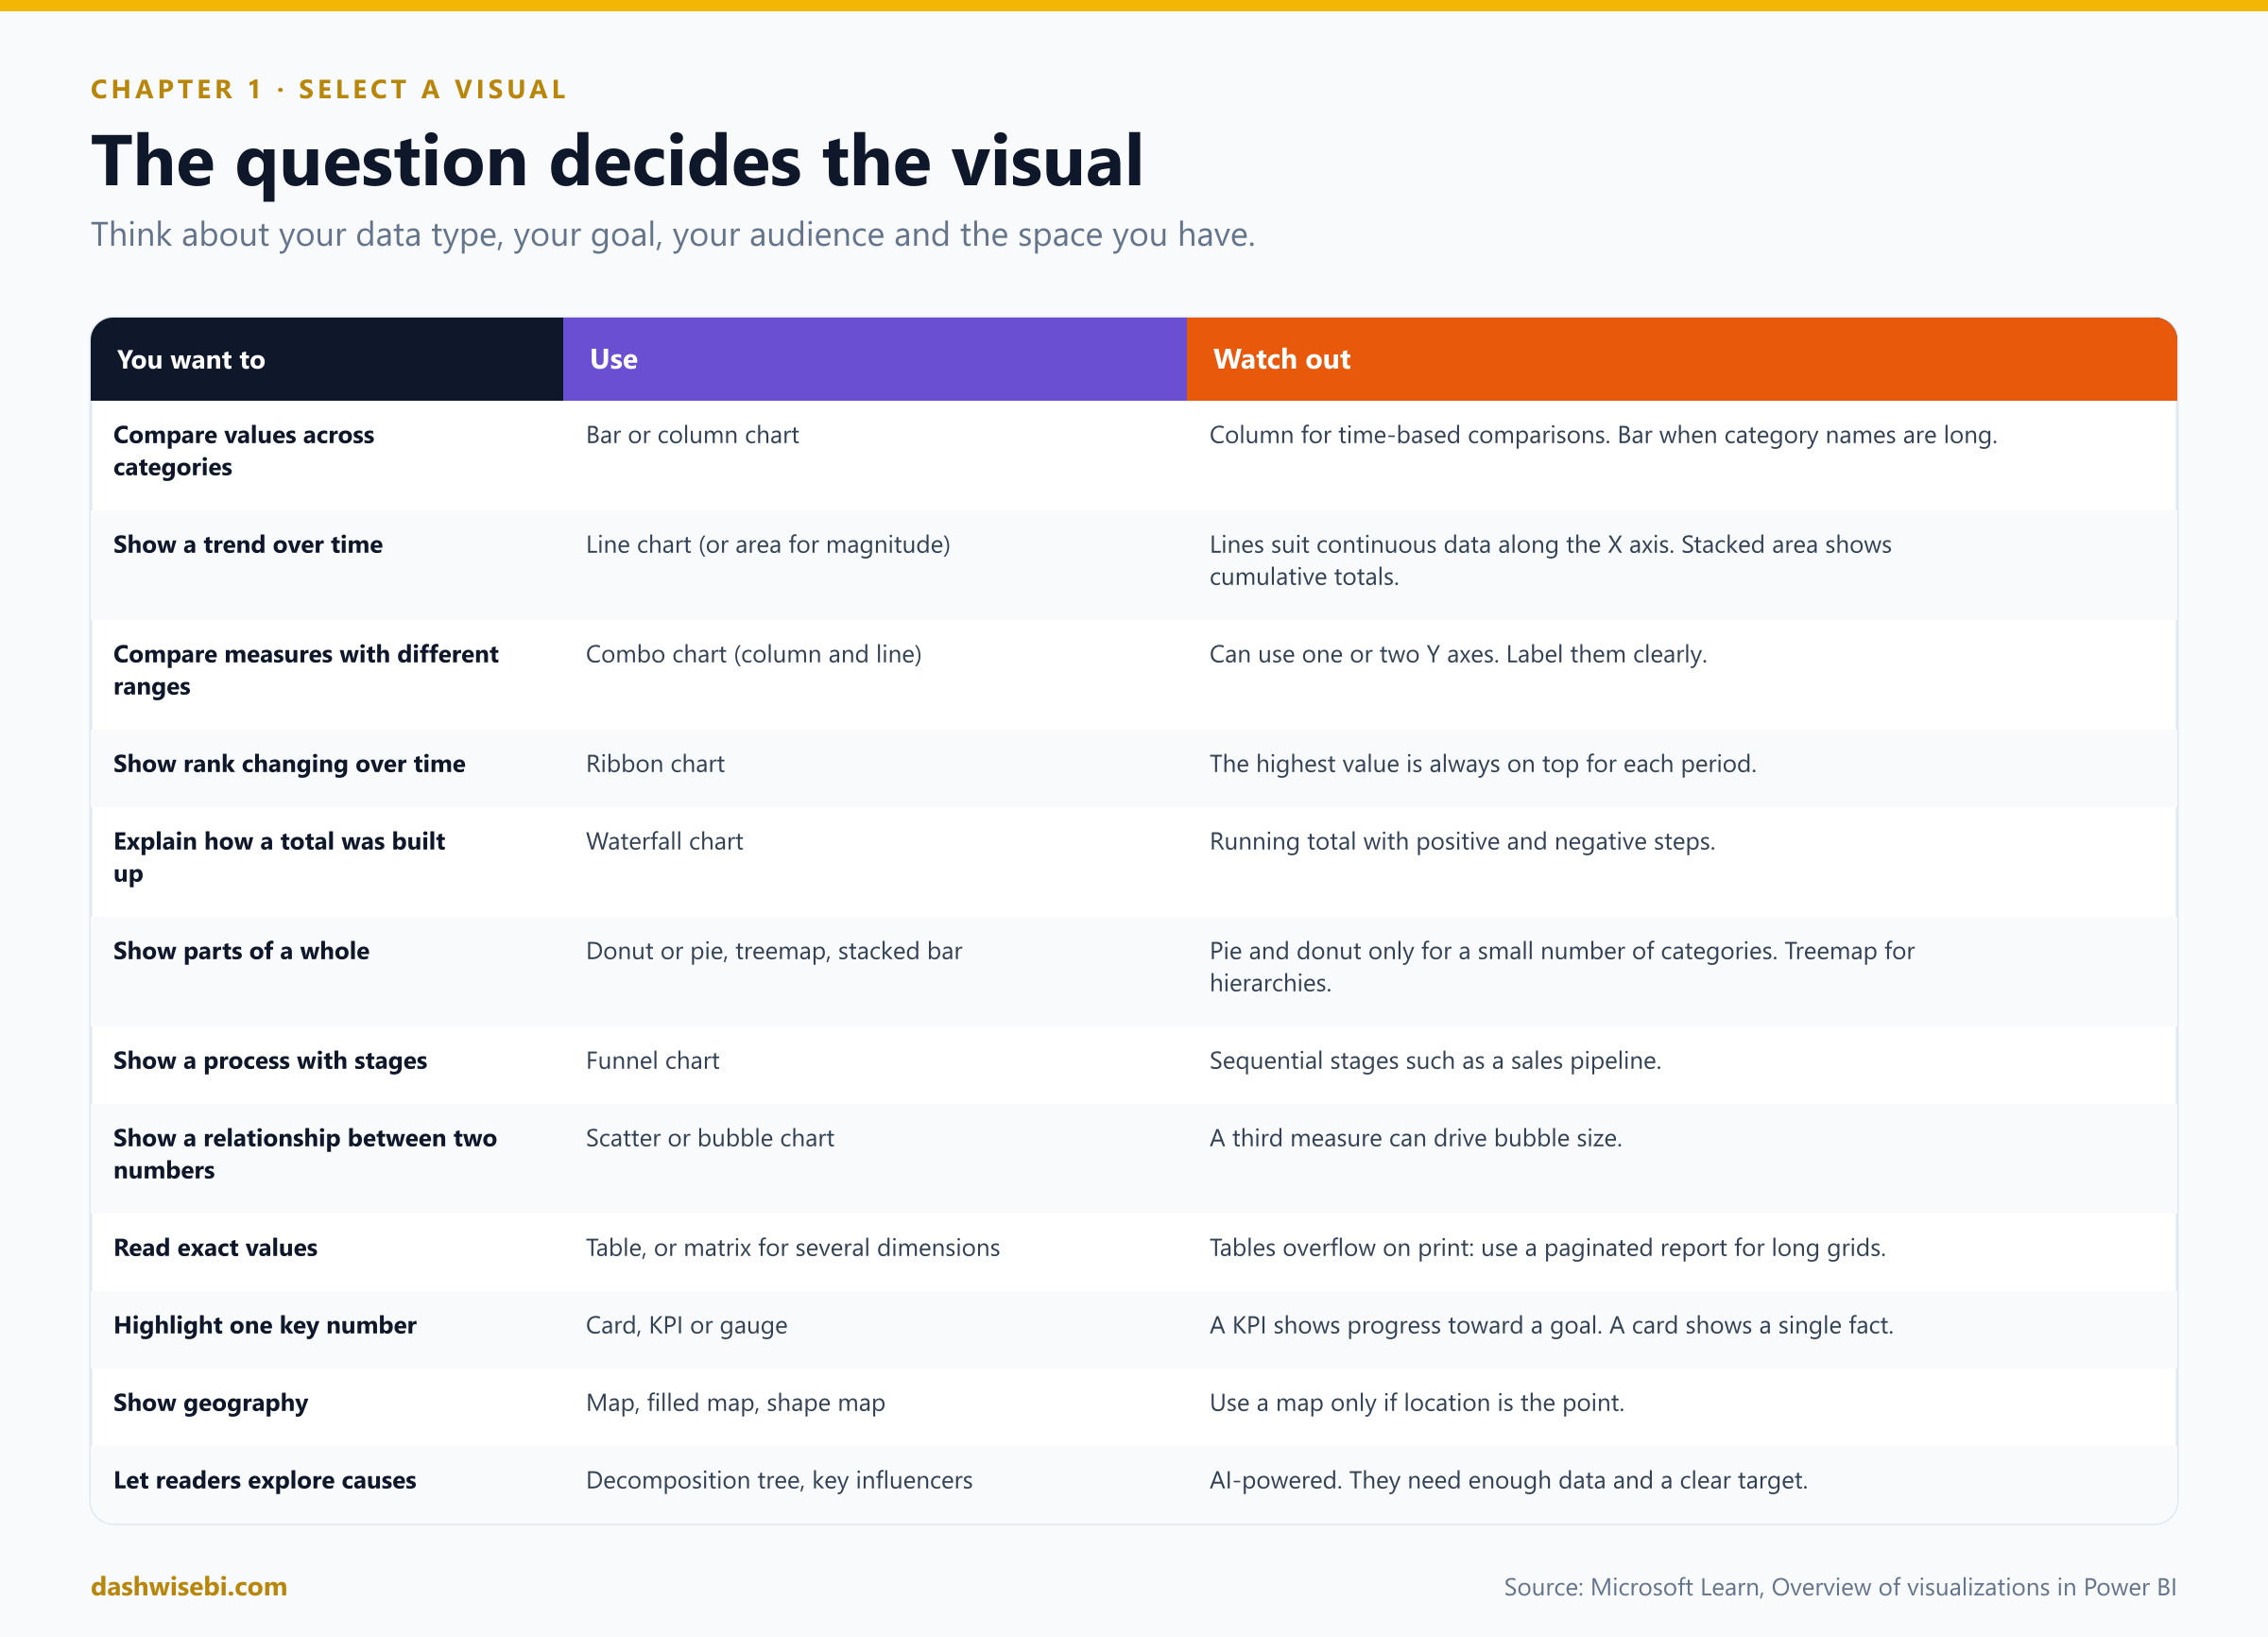
A visual is the answer to a question. Microsoft lists four things to weigh before you pick one: your data type (categorical, numerical, time-based or geographic), your goal (compare, show a trend, show a relationship or track progress), your audience (how much detail they need) and the space you have. Try four of Ananya's questions.
Pause and decide. She wants the 14 product categories compared by sales. The report shows a pie chart. What do you replace it with?
A bar chart (sorted). Bar and column charts are the standard for comparing values across categories, and bars work better when category names are long. Pie and donut charts show parts of a whole and are meant for a small number of categories. If the categories form a hierarchy (category, then blend), a treemap shows proportions of a large hierarchy.
Pause and decide. She wants to see whether monthly sales are trending up or down over two years. Which visual?
A line chart. Lines emphasize the shape of values over time and work best with continuous data along the X axis. Use an area chart when the size of the change matters, or a combo chart to put sales (columns) and margin percent (line) together, because their ranges differ.
Pause and decide. The card says “Sales YTD: 8.4 crore”. She wants to know how close that is to the annual target. What do you use?
A KPI visual. It communicates progress toward a measurable goal, with the distance to the target. A card shows a single fact, and a gauge shows one value against a target. Use the KPI when the trend and the goal both matter.
Pause and decide. Which tea blend ranked first each month, and how did the ranking change?
A ribbon chart. It shows which category has the highest rank over time, with the highest value always on top for each period.
Why: the visual follows the question
- Tables and matrices are for exact values. A matrix supports a stepped layout, aggregates automatically and lets you drill into hierarchies. Remember the catch in Chapter 7: a table in a Power BI report scrolls instead of growing.
- Maps (map, filled map, shape map and others) only earn their space when location is the point. Three dots on a map of India tell no more than three bars.
- AI-powered visuals help readers explore: the decomposition tree (drill in any order, with AI suggesting the next dimension), key influencers, smart narrative text and anomaly detection on line charts.
- Preview visuals show (Preview) after their name. To use them in Desktop you typically enable them under File, Options and settings, Options, Preview features. An example is the Gantt visual.
- Custom visuals come from Microsoft AppSource. Test each one for speed: a poorly optimized custom visual can slow the whole report (Episode 4).
- Small multiples split one visual into a grid of smaller copies, one per value of a field (sales by region, one chart per region), so patterns are easy to compare.
- The Q&A visual is scheduled for deprecation in December 2026, so do not build new reports around it.
The pie becomes a sorted bar chart, and Ananya, for the first time this morning, says nothing. You take it as a good sign.
Exam lens
- Compare categories: bar or column. Trend: line. Rank over time: ribbon. Running total: waterfall. Progress to a goal: KPI or gauge. Parts of a whole: few categories only.
- Choose by data type, goal, audience and space.
- Tables show exact values. Use them sparingly.
Sticky note 2. “Tiny fonts, no titles, a legend that eats half the chart”
The second note is stuck on a column chart. Its legend is bigger than its columns.
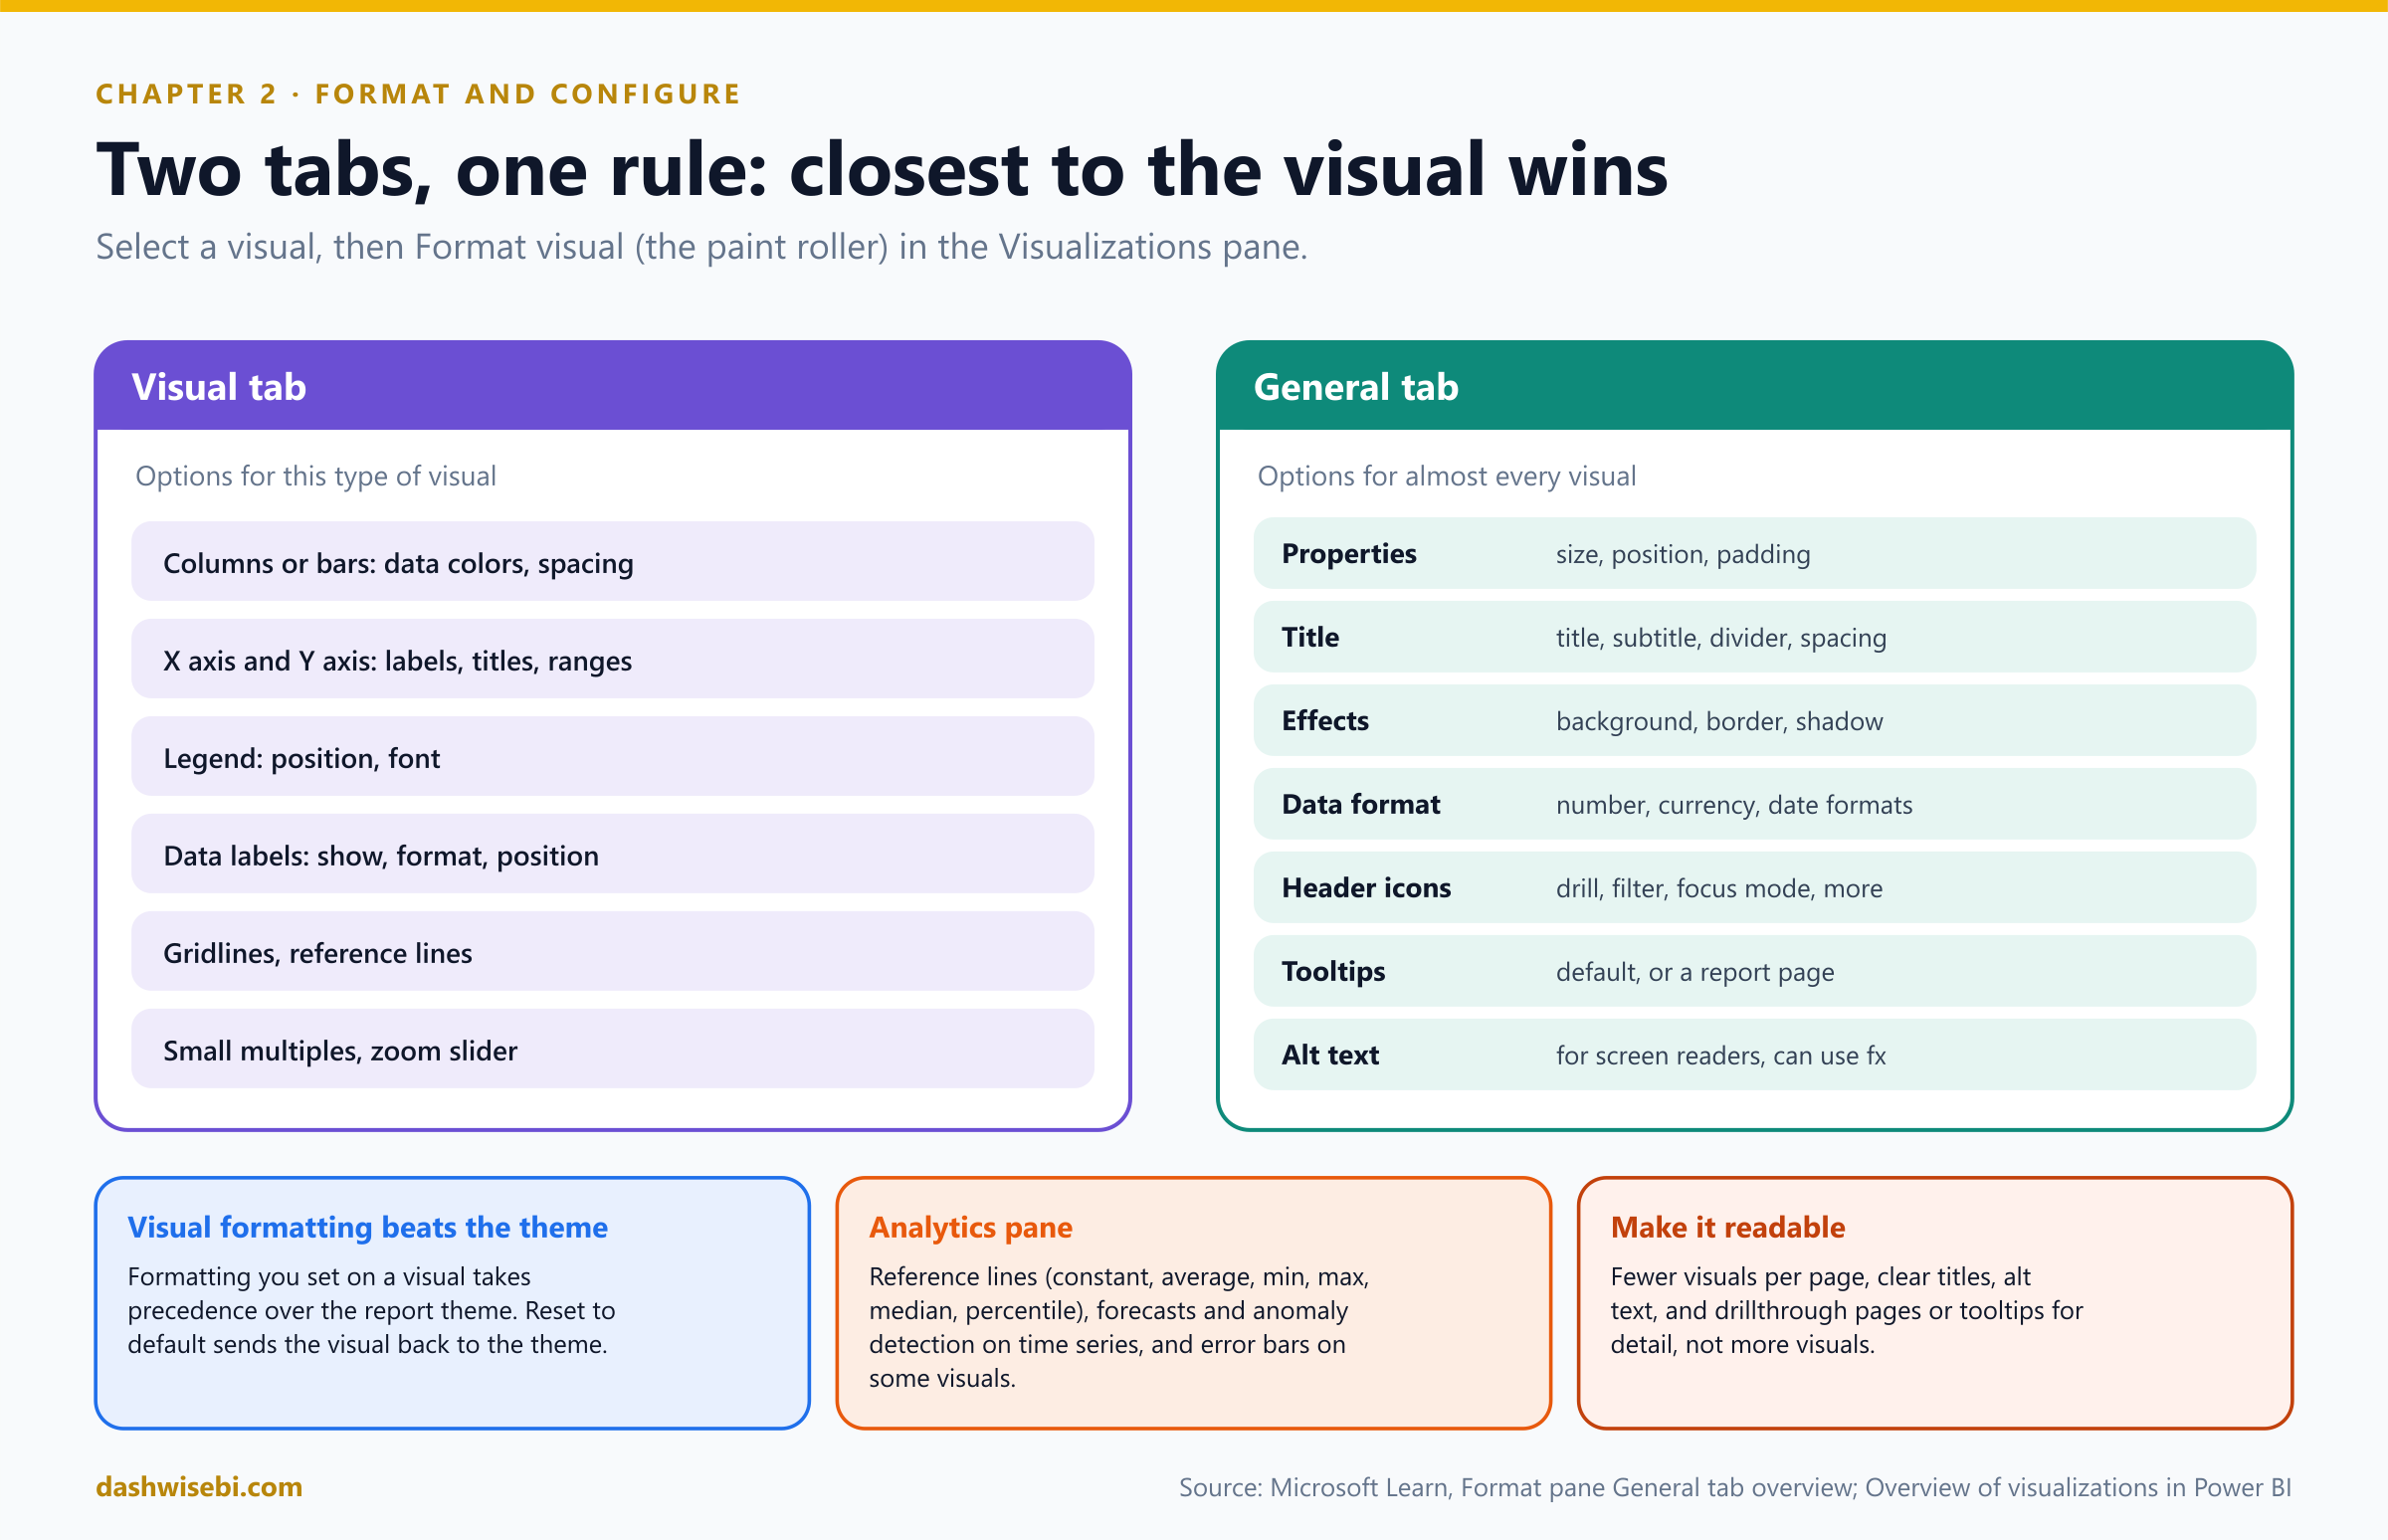
Select a visual and open Format visual (the paint-roller icon) in the Visualizations pane. You see two tabs:
- The Visual tab has options for this type of visual: data colors, axes, legend, data labels, gridlines.
- The General tab has options for almost every visual: Properties (size, position, padding), Title (with subtitle, divider and spacing), Effects (background, border, shadow), Data format, Header icons, Tooltips and Alt text.
Pause and decide. You want to set the exact size of one chart and add a divider line under its title. Which tab?
The General tab. Properties holds height, width, position and padding (with a lock aspect ratio option). Title holds the title, subtitle and divider, plus the spacing around them.
Pause and decide. You recolored one column chart by hand last week. Today you apply a new theme. Does that chart change?
Not until you reset it. Formatting you set on a visual takes precedence over the report theme. Use Reset to default on the visual (or on one formatting section) to return it to the theme.
Pause and decide. A chart title must say “Sales by month, North” when the North region is selected, and “Sales by month, all regions” otherwise. How?
Use fx on the title text and bind it to a measure, so the title follows the filters. For example:
Chart Title =
"Sales by month, " & SELECTEDVALUE ( Region[Region], "all regions" )
Pause and decide. A colleague who uses a screen reader opens the report. What do you set so the key visuals make sense to them?
Alt text on the General tab. Type a description, or use fx to build it from a measure so it updates with the data. Also give titles a semantic Heading level.
Why: configure, do not decorate
- Titles and labels: every visual needs a clear title. Format the font, size, color and alignment in Title, and add a subtitle for the unit or period.
- Data format: override the format of a field in this visual only (for example a currency or percentage) without changing the model. It is also where visual calculations get their format.
- Header icons: choose which icons readers see on a visual: drill up and down, focus mode, filter, more options and others. Hiding them does not change the editing view, so publish or switch to reading mode to see the result.
- Tooltips: the default tooltip shows the fields of the data point. Switch to Report page to show a whole page you designed (Chapter 6 shows how to size it).
- Analytics pane: add reference lines (constant, average, minimum, maximum, median, percentile) to many visuals. For time series you can add a forecast and anomaly detection, and some visuals support error bars.
- Less is more. Limit the number of visuals on a page, and put extra detail on a drillthrough page or a page tooltip (Episode 4).
Exam lens
- Format pane: Visual tab (visual-specific) and General tab (title, size, background, border, tooltips, alt text).
- Formatting on a visual overrides the theme. Reset to default reverts it.
- fx makes titles and alt text dynamic.
Sticky note 3. “Random colors. Our brand is green and gold”
Ananya points to the third note, then to the green-and-gold logo on her notebook. “Why is our report purple?”
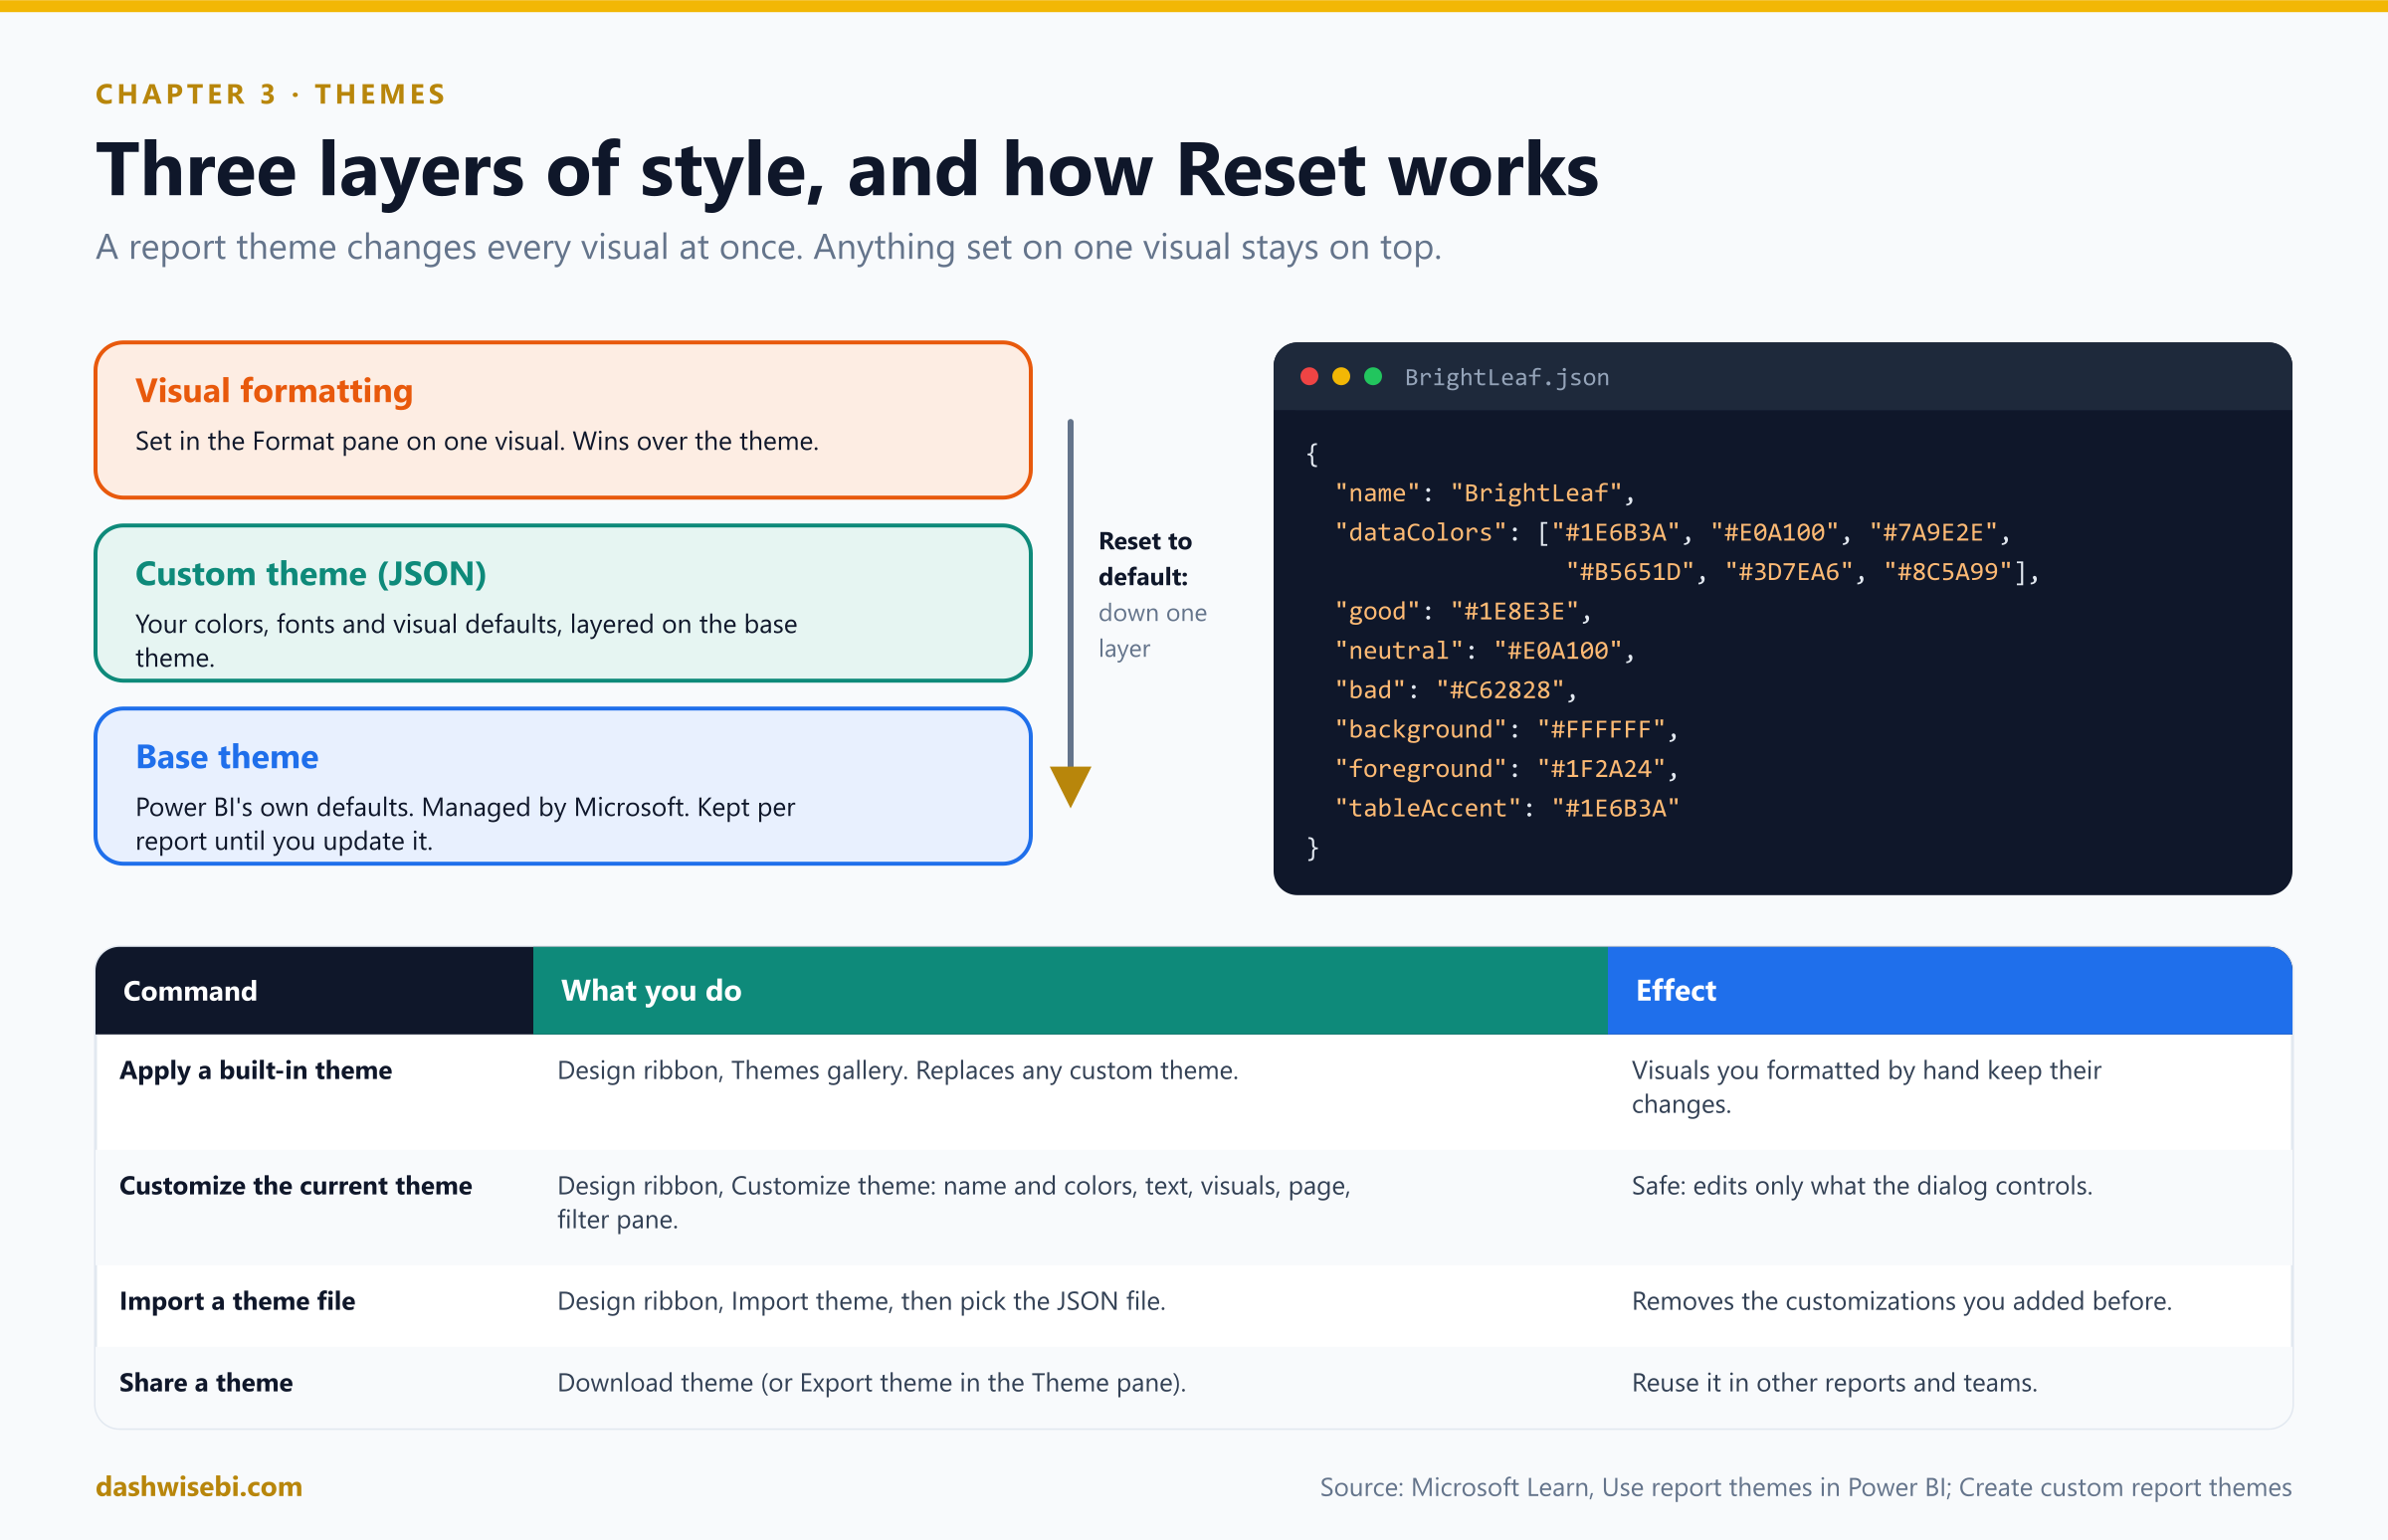
Do not recolor visuals one at a time. A report theme applies design changes to the entire report: colors, fonts and default visual formatting, for every visual at once.
Pause and decide. Where do you pick a built-in theme in Power BI Desktop, and where in the Power BI service?
In Desktop: the Design ribbon, then the Themes gallery. In the service: View, Theme. The commands Customize theme, Import theme and Download theme are on the Design ribbon in Desktop only. In the service, use the Theme pane.
Pause and decide. You want one theme for every BrightLeaf report. What do you do?
Build the theme once, download it as a JSON file (Design ribbon, Download theme, or Export theme in the Theme pane), and import it into the other reports. Your tenant admin can also publish organizational themes, which then appear in the Themes gallery.
Pause and decide. Which should you use for a data point: a color from the theme palette, or a color from More colors? Why?
A theme color. It is relative to the current theme, so when the theme changes, the visual updates by itself, like changing themes in Microsoft Office. A color from More colors is fixed and does not follow the theme.
Pause and decide. You apply the built-in Dark theme to work at night. What should you do before publishing?
Reset to default in the Themes gallery, to return the report to the default light theme. Microsoft notes that the Dark and Soft dark themes are meant as a comfortable canvas while you design.
Why: how themes work
Every report has a base theme that Microsoft manages. Power BI may update it in new releases, but your report keeps its original base theme until you update it. A custom theme layers on top and overrides or adds to any style or color. Formatting on an individual visual sits on top of both. Reset to default reverts a visual to the custom theme, and for anything the custom theme does not define, to the base theme.
A custom theme file is JSON, and only name is required. Everything else is optional, so add only what you want to control:
{
  "name": "BrightLeaf",
  "dataColors": ["#1E6B3A", "#E0A100", "#7A9E2E", "#B5651D", "#3D7EA6", "#8C5A99"],
  "good": "#1E8E3E",
  "neutral": "#E0A100",
  "bad": "#C62828",
  "background": "#FFFFFF",
  "foreground": "#1F2A24",
  "tableAccent": "#1E6B3A"
}dataColorsare the colors of the shapes that represent data. When all are used, Power BI generates more by adjusting saturation and hue.good,neutral,badare the status colors used by the waterfall chart and the KPI visual.maximum,center,minimum,nullset the gradient colors in the conditional formatting dialog.- Structural colors (
firstLevelElements,secondLevelElements,backgroundand so on) style text, gridlines and backgrounds. Text classes (callout,title,header,label) set fonts.visualStylessets defaults and named style presets per visual type. - A theme can set the default page size for new pages.
- Power BI validates an imported theme against a published JSON schema. Use it in an editor such as Visual Studio Code to see what you can set.
- You can also change the current theme without touching JSON: Customize theme covers name and colors, text, visuals, page and the Filters pane, and it only changes what the dialog controls.
- Applying a built-in theme or importing a theme file replaces the theme customizations you made before. Visuals you formatted by hand keep their formatting until you reset them.
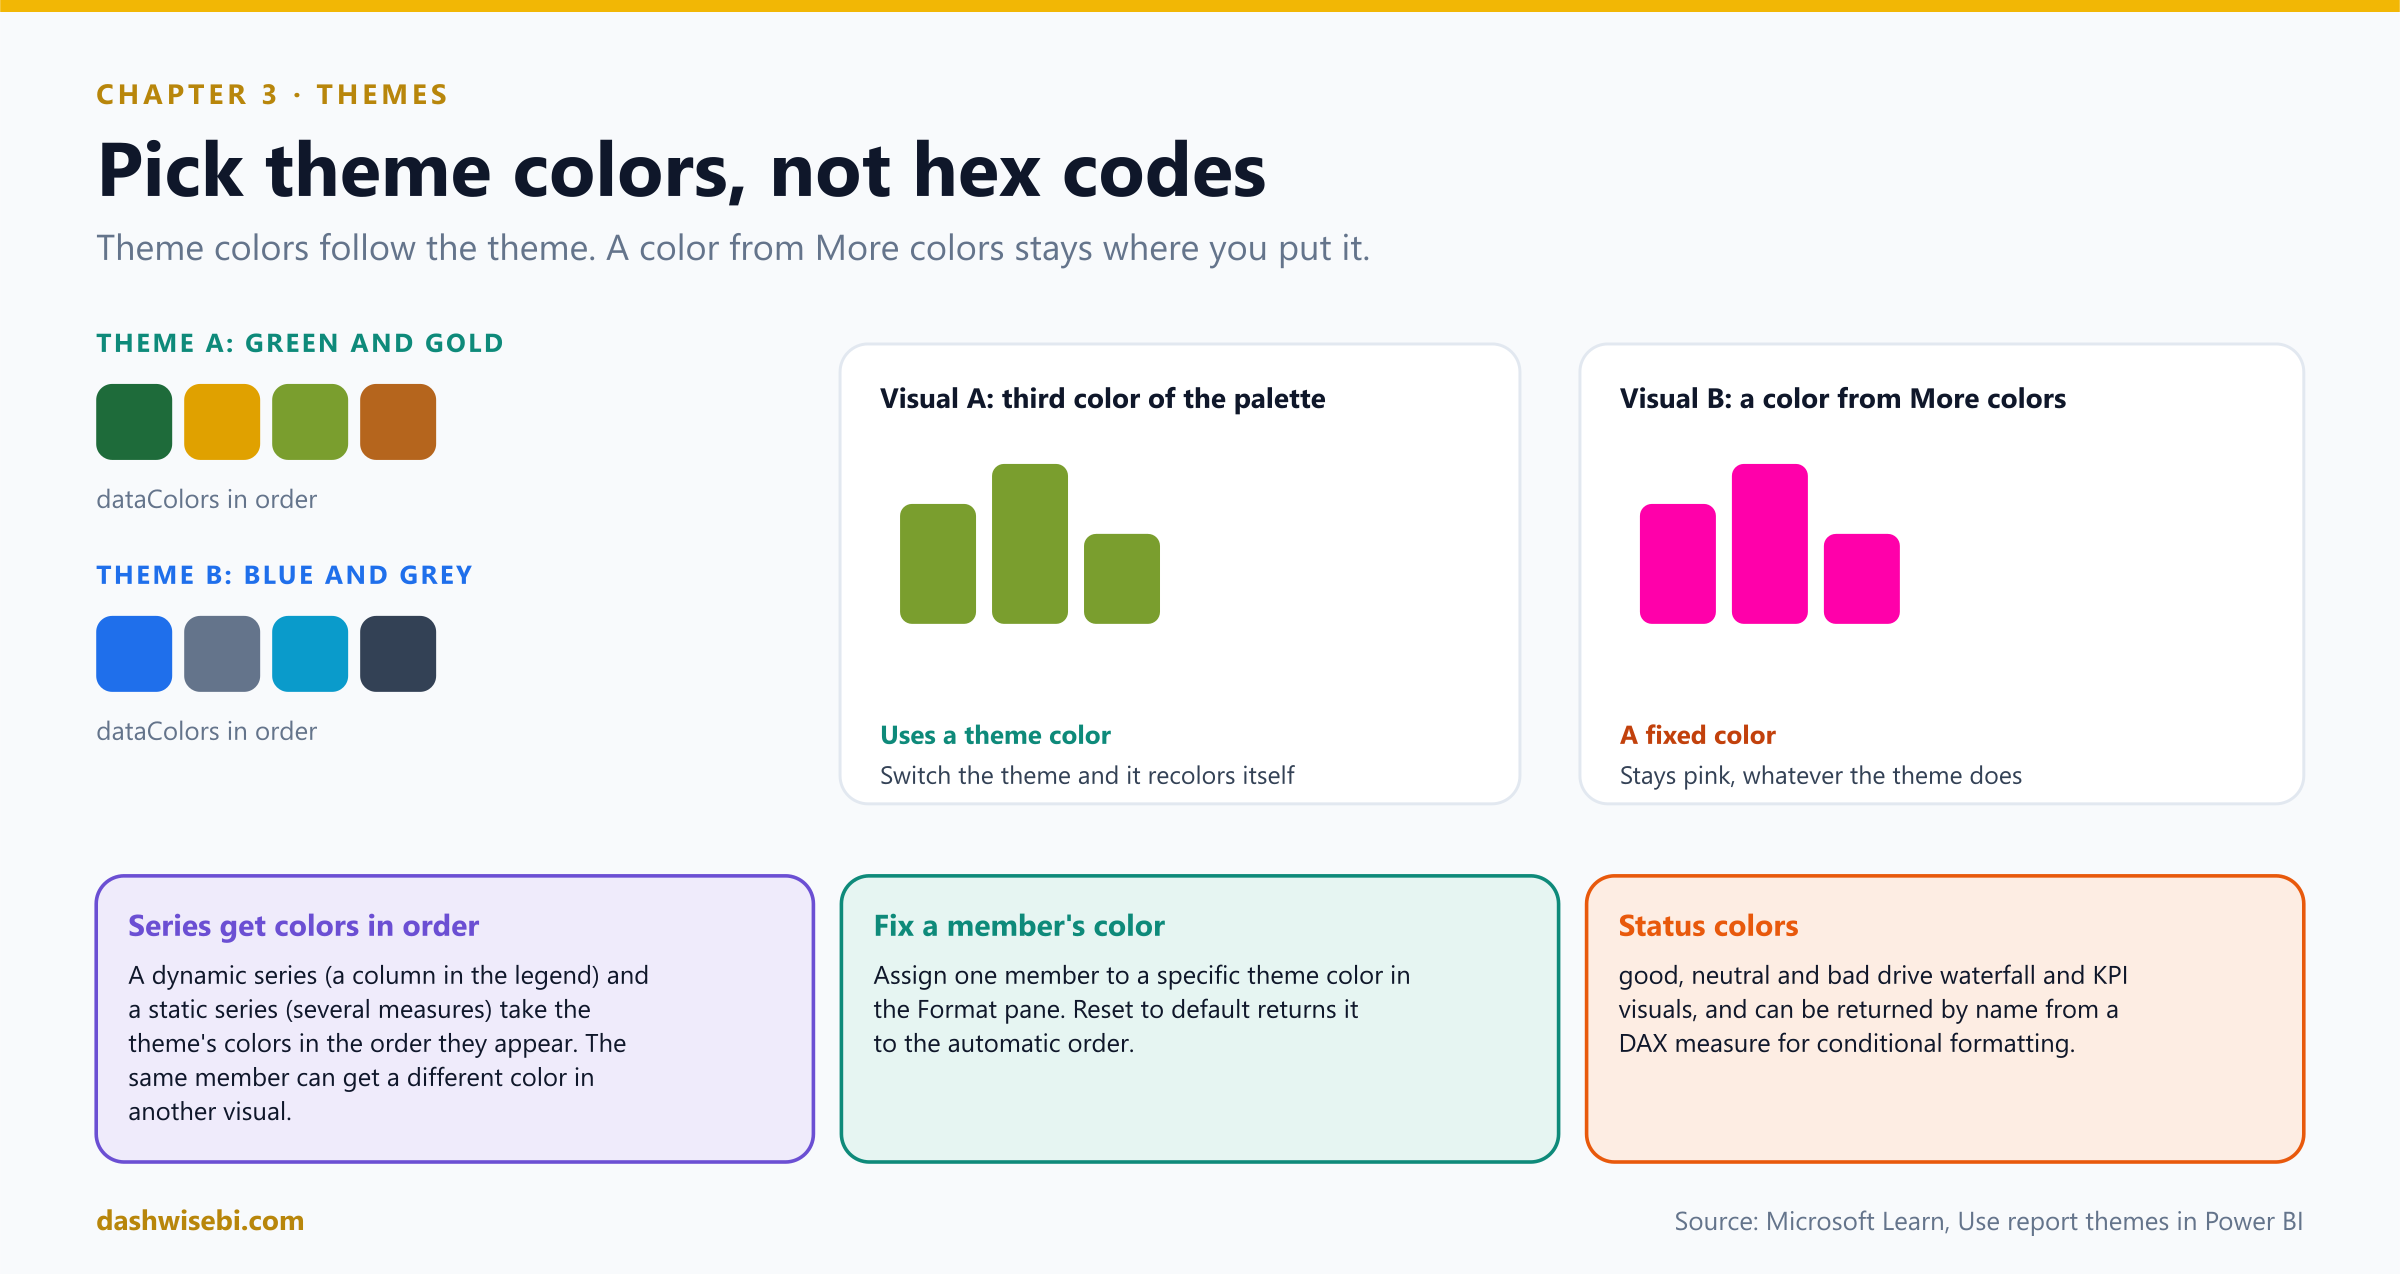
Series colors. When a visual has a series (a field in the legend, or several measures), colors are assigned in the order of the theme's data colors. In a dynamic series, a region can get a different color in another visual, because the order of the members differs. In a static series, Profit then Revenue in one visual and the reverse in another also swap colors. To pin one member to one color, set it in the Format pane.
Accessibility. Choose a color-blind friendly theme, and keep strong contrast between text and background. Do not rely on color alone for meaning (Chapter 4).
Exam lens
- Design ribbon, Themes: apply, Customize theme, Import theme (JSON), Download theme.
- The base theme, a custom theme on top, and visual formatting on top of both.
- Pick theme colors so visuals follow theme changes.
- Only
nameis required in the JSON.
Sticky note 4. “I cannot see which regions are behind target”
The fourth note is on a table with eleven regions and eleven numbers. “Which of these should worry me?” asks Ananya. “I have to read every one.”
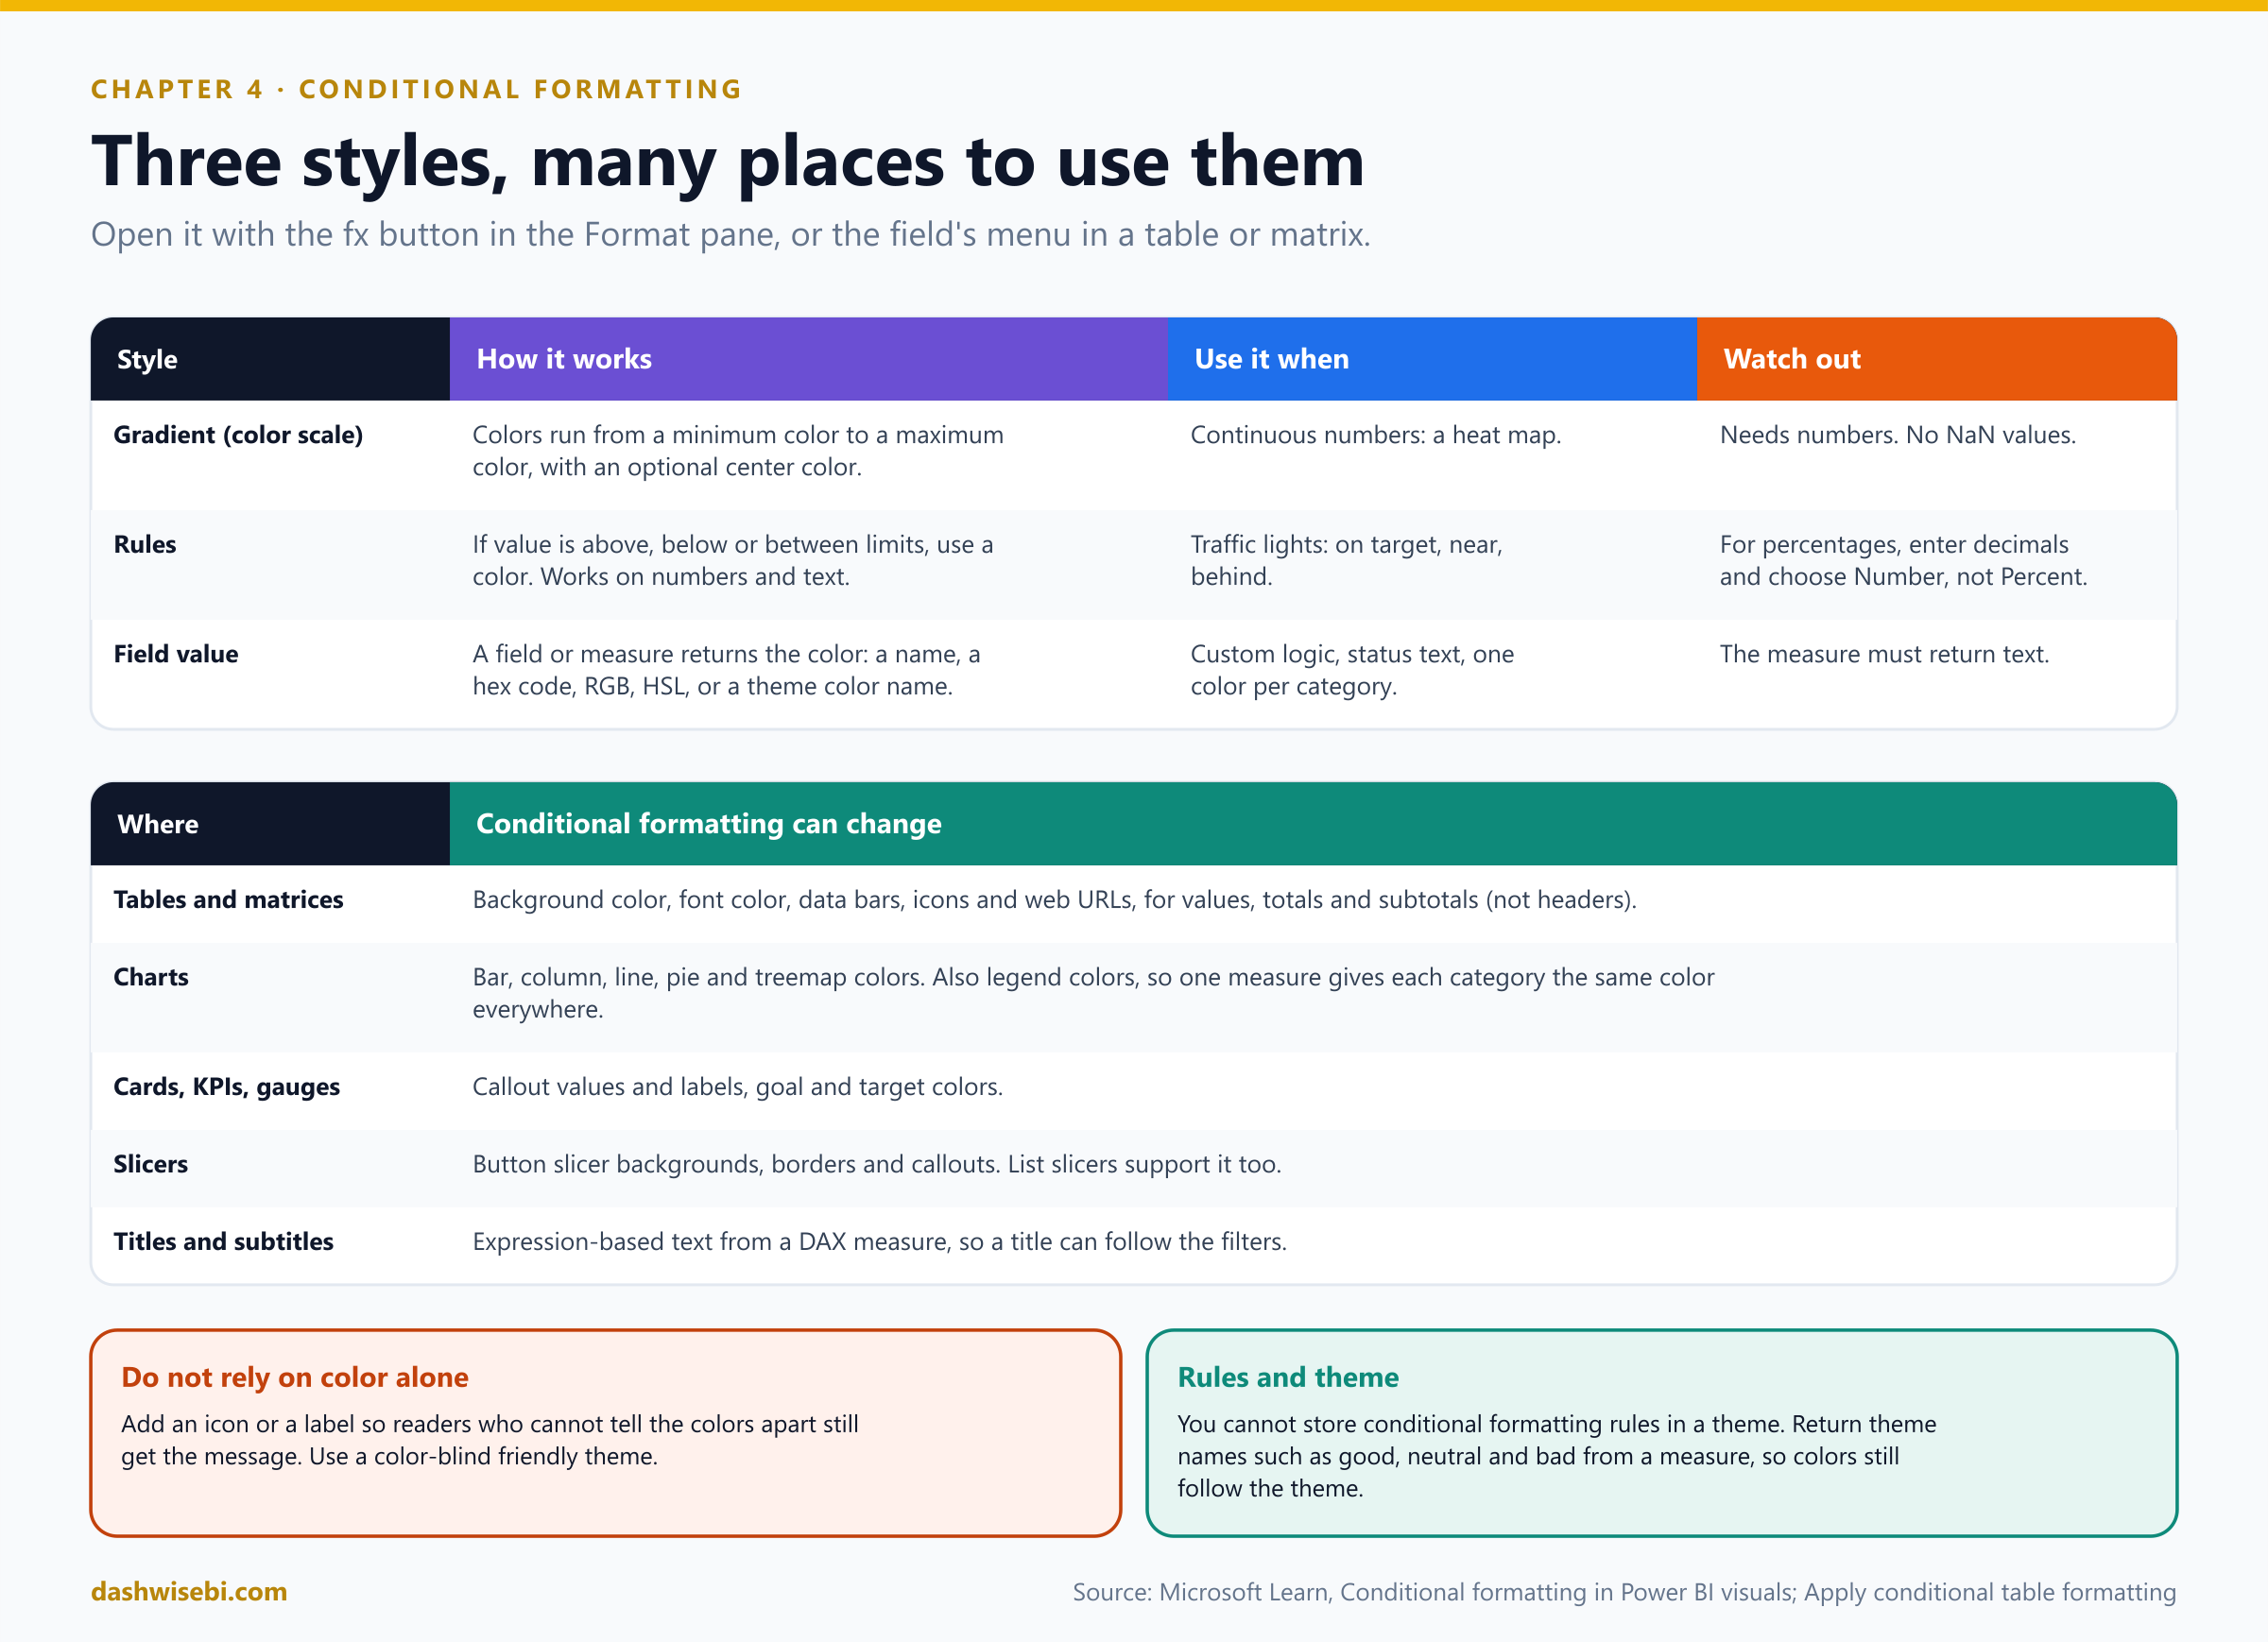
Conditional formatting lets the data drive the formatting. It highlights outliers, shows status and creates heat maps, so readers see the message before they read the numbers.
Pause and decide. The table has a Status column with the text values “Accepted”, “Declined” and “None”. You want them blue, red and grey. Can you color text values directly, as in Excel?
No. Create a measure that returns a color for each value, then use Field value as the format style and choose that measure:
StatusColor =
SWITCH (
    'Table'[Status],
    "Accepted", "blue",
    "Declined", "red",
    "None", "grey"
)
The measure must return text. After you add a calculation group (Episode 4), a measure can become a variant type, and then conditional formatting may stop working until the measure explicitly returns text.
Pause and decide. A % of target column holds values such as 0.82. You add rules: red below 0.8, amber from 0.8 to 1, green at 1 or above. In the rule dialog, what do you choose: Number or Percent?
Number, and enter the values as decimals (.8, 1). Choosing Percent sets the boundaries as a percentage of the range from the minimum to the maximum value, which gives unexpected results for a field that already holds percentages. Also cover negative values with a rule such as “less than 0”.
Pause and decide. You format the matrix so that cells are colored by value. Can you also color the row headers and column headers the same way?
No. In tables and matrices, conditional formatting applies to values, totals and subtotals, not to row or column headers. For matrices, Values refers to the lowest visible level of the hierarchy.
Pause and decide. The BrightLeaf theme defines good, neutral and bad. How can a status measure keep following the theme if the brand colors change?
Return the theme color names from the measure instead of hex codes, with Field value:
Status Color =
VAR CurrentStatus = [Status Score]
RETURN
    SWITCH (
        TRUE (),
        CurrentStatus >= 80, "good",
        CurrentStatus >= 50, "neutral",
        "bad"
    )
You cannot store conditional formatting rules inside a theme, but you can reference its named colors.
Why: how to apply it
- Where to find it. For most visuals, select the fx button next to a color or formatting option in the Format pane. For a table or matrix, right-click or use the arrow next to the field in the Visualizations pane, then choose Conditional formatting.
- Background color and Font color. They have the same options. You can give a field a background and a font color from the same rule, but if both are the same color the text disappears.
- Gradient (color scale). Pick the field to base it on, the summarization, how to format empty values, and the minimum and maximum (lowest and highest value, or custom numbers). Add a middle color for a diverging scale.
- Rules. Each rule has an if value condition, an and condition and a color. Rules work on numbers and on text.
- Field value. The field or measure can return a color name (
Green), a hex code (#3E4AFF), RGB or RGBA, or HSL or HSLA. - Data bars draw a bar in the cell whose length follows the value. Show bar only hides the number. You can set minimum, maximum, colors, direction and axis color.
- Icons use rules or a field value. Choose the layout (left, right, icon only) and a set: directional arrows, shapes such as traffic lights, indicators such as flags and checkmarks, or ratings such as stars. A field of image URLs (BMP, JPG, JPEG, GIF, PNG or SVG) gives custom icons.
- Web URL turns a field into live links.
- Charts. Bars, columns, lines, pie slices and treemap rectangles can be colored by gradient, rules or field value. With a legend, one measure can give each category the same color in every visual (for example
SWITCH ( SELECTEDVALUE ( financials[Segment] ), ... )), and you change a category color once. - Cards, KPIs, gauges, button slicers and titles support it too, including expression-based titles and subtitles.
- Gotchas. Gradients and percent rules fail if the data contains NaN, which comes from dividing by zero: use
DIVIDE. Conditional formatting needs an aggregation or measure. To print colors and data bars, enable Background graphics in the browser print settings. - Accessibility. Add an icon or a label to the color, so the message survives for readers who cannot tell the colors apart.
Three regions glow red. Ananya circles them with a pen, and you realize with some satisfaction that she did not need to read a single number.
Exam lens
- Three styles: Gradient, Rules, Field value. Table options: background, font, data bars, icons, web URL.
- Color from text needs a measure and Field value.
- Percent field with rules: decimals and Number.
- Not available on headers.
Sticky note 5. “Nine slicers take up the whole page, and one page forgets my choices”
Note five is stuck over a wall of dropdowns. Ananya sighs. “I choose North on page one, and page two shows everything again.”
There are two tools for narrowing data: slicers on the canvas, and the Filters pane.
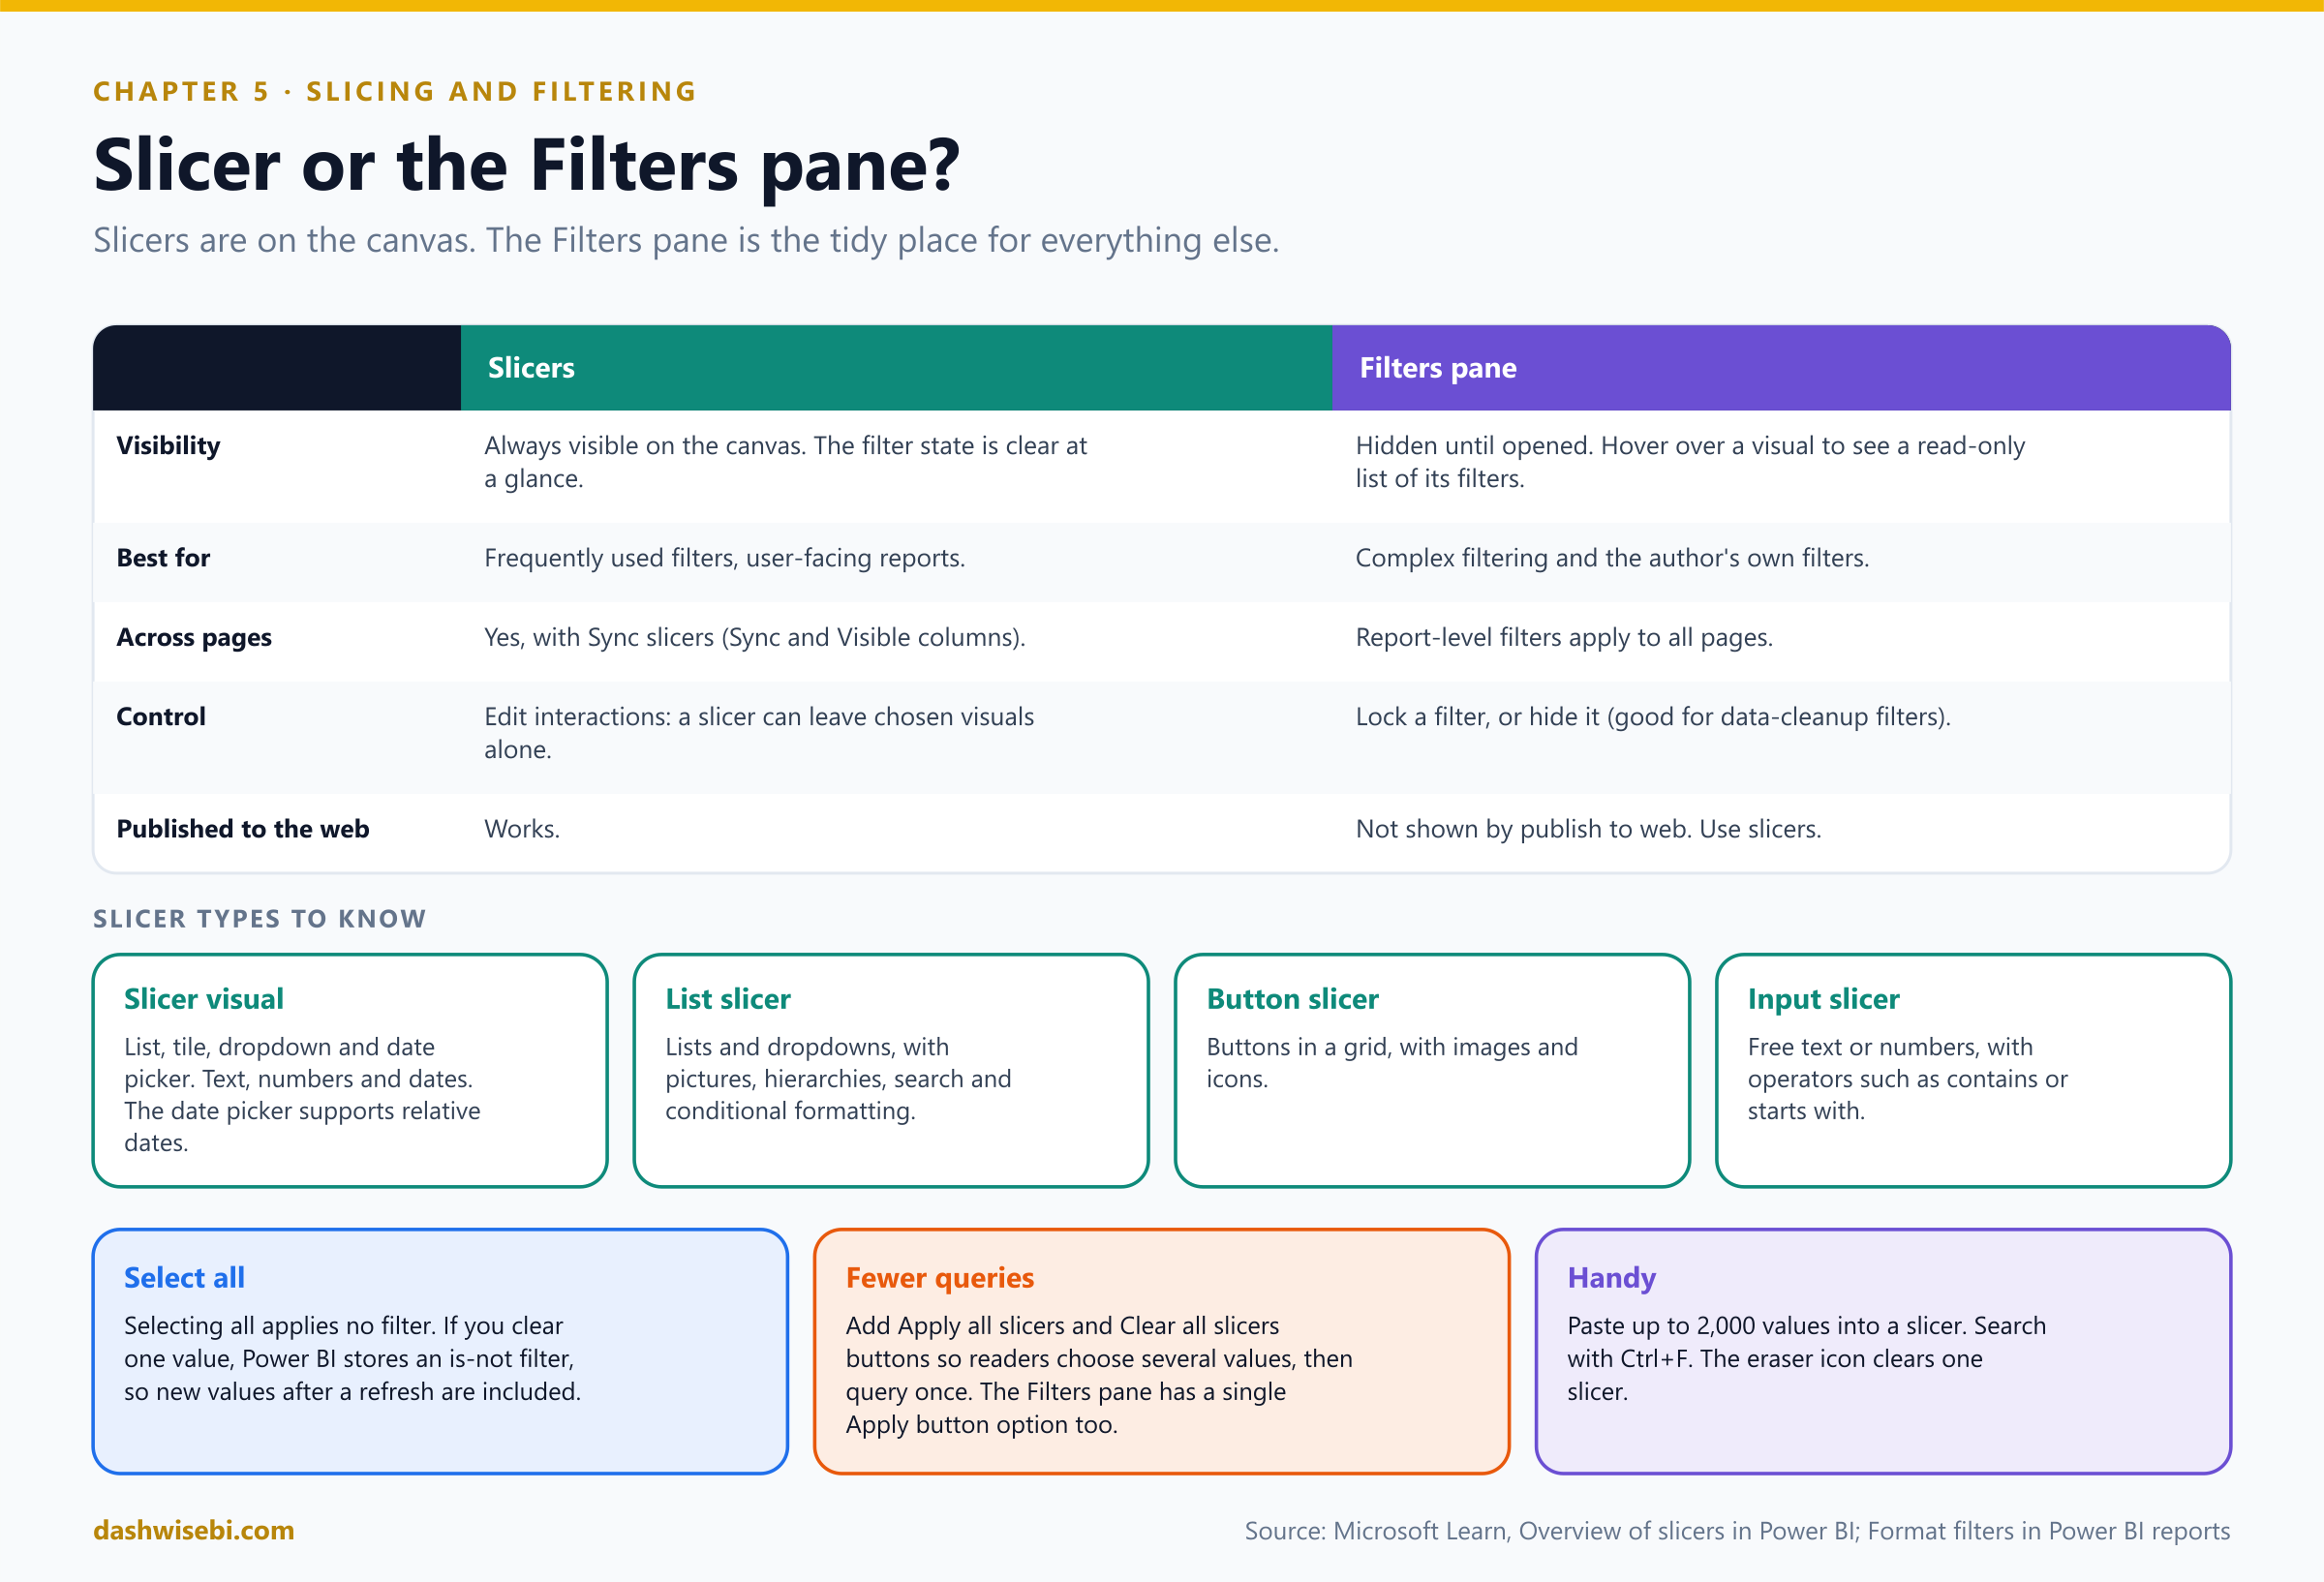
Pause and decide. Region is chosen constantly by readers. A filter that removes blank order rows is just data cleanup. Where does each one go?
Region: a slicer, so the current choice is visible at a glance. The blank-row filter: the Filters pane, as a hidden filter (readers do not need to see data cleanup filters). You can also lock a filter so readers see it but cannot change it.
Pause and decide. Readers pick Region on page 1, and page 2 ignores it. What do you set up?
Sync slicers: on the View ribbon select Sync slicers, select the slicer, and in the Sync column choose the pages where the selection applies and in the Visible column the pages where the slicer appears. A slicer synced to a page but not shown there still filters that page. You can also sync separate slicers by giving them the same group name.
Pause and decide. A table lists 100 million order lines before anyone chooses anything, and the page crawls. What is the cheapest filter fix?
A Top N filter on the visual, set well above what anybody could read (say 10,000). The experience hardly changes, but memory use drops and speed improves.
Pause and decide. The Region slicer should filter every visual, except a card that always shows the national total. How?
Edit interactions: select the slicer, choose Edit interactions on the Format menu, and set None on the card. By default, slicers filter all other visuals on the page, including other slicers.
Why: slicers
- The types. The Slicer visual (list, tile, dropdown and date picker, for text, numbers and dates), the List slicer (lists and dropdowns, pictures, hierarchies, search, conditional formatting), the Button slicer (buttons with images and icons) and the Input slicer (free text or numbers with operators such as contains).
- Relative dates. The date picker supports relative selections that roll forward: pick “last full month” once, and it recalculates every time the report loads. Relative date and relative time slicers exist for this.
- Select all. It adds an item to a multi-select slicer. Selecting it gives the same result as clearing all selections: no filter. If you then clear one value, Power BI stores an is not filter for that value. Values added by a later refresh are therefore included.
- Apply all and Clear all slicers buttons (Insert, Buttons) let readers set several slicers, then apply once, which avoids a query after each click. Clear all slicers resets the page.
- Paste and search. Paste up to 2,000 values from Excel into a slicer (exact match only). Search with Ctrl+F or from the menu.
- Field parameters create a slicer that lets readers switch which measures or dimensions a visual shows.
- Slicers filter hidden columns, so you can slice by a field that is not in any visual.
Why: the Filters pane
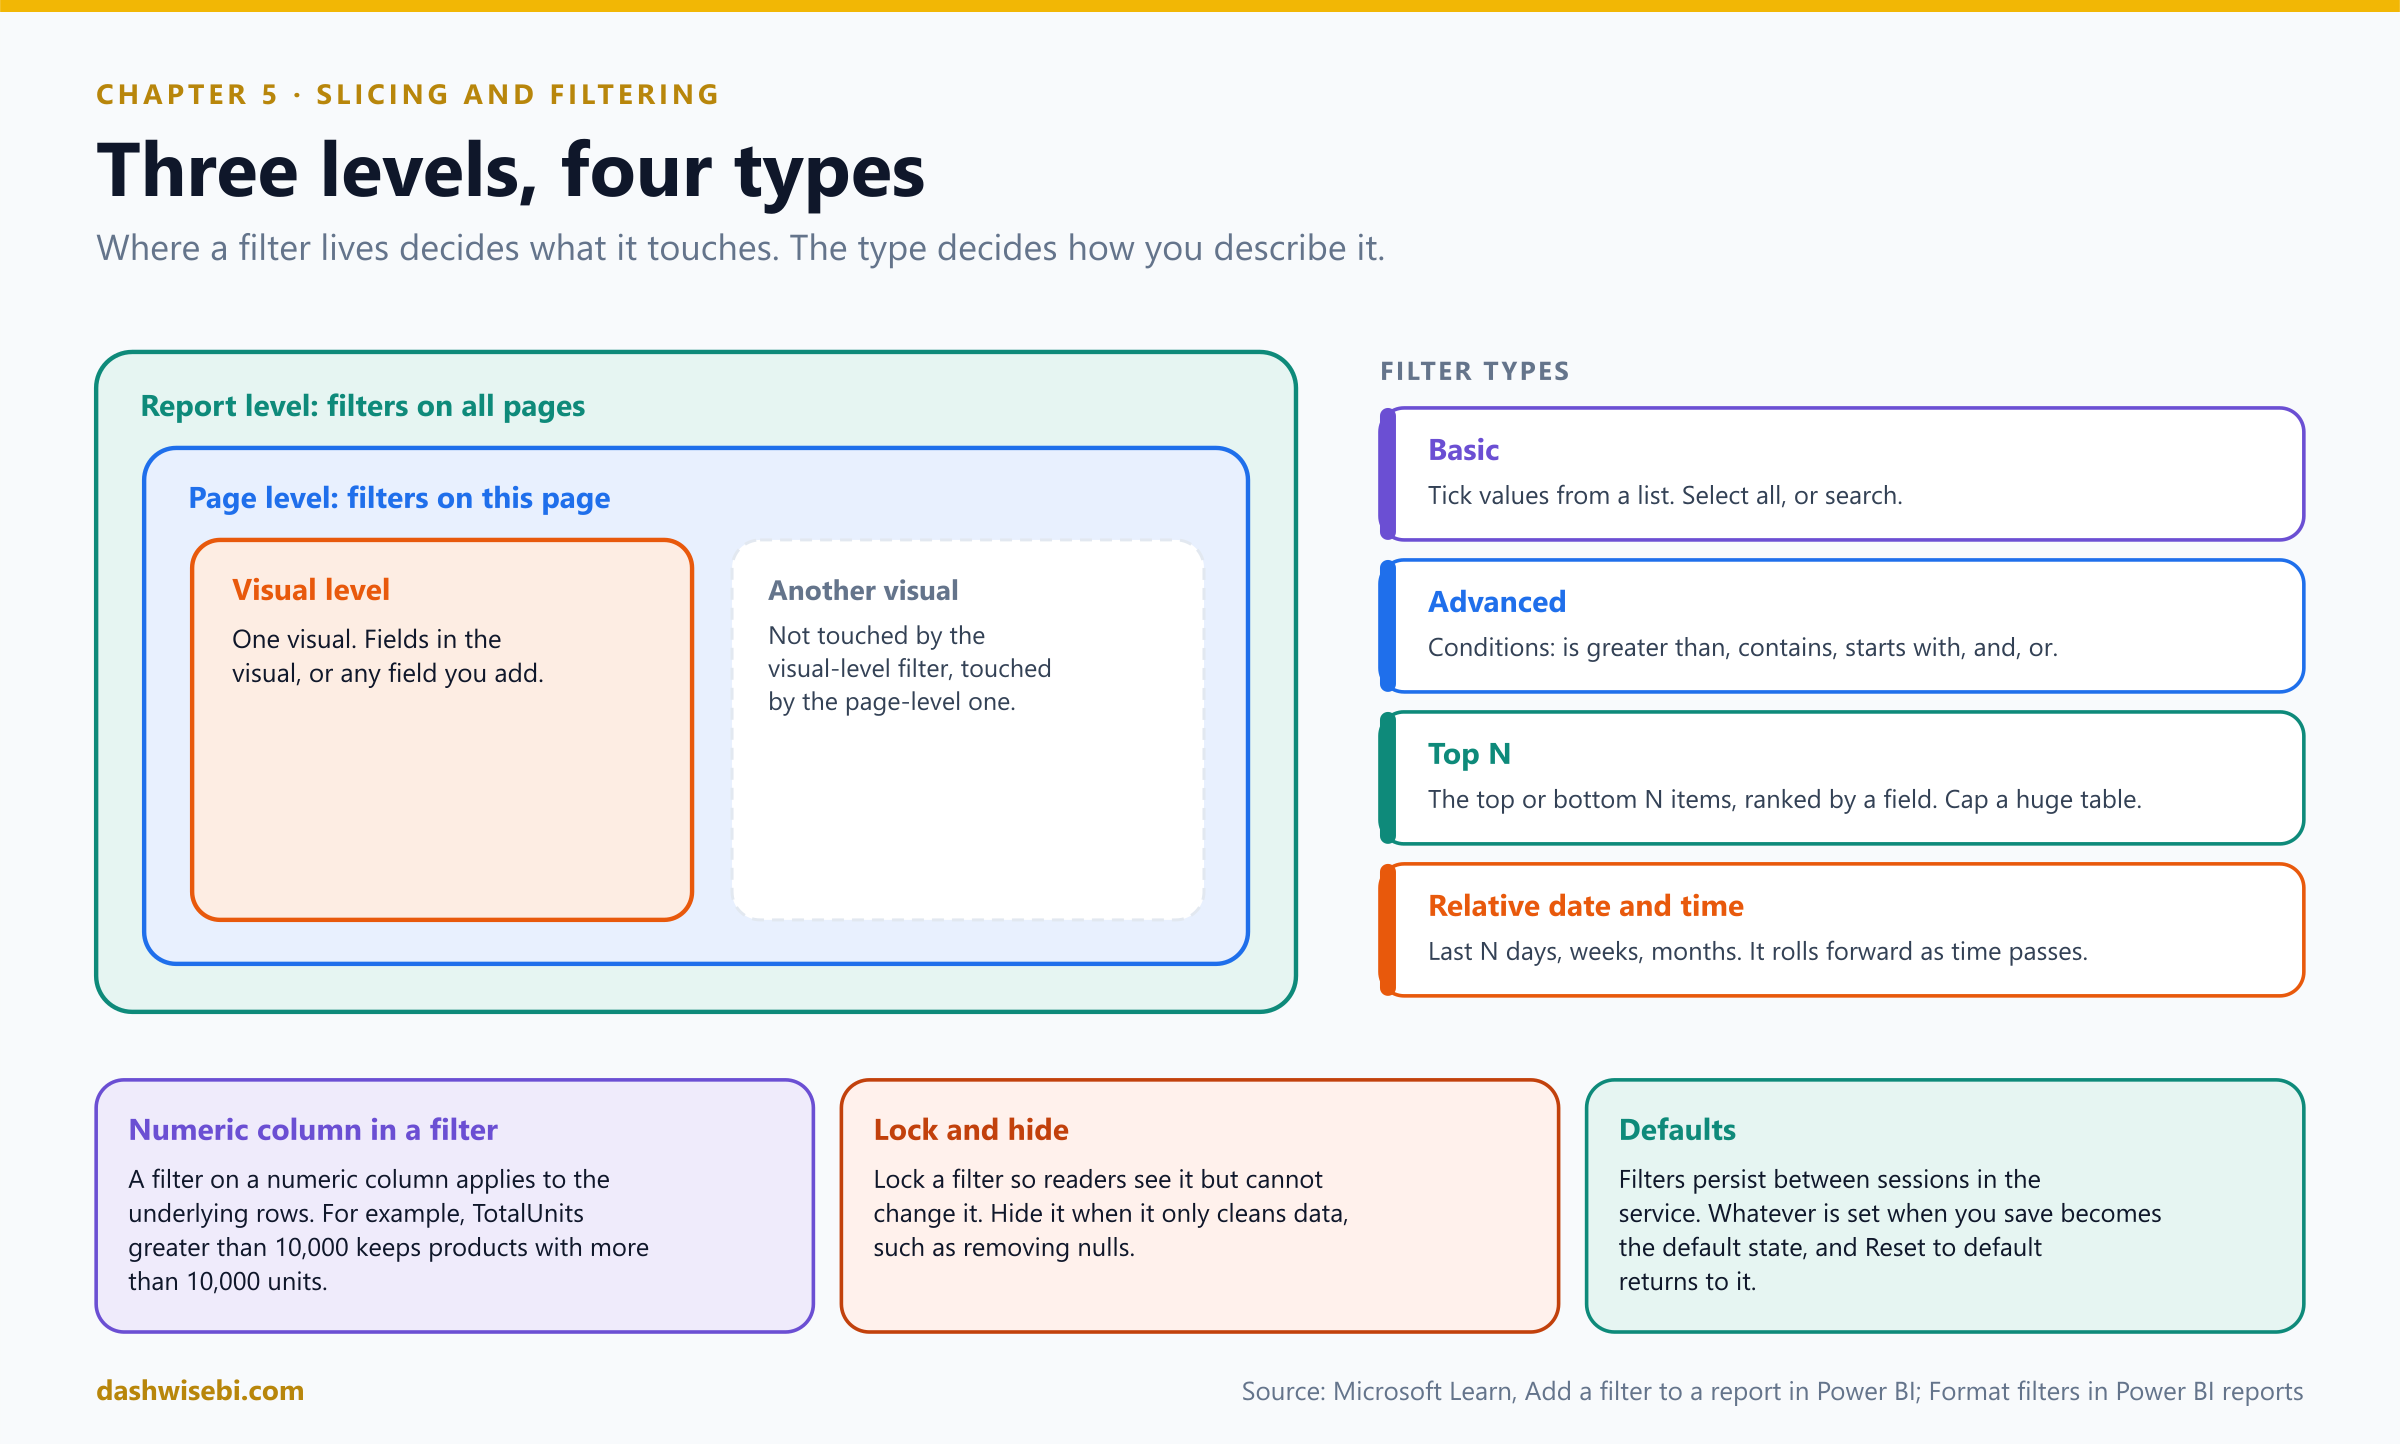
- Three levels. Visual (filters on this visual: its fields, plus any field you drag in), page (filters on this page) and report (filters on all pages). Drag a field from the Data pane into the bucket you want.
- Filter types. Basic (tick values), Advanced (conditions such as is greater than or contains, combined with and, or), Top N, and relative date and relative time.
- A numeric column dragged in as a visual-level filter filters the underlying rows. For example, TotalUnits is greater than 10,000 keeps only products that sold more than 10,000 units.
- Control what readers see. Hide the whole pane with the eye icon, lock or hide single filters, rename filter cards, reorder them by dragging, and decide whether the pane starts open or collapsed. Its state can be saved in bookmarks.
- Format it. Under Format, the Filters pane and Filter cards have colors, borders and fonts, and the applied and available cards can look different so applied filters stand out. Themes can set these defaults too.
- Persistence. In the service, readers' filter changes persist between sessions. Whatever is set when you save becomes the default state, and Reset to default returns to it. You can stop readers saving filters in the report settings.
- Apply button. In Desktop you can add a single Apply button to the Filters pane (Options, Query reduction), so changes are applied together.
- Publish to web does not show the Filters pane. Use slicers there.
The nine slicers become three, plus a button that says Clear all. The Region choice now follows Ananya from page to page.
Exam lens
- Slicer: visible, on-canvas, syncable. Filters pane: author filters, with visual, page and report levels. Lock or hide filters there.
- Sync slicers for several pages. Edit interactions to exclude visuals.
- Top N to cap a big table. Relative date for rolling periods.
Sticky note 6. “On the projector it looks tiny, and on a phone it is unreadable”
The sixth note is on the corner of the printout. “The board meeting is on the big screen next week,” says Ananya. “And half my team reads reports on their phones.”
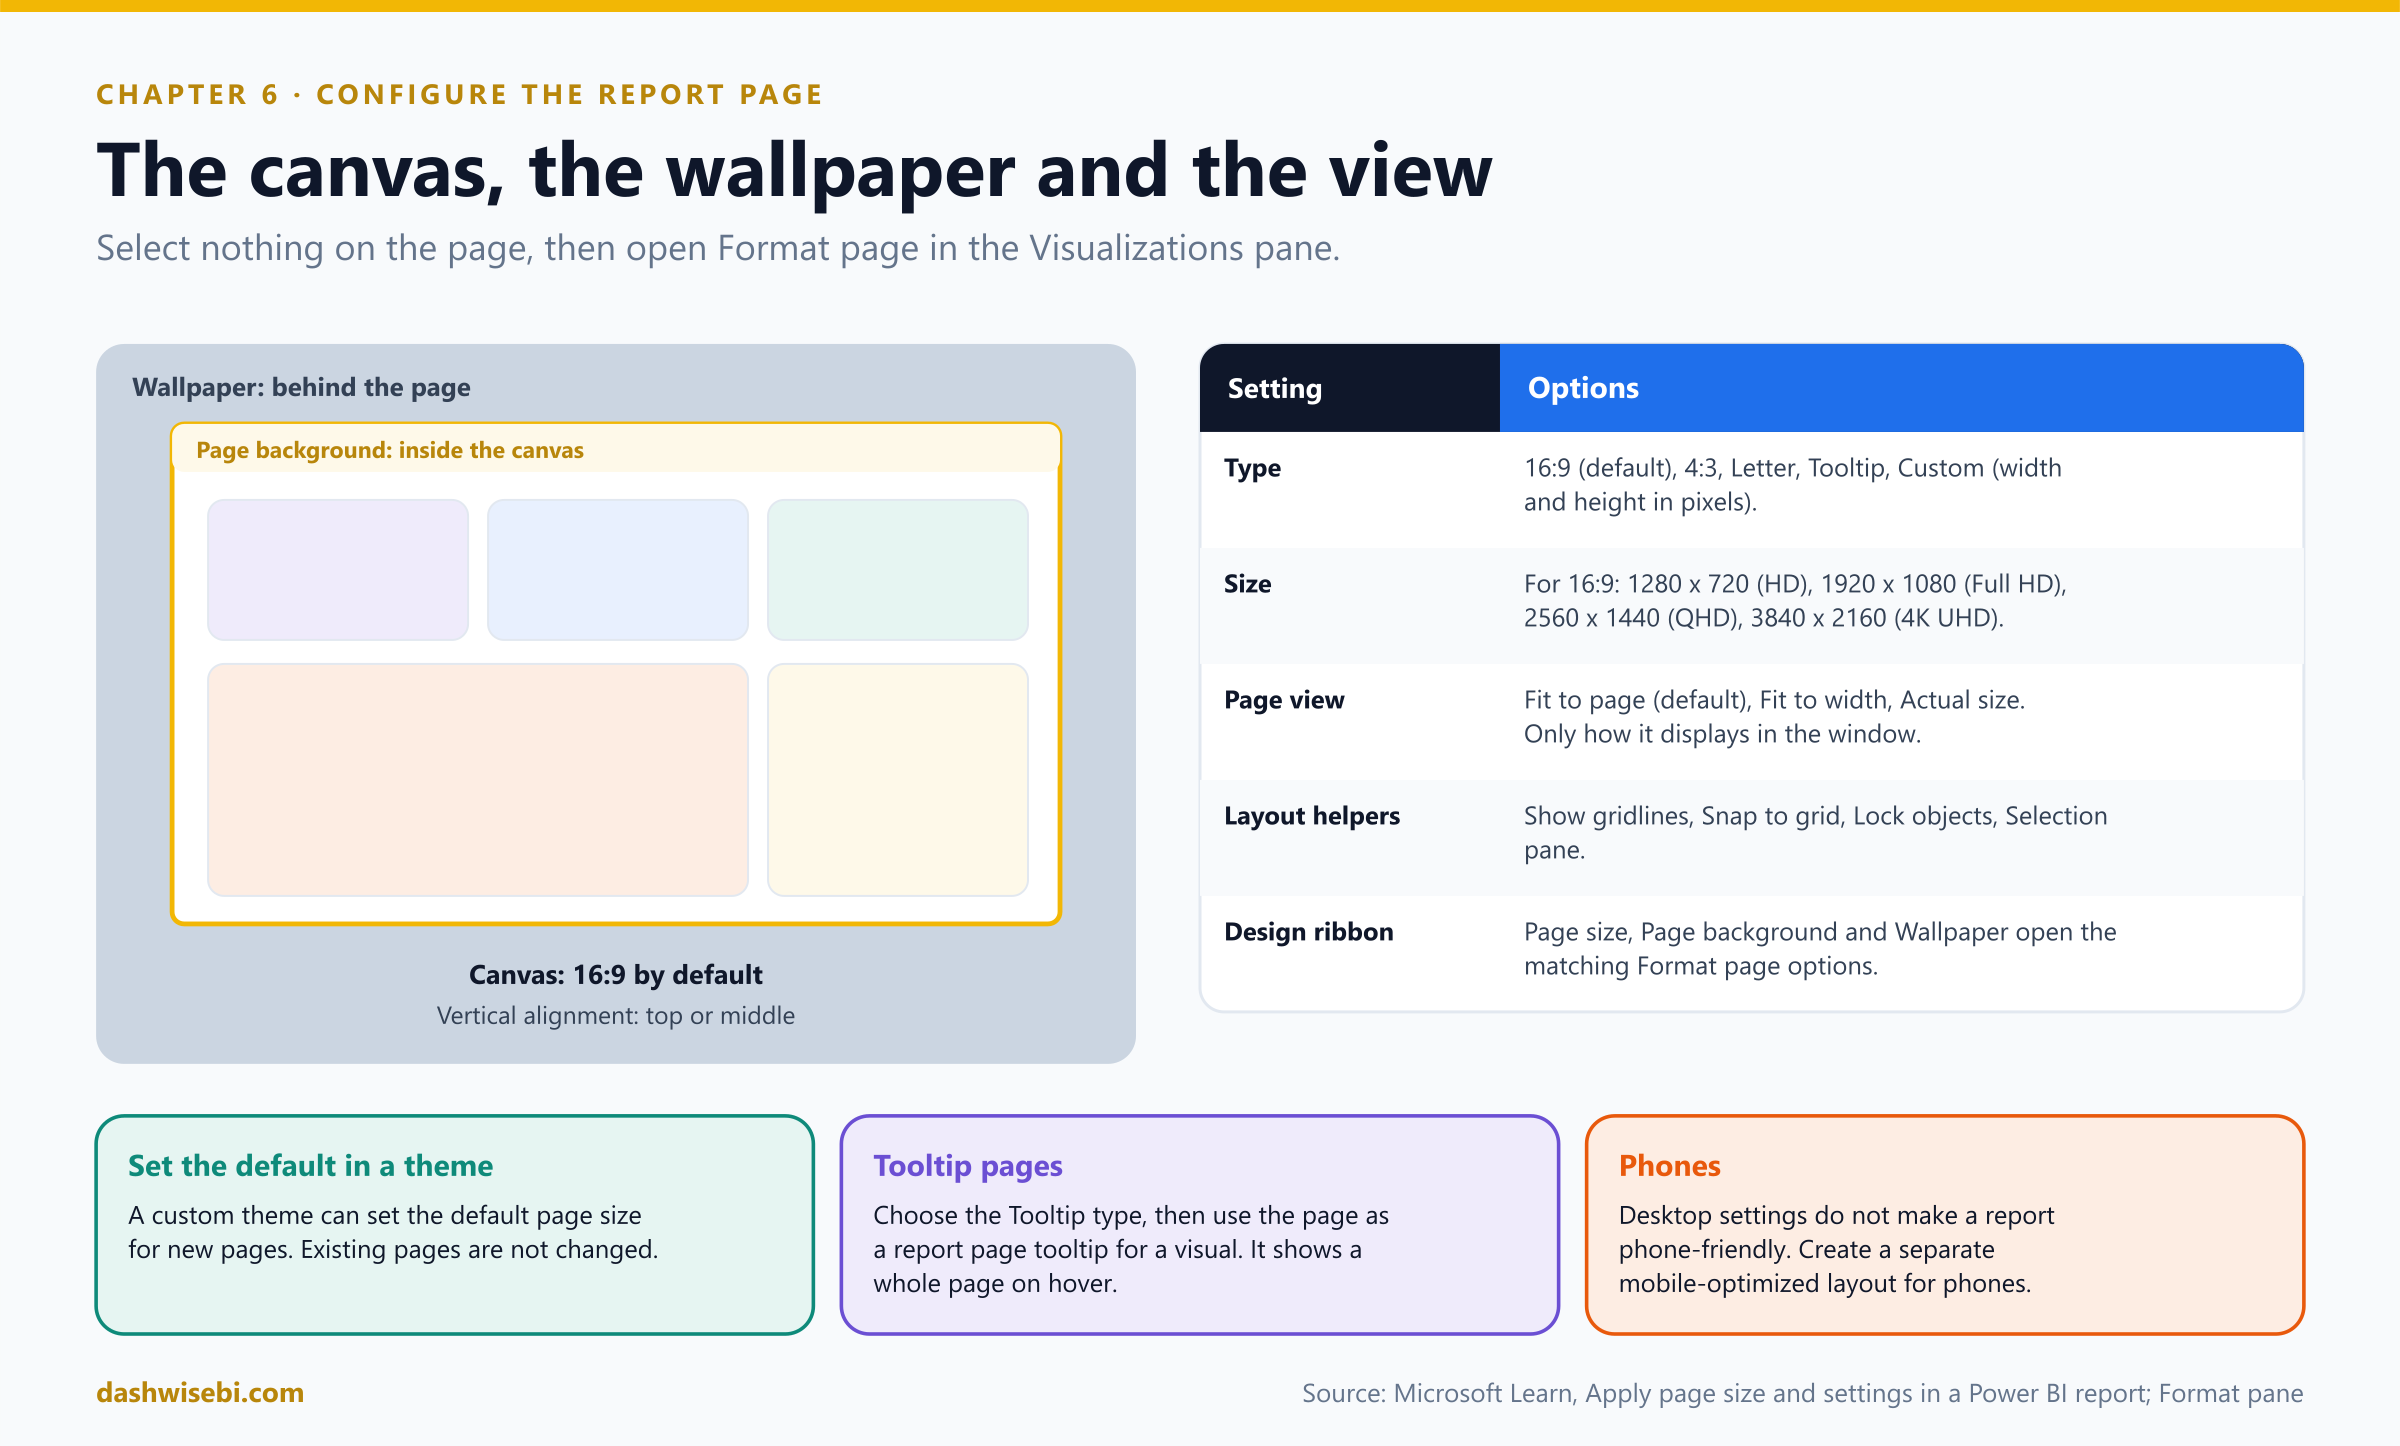
A report page is a canvas. Its size and the way it fits the window decide how every visual looks. With nothing selected on the page, the Visualizations pane shows Format page, and Canvas settings controls the aspect ratio, dimensions and vertical alignment.
Pause and decide. The report will be shown on a 1920 x 1080 board-room screen. What do you set?
In Canvas settings, keep Type at 16:9 and choose the Size 1920 x 1080 (Full HD). The other 16:9 sizes are 1280 x 720 (HD), 2560 x 1440 (QHD) and 3840 x 2160 (4K UHD). For any other shape use Custom and enter pixels.
Pause and decide. A teammate changes Page view to Fit to width and says the page size is now different. Is that right?
No. Page view only controls how the page displays in the window or browser: Fit to page (default), Fit to width or Actual size. The page dimensions come from Canvas settings.
Pause and decide. You want an off-white color behind the whole report area, and a white sheet for the visuals. Which two settings?
Wallpaper is the area behind the page. Page background is the canvas itself. On the Design ribbon, Page size, Page background and Wallpaper open the matching options.
Pause and decide. Does choosing a nice desktop layout also make the report usable on a phone?
No. The desktop layout settings are separate. For phones, create a mobile-optimized layout (View ribbon, phone layout).
Why: configure for the room, not the monitor
- Canvas type: 16:9 (default), 4:3, Letter, Tooltip or Custom. Letter uses letter-page dimensions. Tooltip is sized for report page tooltips.
- Vertical alignment: Top, or Middle to center the page.
- Layout helpers on the View tab: Show gridlines, Snap to grid (to align objects precisely), Lock objects (so nothing moves by accident) and the Selection pane, which lists every object and lets you show or hide each one.
- Defaults: a custom theme can set the default page size for new pages. Existing pages are not changed.
- Report page tooltips: create a page, set its type to Tooltip, then on a visual set Tooltips, Type, Report page. The page appears when a reader hovers over a data point.
Exam lens
- Canvas settings: Type (16:9, 4:3, Letter, Tooltip, Custom), Size, Vertical alignment. Page view (Fit to page, Fit to width, Actual size) is about display only.
- Wallpaper versus page background. Gridlines, snap to grid, lock objects, Selection pane for layout.
- Phones need a mobile layout.
Sticky note 7. “Finance wants invoices, printed, with page numbers and headers”
The last note is the one you were afraid of. Dev from finance has joined the call. “Every month I need 400 invoices as a PDF. Each is two pages. Headers, footers, page numbers. Can the Power BI report do that?”
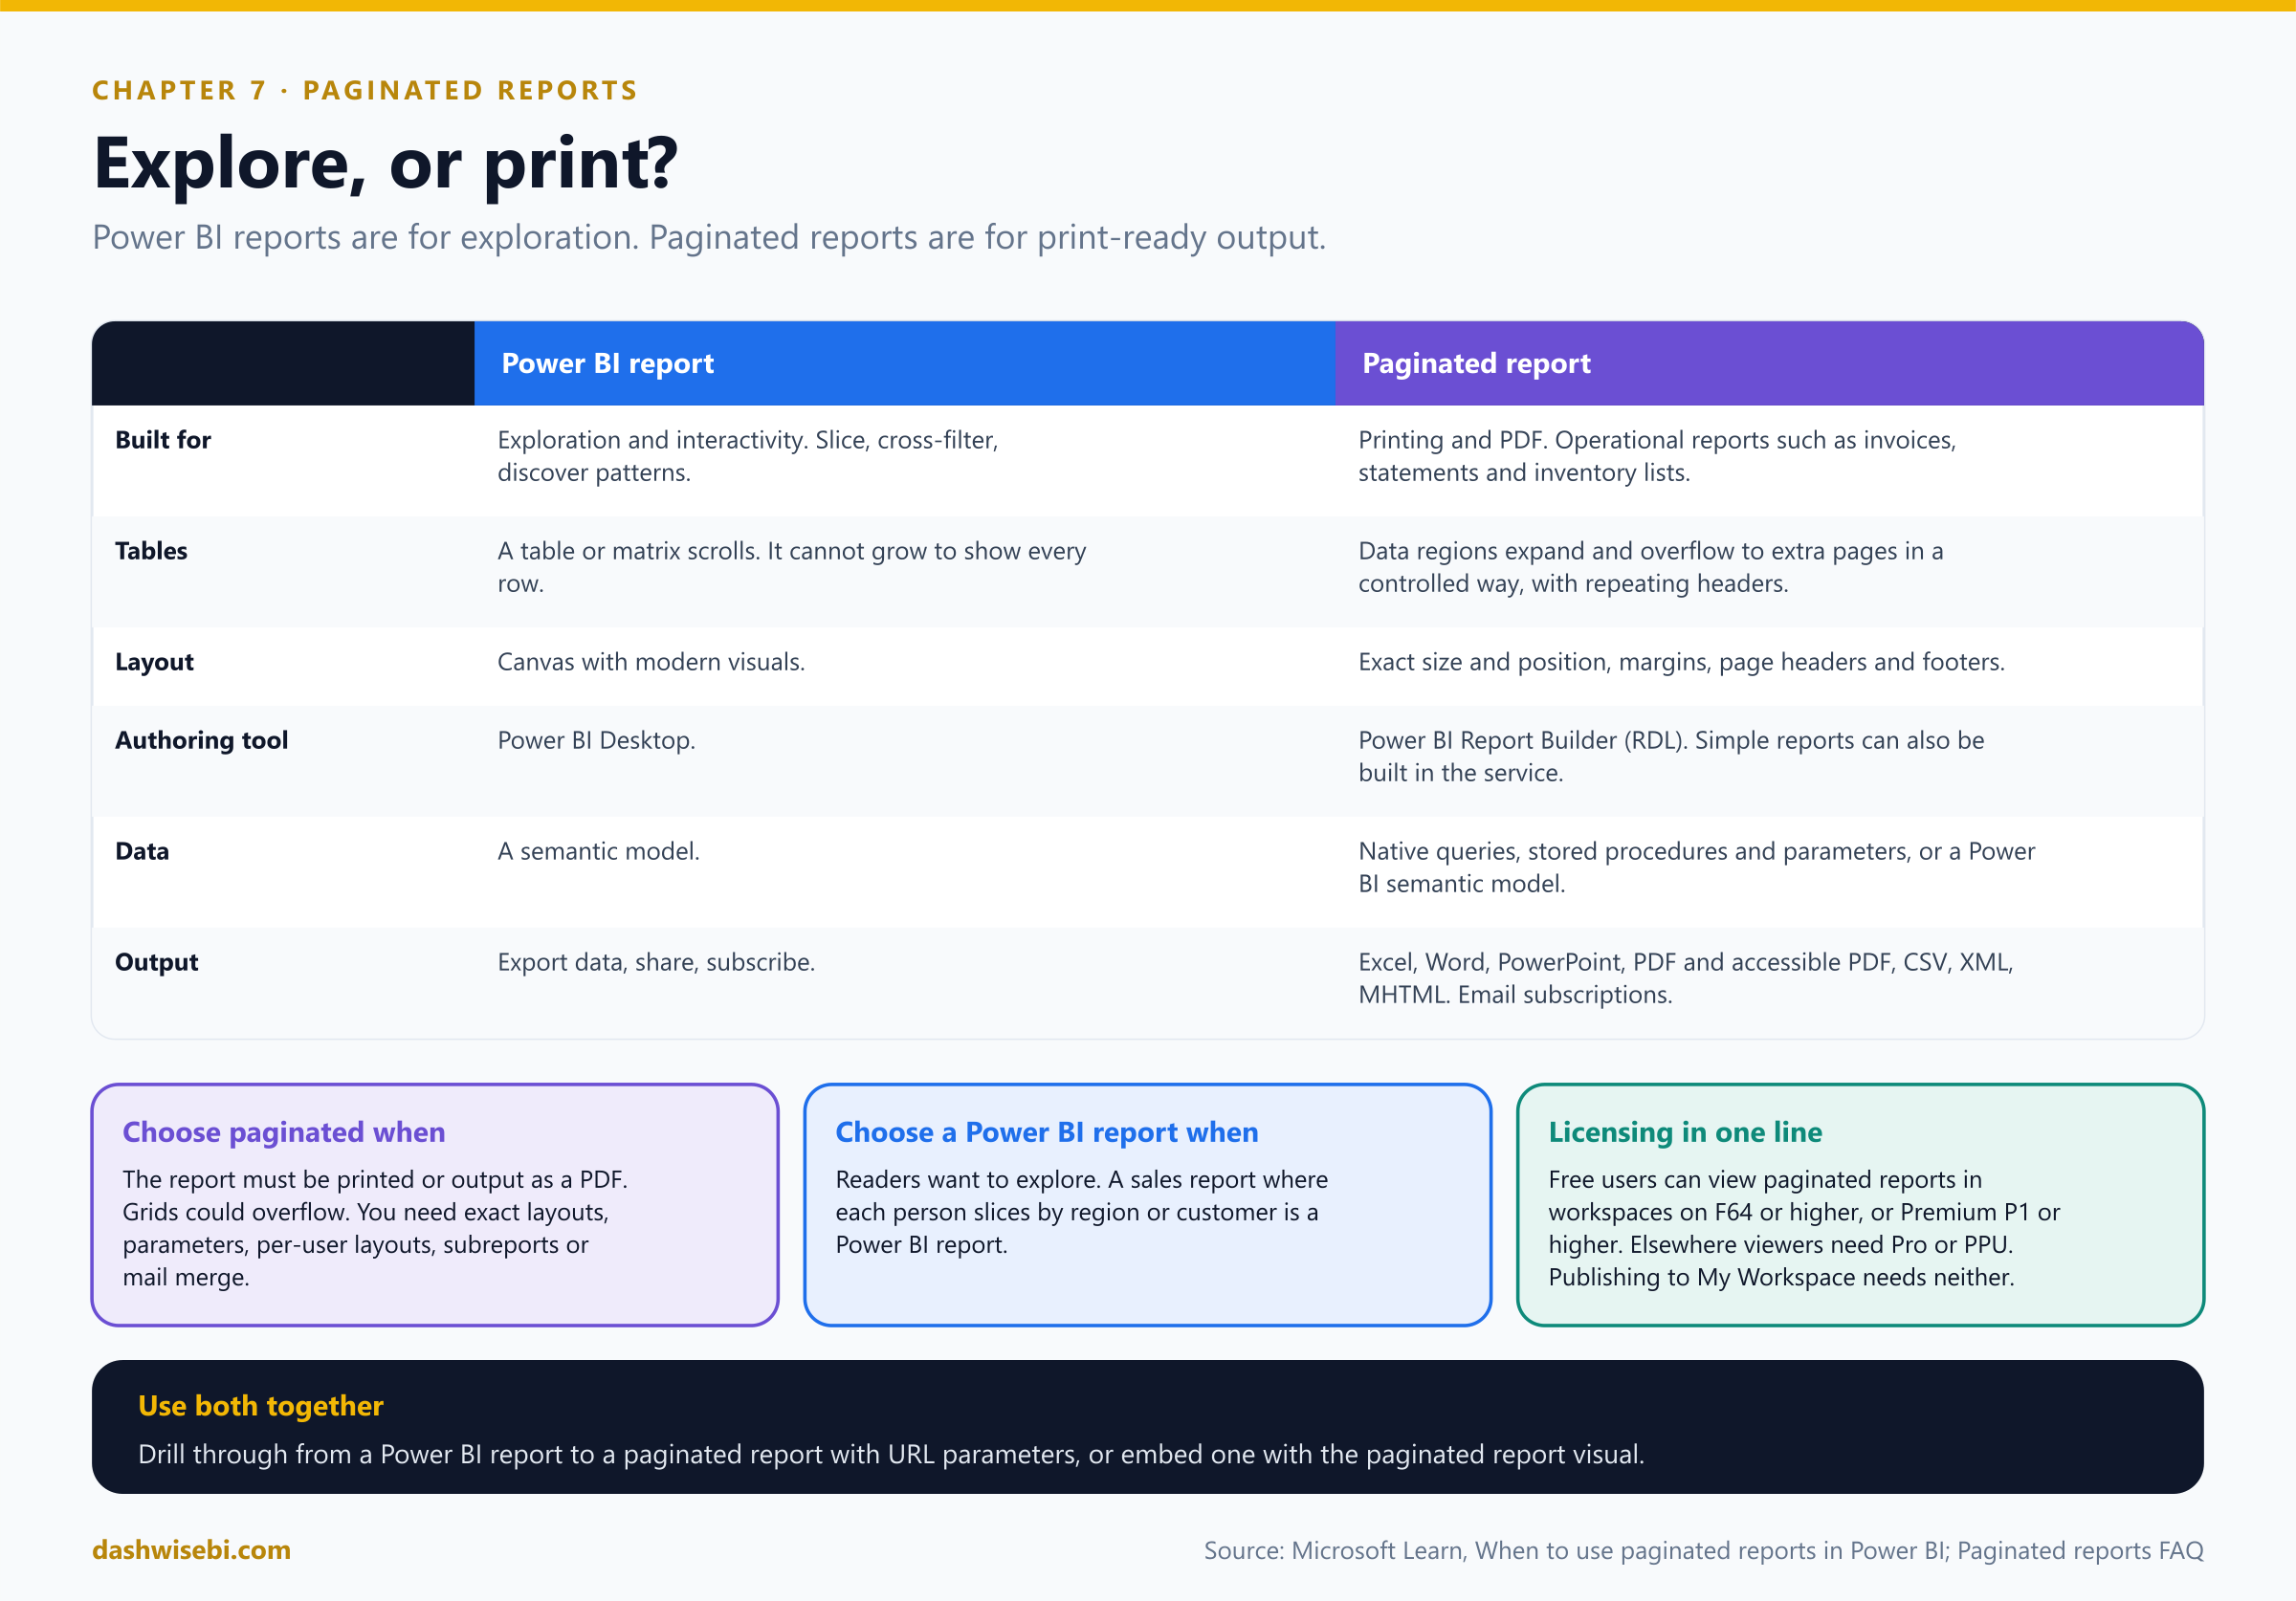
It can try. But this is exactly where a Power BI report is the wrong tool. Power BI reports are optimized for exploration and interactivity. Paginated reports are optimized for printing and PDF generation, with highly formatted, print-ready layouts. That is why they suit operational reports such as sales invoices, financial statements and inventory lists.
Pause and decide. The sales director wants each salesperson to slice the numbers by region, industry and customer in the same report. Power BI report, or paginated?
A Power BI report. Interactive exploration is what it is built for.
Pause and decide. A report table has 3,000 rows and must print on paper with the headings repeated on every page. Which tool?
A paginated report. A table or matrix in a Power BI report cannot dynamically resize to show all data: it gives scroll bars instead, and a printout cannot scroll. In a paginated report, data regions can expand and overflow to multiple pages in a controlled way, and a table can repeat its headings on each printed page.
Pause and decide. Which tool do you use to build a paginated report, and what is the underlying technology?
Power BI Report Builder, the standalone authoring tool. Paginated reports are based on RDL (Report Definition Language), the report technology from SQL Server Reporting Services. You can also build simple, single-table paginated reports in the Power BI service.
Pause and decide. Does a user with a free license see paginated reports?
Yes, if the workspace is on capacity: Fabric capacity F64 or higher, or Power BI Premium P1 or higher. Otherwise viewers need a Pro or Premium Per User license. You do not need Pro or PPU to create a paginated report or publish it to My Workspace, but you do to publish to other workspaces.
Why: what paginated reports add
- Print-ready layouts: margins, page headers and footers, and precise sizes and positions down to fractions of inches or centimeters.
- Render formats: readers export to Excel, Word, PowerPoint, PDF and accessible PDF, CSV, XML and MHTML.
- Parameters: highly customized, data-driven and cascading parameters, with defaults. They can also drive what-if scenarios or styling.
- Native queries and stored procedures: you do not first need a Power BI semantic model, though a semantic model is also a supported data source. Data from several sources can be combined in one report.
- Flexible grids: the tablix data region handles nested and adjacent groups and repeats headings. Subreports, mail merge, per-user layouts and expression-based layouts are possible.
- Distribution: email subscriptions on a schedule with attachments in any supported format, printing with print preview, and delivery in a Power BI app.
- Together with Power BI reports: drill through from a Power BI report to a paginated report using URL parameters, or embed a paginated report in a Power BI report with the paginated report visual (useful for pixel-perfect, print-ready or multi-page detail).
- Not supported yet: SSRS-style shared data sources (
.rds) and shared datasets (.rsd), linked reports, custom fonts and custom assemblies. Reports are limited to 250 data sources. - Old SSRS reports: migrate them to paginated reports, or redevelop analytic ones as Power BI reports, which usually give readers a better experience.
Dev gets his 400 invoices as one PDF, with page numbers, at six in the morning, in his inbox, without asking anyone. Ananya, watching, asks whether you can do the same for her board pack. You smile and reach for the Report Builder.
Exam lens
- Paginated: printing, PDF, invoices, statements, overflowing grids, exact layouts. Power BI report: exploration and interactivity.
- Authoring tool: Power BI Report Builder (RDL).
- Free users can view them on F64 or higher / P1 or higher capacity.
- Use both: drillthrough or the paginated report visual.
The review: nine quick calls
Ananya reads the seven notes out loud, and for each one she wants you to name the fix. Answer in your head first, then open each one.
Pause and decide. 1. Which visual shows how a total was built from positive and negative steps?
A waterfall chart.
Pause and decide. 2. A chart's title must change with the selected region. How?
Use fx on the title text and bind it to a DAX measure.
Pause and decide. 3. You recolored one visual by hand and the new theme did not change it. How do you make it follow the theme?
Reset to default on that visual (or the formatting section).
Pause and decide. 4. How do you reuse the BrightLeaf theme in another report?
Download theme (JSON) and Import theme in the other report. Admins can also publish an organizational theme.
Pause and decide. 5. Color cells red, amber and green based on a % of target column. Which style and which setting?
Rules, with decimals and Number (not Percent).
Pause and decide. 6. A color must come from a status text column. What do you create?
A measure that returns the colors (text), used with Field value.
Pause and decide. 7. A selection must apply on three pages. What do you use?
Sync slicers.
Pause and decide. 8. The board-room screen is 1920 x 1080. Which setting?
Canvas settings: 16:9, 1920 x 1080 (Full HD).
Pause and decide. 9. A statement of account must print on several pages with repeated headings. Which report type?
A paginated report, built in Power BI Report Builder.
The cheat sheet
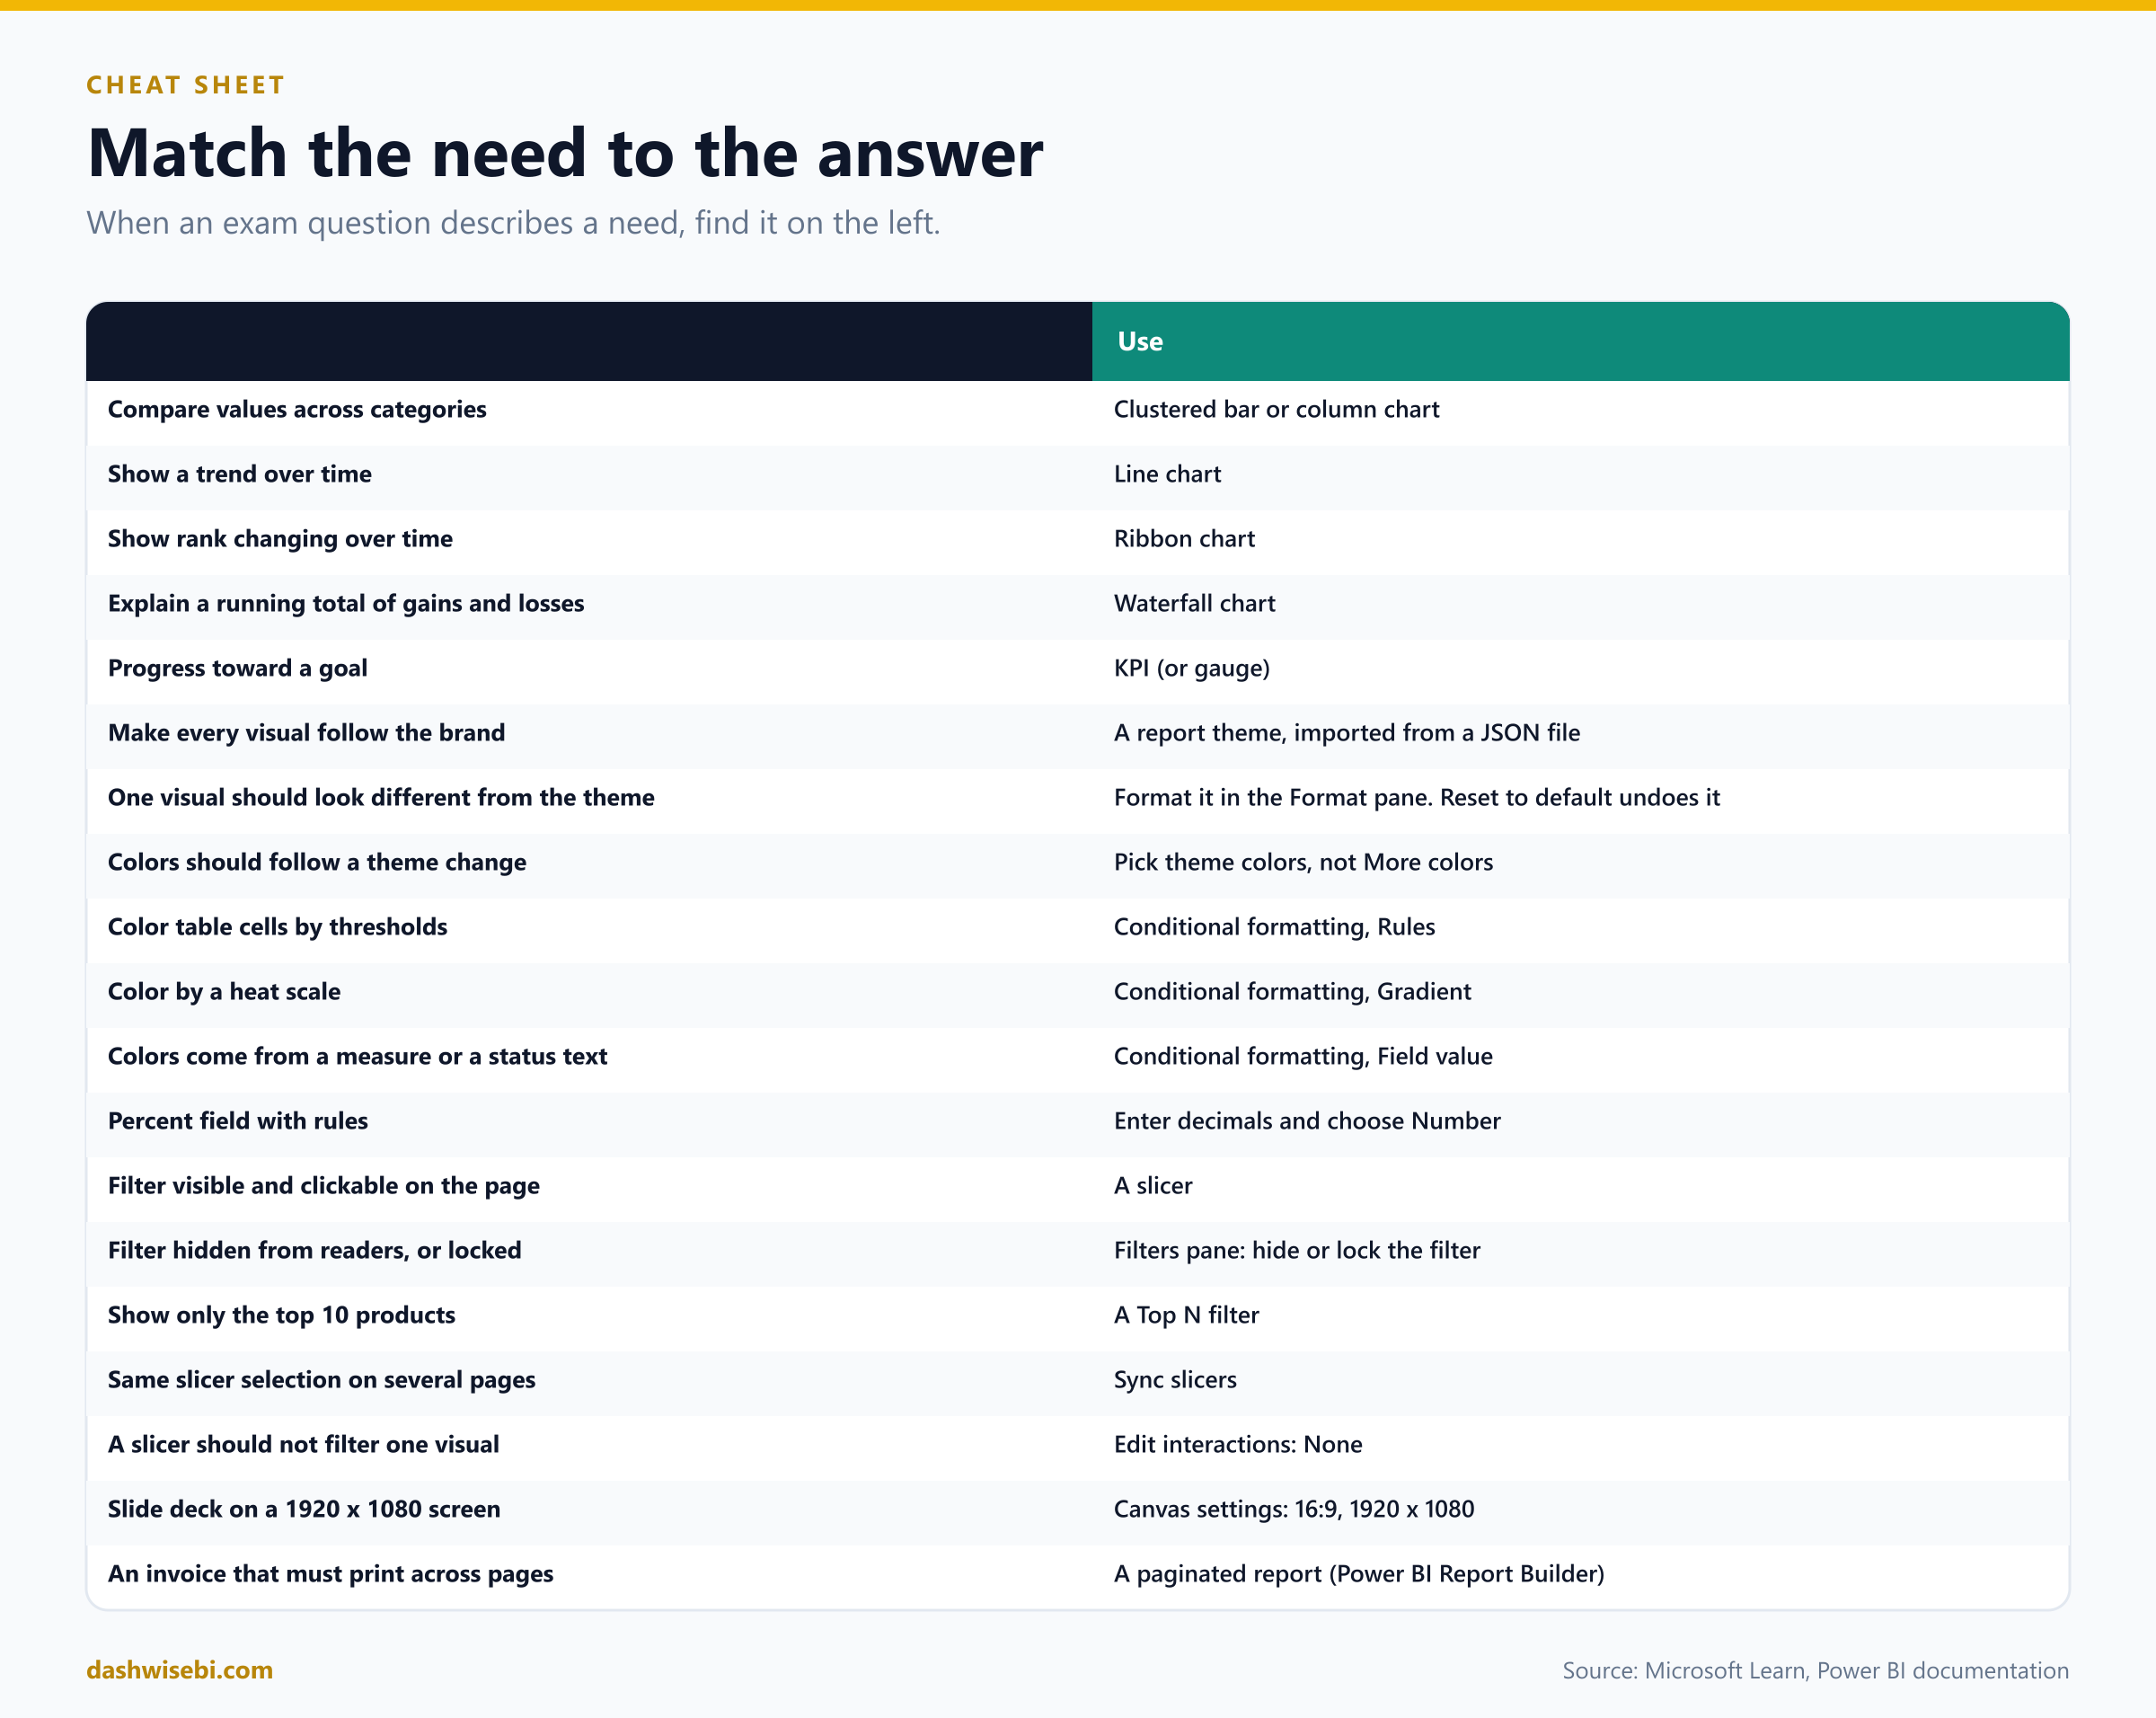
Myth or fact?
- “A pie chart is fine for 14 categories.” Myth. Pie and donut charts are for a small number of categories.
- “Theme formatting overrides what I set on a visual.” Myth. Visual formatting wins until you reset it.
- “A color from More colors follows a theme change.” Myth. Only theme colors do.
- “You can store conditional formatting rules in a theme.” Myth. You can reference theme color names from a measure.
- “Conditional formatting can color matrix headers.” Myth. Only values, totals and subtotals.
- “For a percentage field, use Percent in the rules.” Myth. Use decimals and Number.
- “Select all in a slicer filters on every value.” Myth. It applies no filter.
- “The Filters pane shows on publish to web.” Myth. It does not. Use slicers.
- “Page view sets the page size.” Myth. Canvas settings do. Page view only changes how it fits the window.
- “A Power BI table prints all its rows.” Myth. It scrolls. Use a paginated report for printing.
- “Free-license users can never open paginated reports.” Myth. They can, in workspaces on F64 or higher or Premium P1 or higher.
Where to go next
- Take one of your own reports. For each visual, write down the question it answers, and replace any that do not fit.
- Create a theme: customize colors and fonts, download the JSON, and import it into a second report.
- Build a table with a
StatusColormeasure and Field value formatting. Then switch it to returngood,neutralandbad, and change the theme. - Add a Region slicer, sync it across two pages, and use Edit interactions to exclude one card.
- Download Power BI Report Builder and build a one-table invoice. Export it to PDF.
- Coming later: interactions, tooltips, bookmarks and navigation, drilling and sorting, then grouping, AI visuals and scorecards.
- Read the sources behind this post: PL-300 study guide, Overview of visualizations in Power BI, Format pane General tab overview, Use report themes in Power BI, Create custom report themes, Conditional formatting in Power BI visuals, Apply conditional table formatting, Overview of slicers in Power BI, Add a filter to a report, Format filters in Power BI reports, Apply page size and settings in a Power BI report, When to use paginated reports in Power BI and Paginated reports in Power BI: FAQ.
Keep reading
PL-300 Episode 9: Usability, Mobile & Accessibility
PL-300 as a rollout week: export settings, mobile layouts, personalized visuals, accessibility and automatic page refresh.
PL-300 Episode 8: Interactivity & Navigation
PL-300 as a usability test: sorting, interactions, sync slicers, tooltips, drillthrough, navigation, the Selection pane and bookmarks.