PL-300 Episode 8: Interactivity & Navigation

PowerBI consultant ·
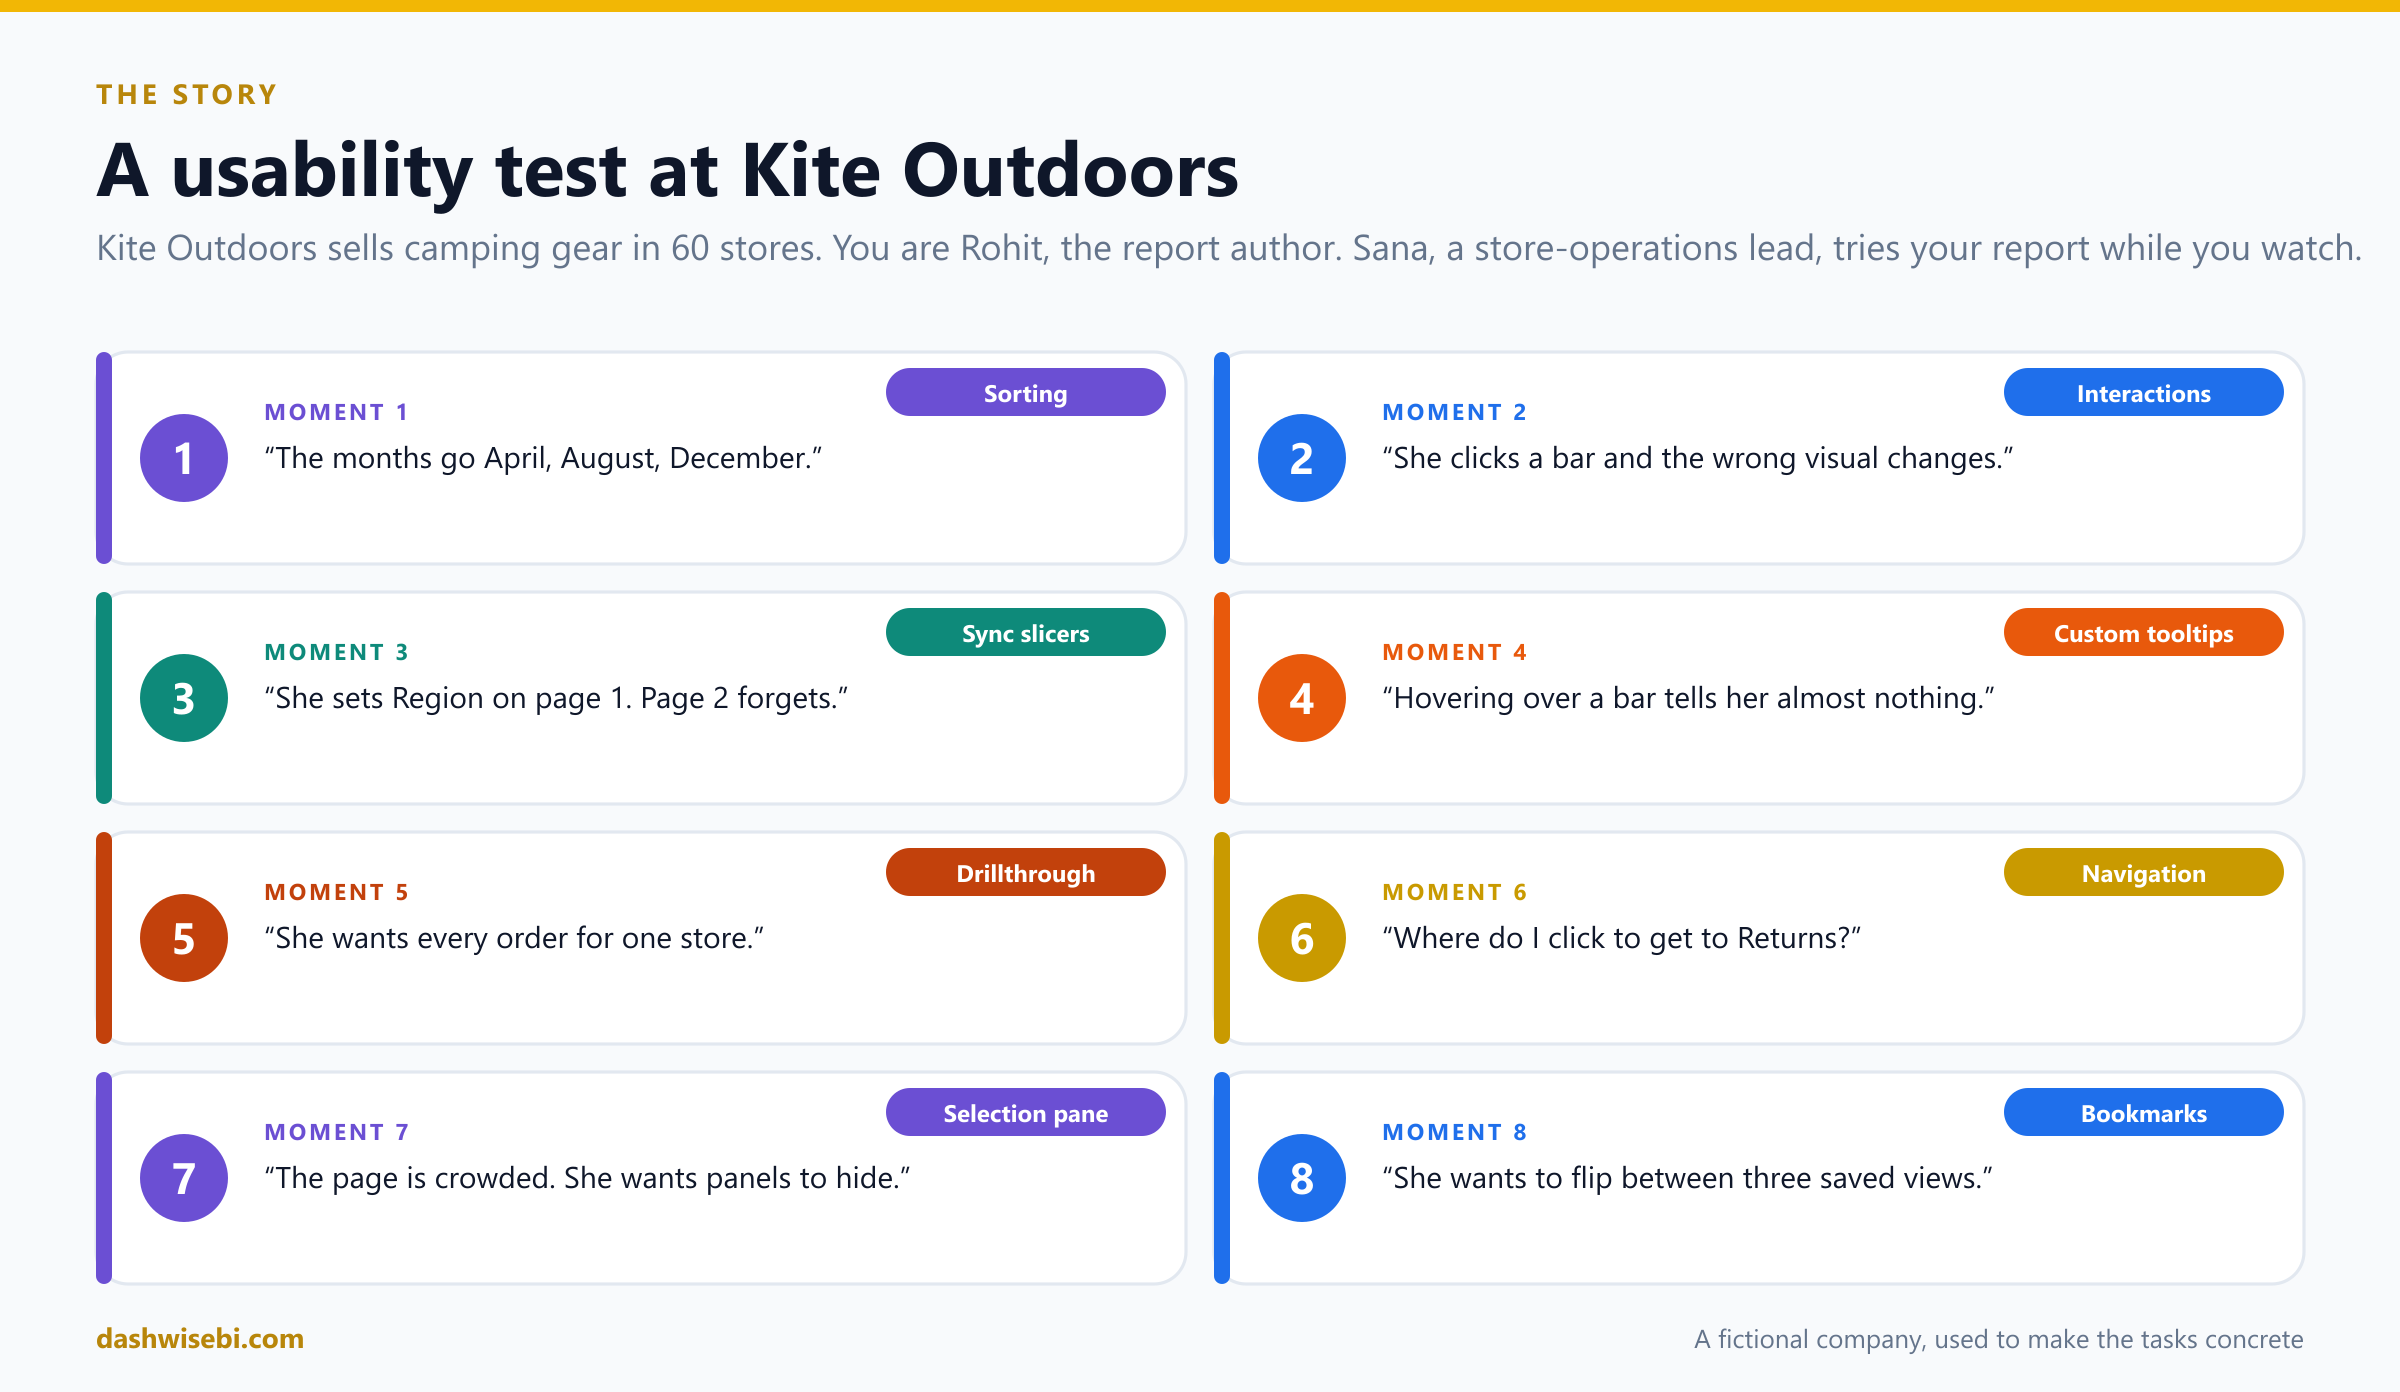
Thursday, 3 p.m. In a small meeting room at Kite Outdoors, a camping-gear retailer with 60 stores, Sana from store operations sits down at a laptop. You are Rohit, the report author. You have been told to say nothing for twenty minutes and just watch her use your report.
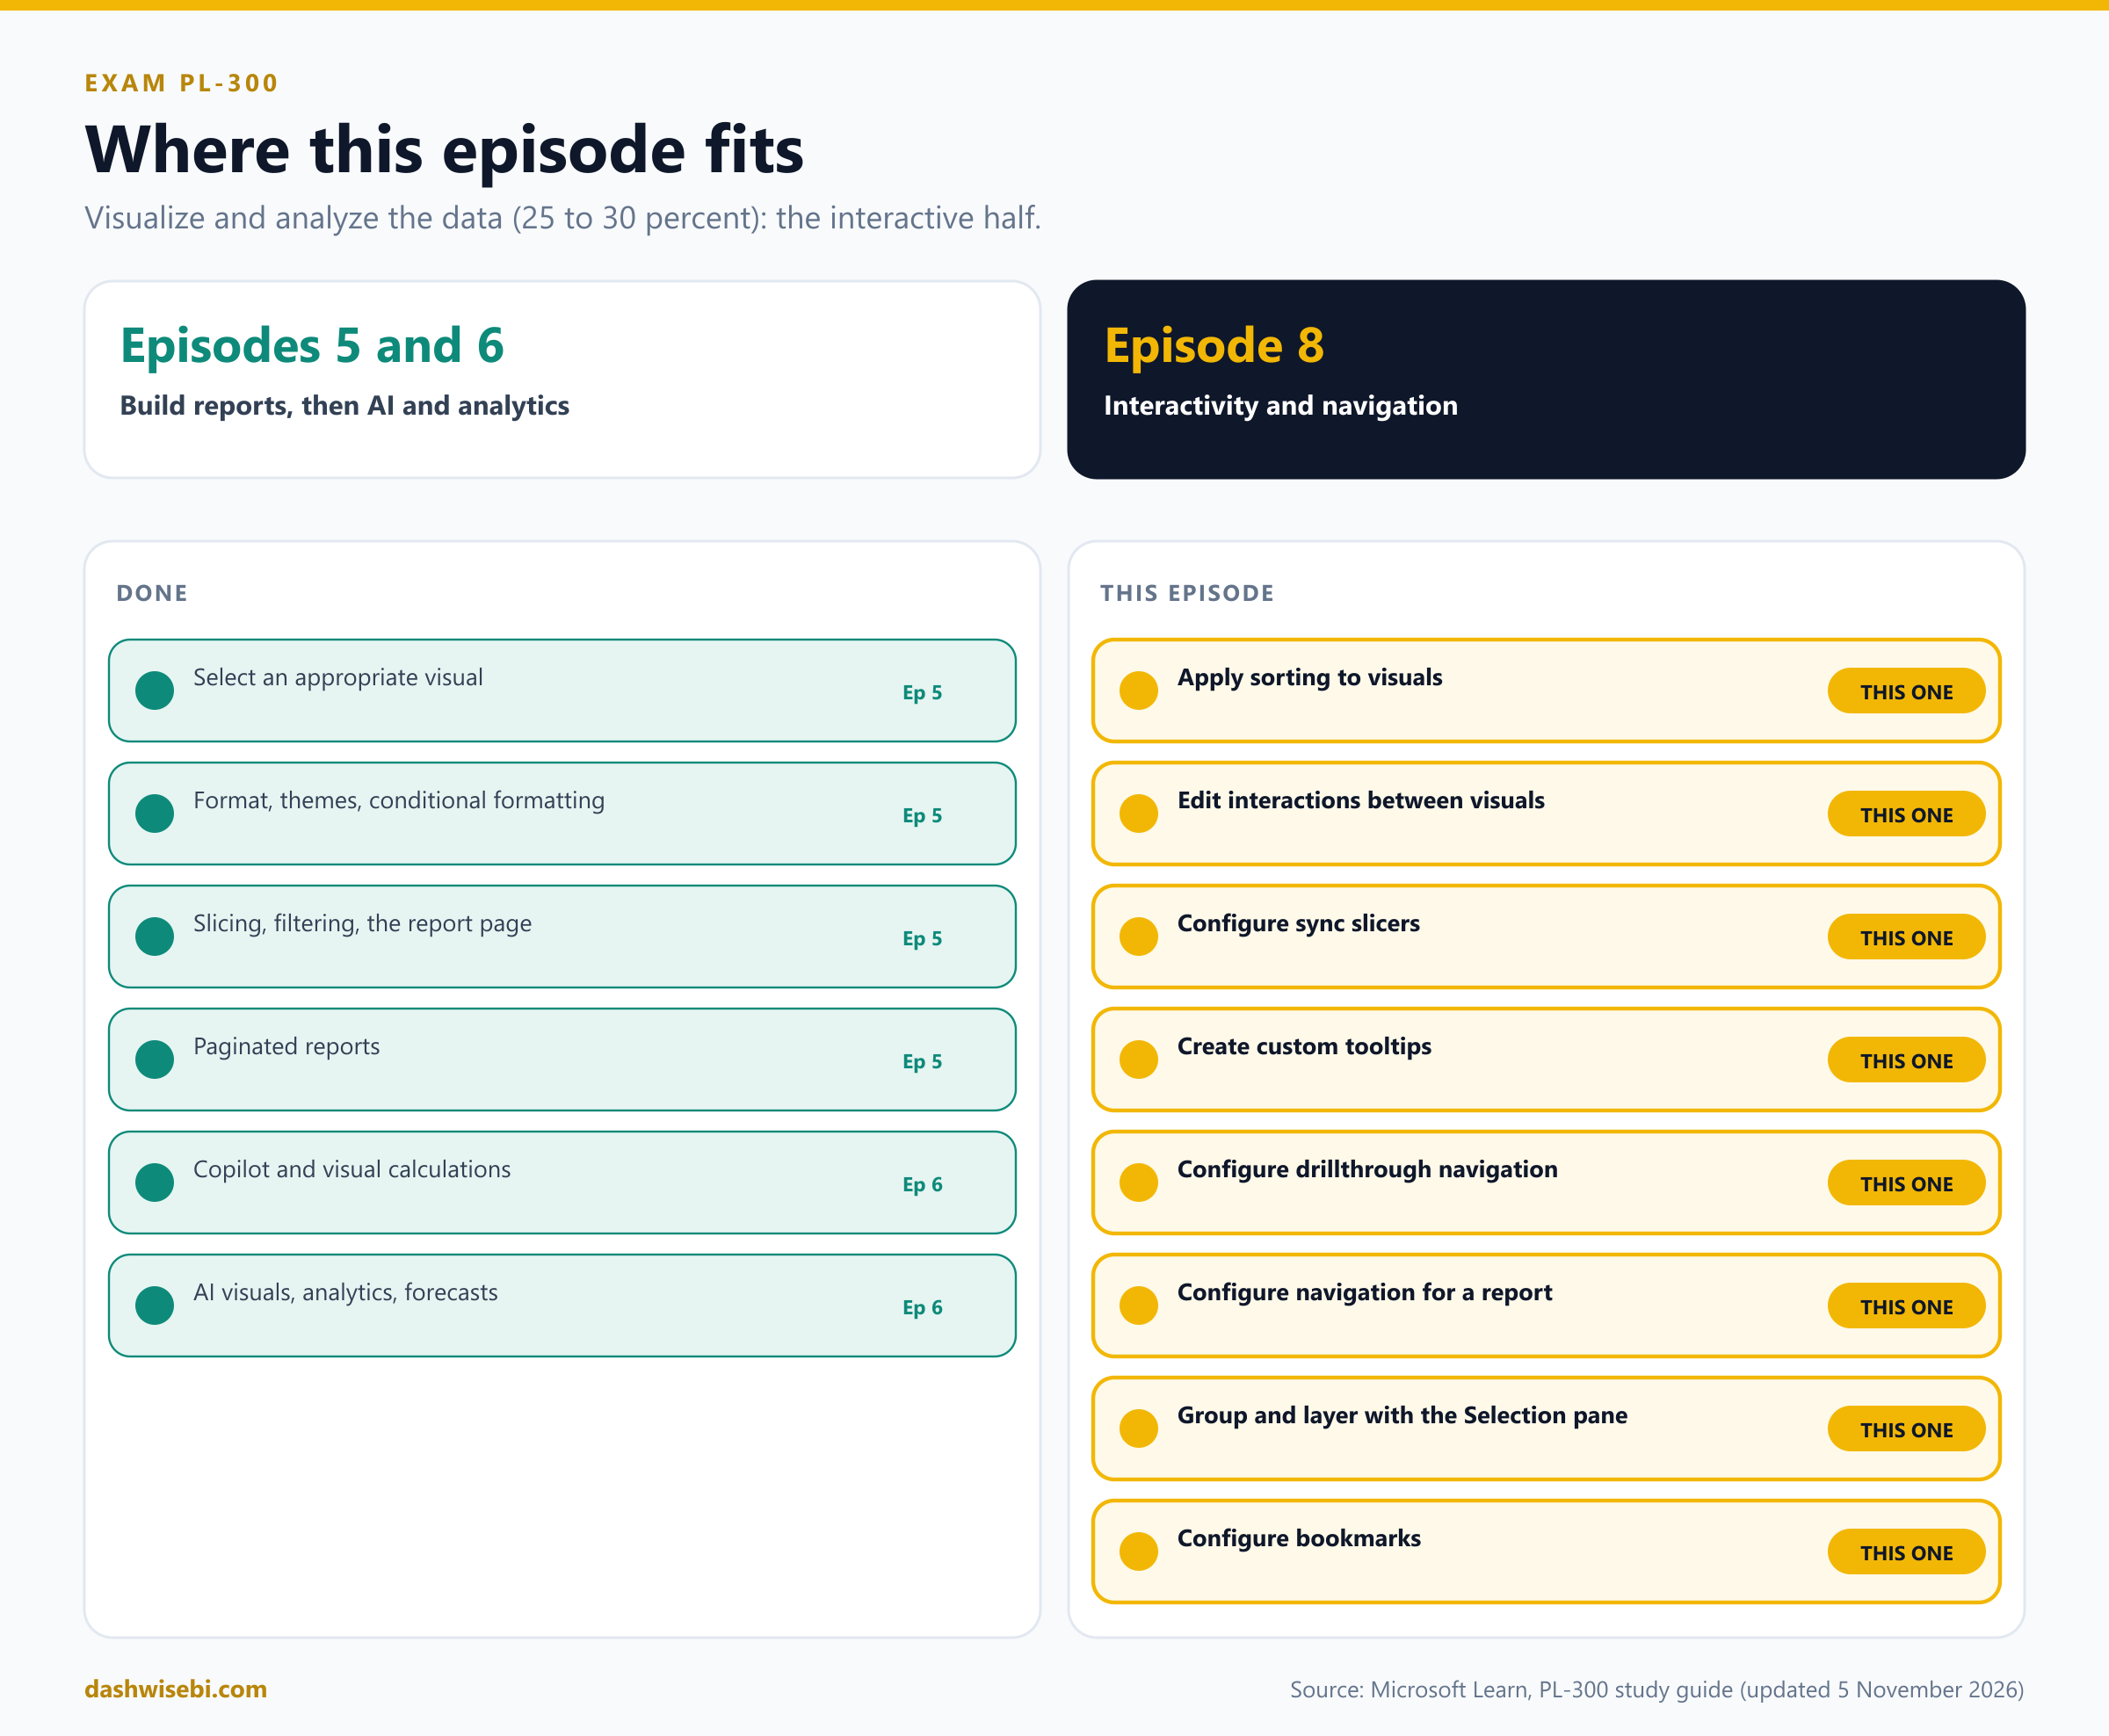
Welcome to Episode 8 of our PL-300 series. In Episode 7 you protected the data. Now you make the report pleasant to use. This episode returns to the Visualize and analyze the data skill area (25 to 30 percent of the exam) and covers the interactive half. The eight topics are the eight moments in which Sana gets stuck:
- Apply sorting to visuals
- Edit and configure interactions between visuals
- Configure sync slicers
- Create custom tooltips
- Configure drillthrough navigation, including pages, filters, and buttons
- Configure navigation for a report
- Group and layer visuals by using the Selection pane
- Configure bookmarks
The study guide lists them in a different order. I reordered them the way a usability test would reveal them. Each chapter has the same rhythm:
- The moment. What Sana does, and where she gets stuck.
- Pause and decide. Choose first. The answer is behind a click.
- Why. The reasoning, with diagrams.
- Exam lens. What PL-300 tends to ask, and the traps.
A few honest notes. Kite Outdoors is made up, and I have not run every step on a live tenant, so I follow Microsoft Learn and say so where it is thin. The menus of Power BI Desktop move around between releases, so check the live pages before an exam. Episode 5 already introduced slicers, the Filters pane and tooltip page size. I refer back to it and do not repeat it, except where the exam asks something new.
Moment 1. “The months go April, August, December”
Sana opens the sales page. The line chart shows a jagged line, and she squints at the axis. “Is this a joke? Why does the year start with April?”
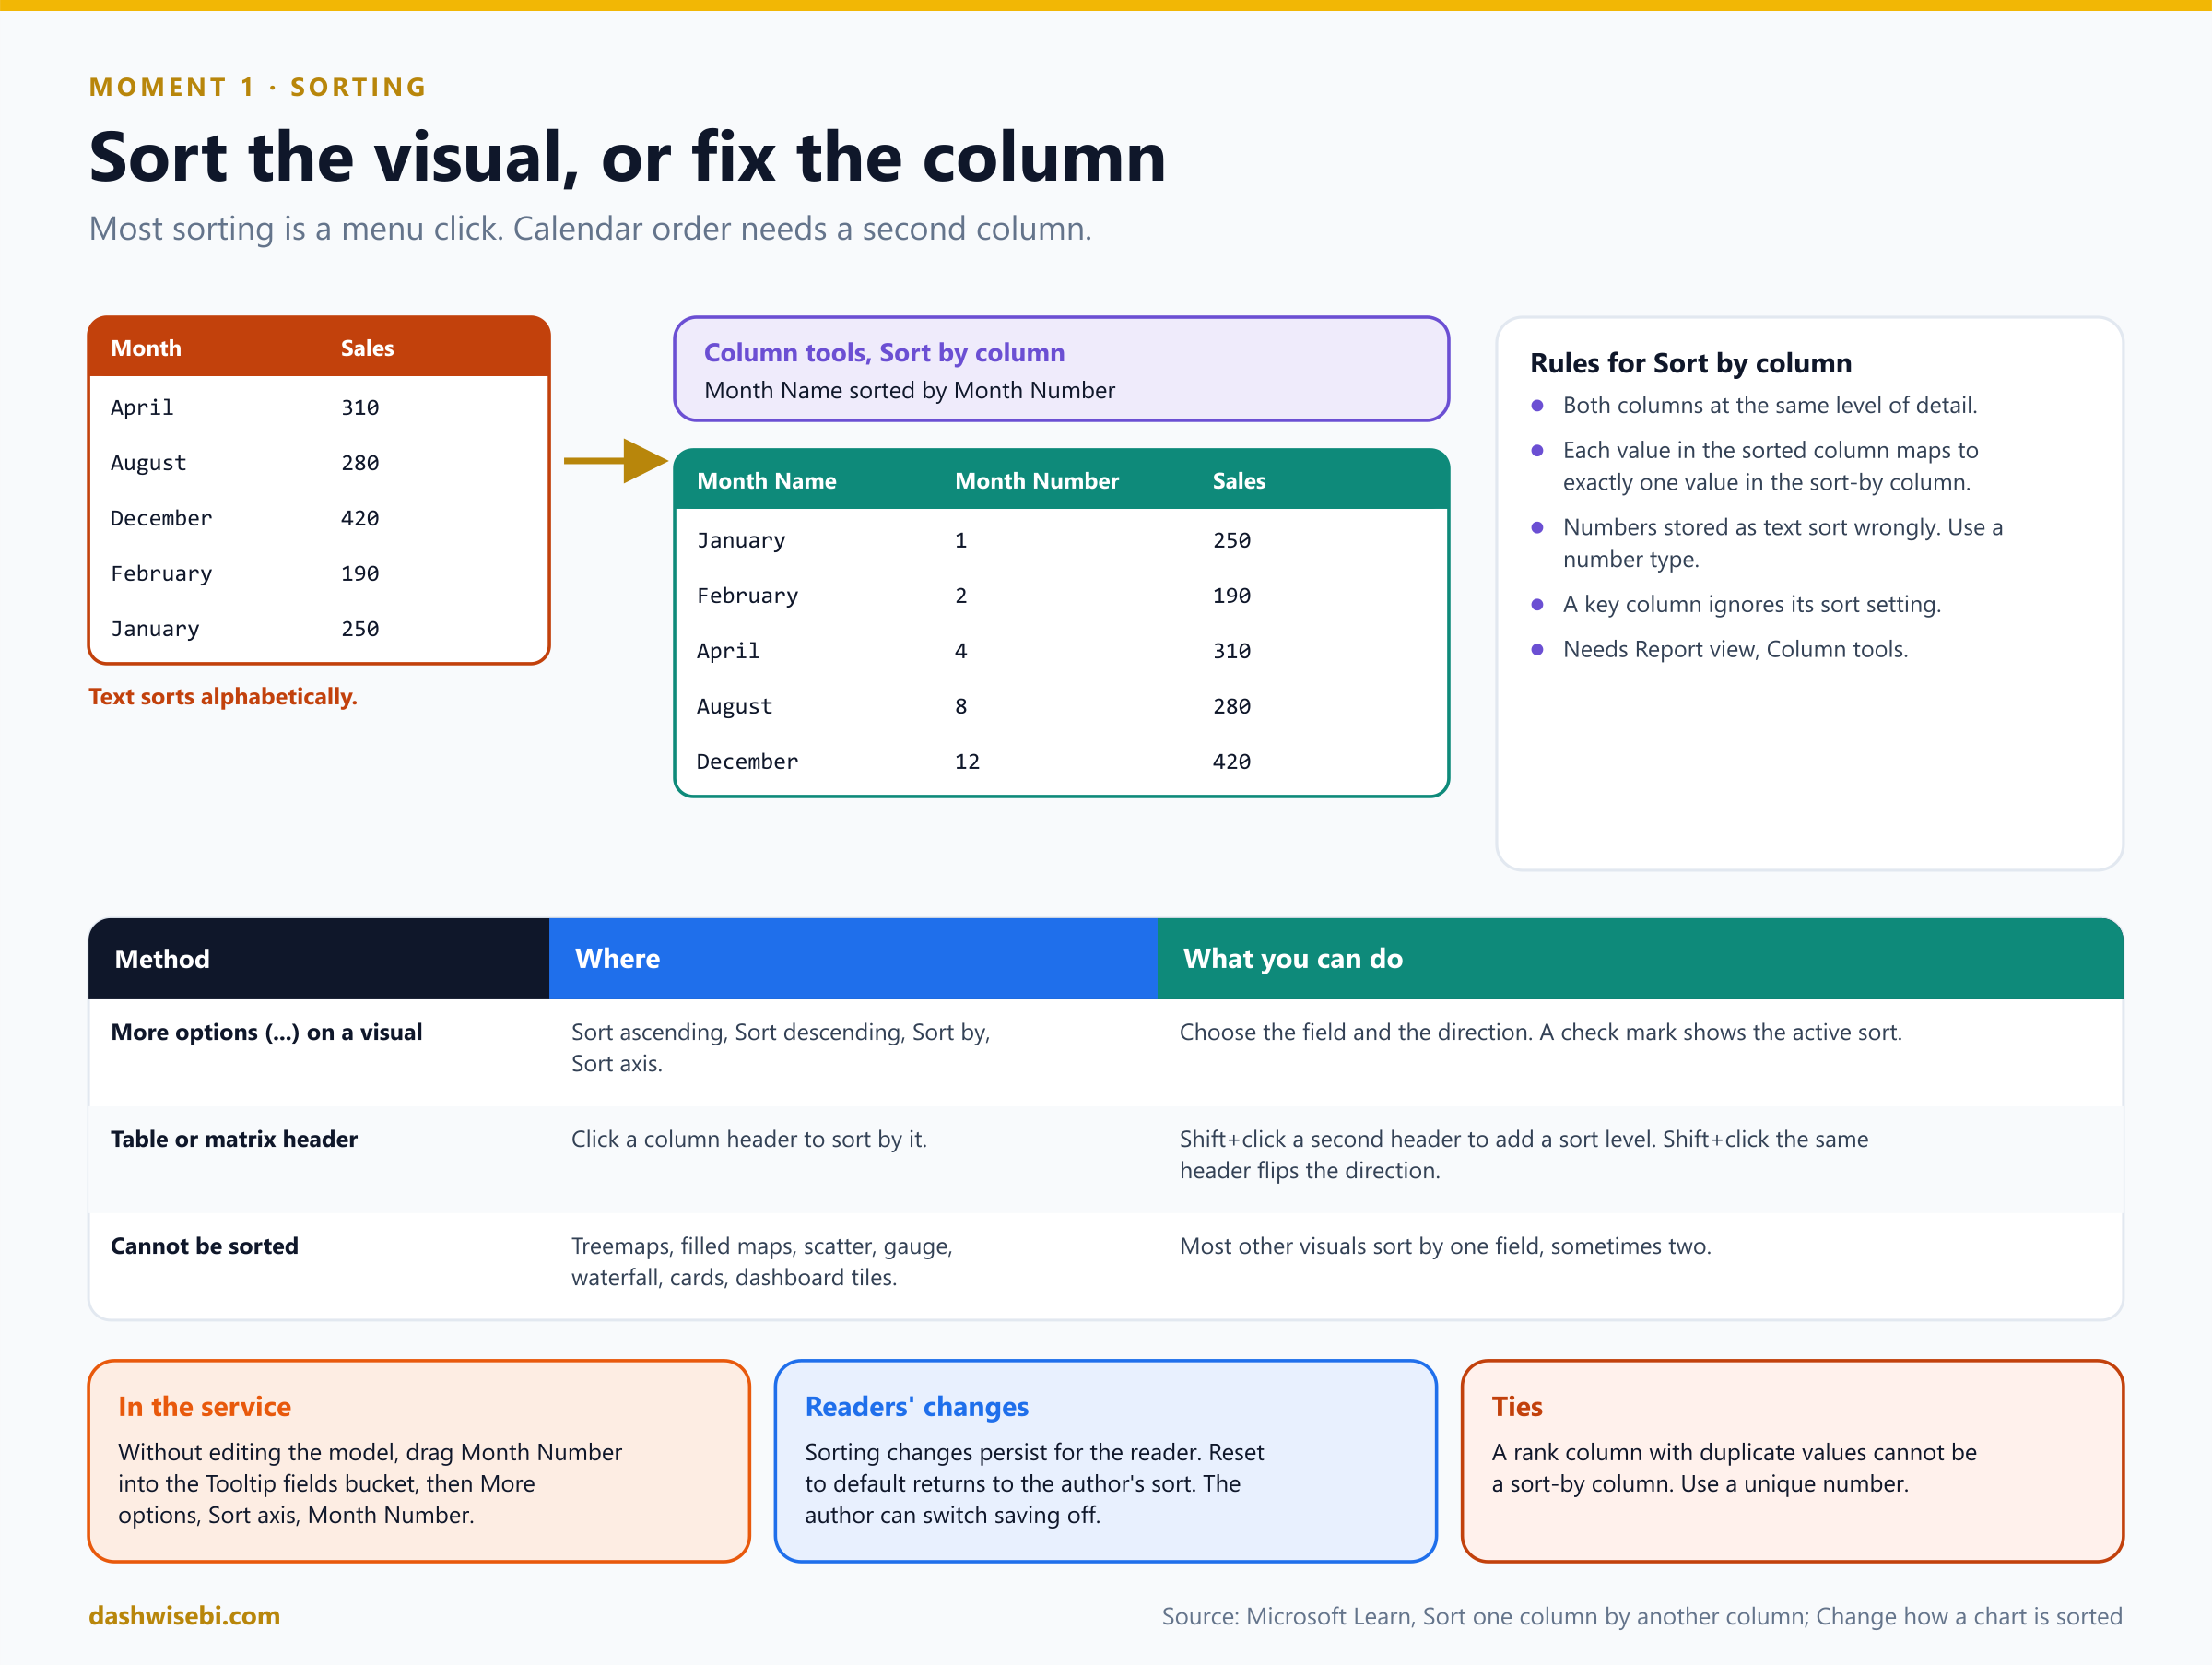
A text column sorts alphabetically. That is correct for names and wrong for months. There are two layers to sorting, and the exam likes to mix them up.
Pause and decide. The Month Name column must follow the calendar. What do you do, and where?
In Power BI Desktop, in Report view, select the Month Name column. On the Column tools tab choose Sort by column and pick Month Number. The sort applies to every visual in the report that uses the column. You will not see the Column tools tab in Model view or Table view.
Pause and decide. Your colleague tries to sort Month Name by a column called Day Number. It fails. Why?
Both columns must be at the same level of detail. Each value in the column you sort (each month name) must map to exactly one value in the sort-by column. A day number has many values per month. Use Month Number. A second common cause: the month number is stored as text, and then it sorts as text. Change the type to a whole number.
Pause and decide. A rank column has two products that both have rank 1. Can you use it to sort the product names?
No. A sort-by column cannot contain duplicate values for the items you sort, so you get the error that the column cannot be used for sorting. Create a unique sequential number instead, or sort the visual itself.
Pause and decide. Sana wants to sort a bar chart by the sales value, low to high, with no changes to the model. Where is that?
Select the visual and open More options (...). Depending on the visual you see Sort ascending, Sort descending, Sort by and Sort axis. A check mark shows the active field and direction. This is a property of the visual, not of the model.
Pause and decide. In a table, Sana sorts by Customers and then wants a second level by Revenue. How?
Click the Customers column header, then hold Shift and click the Revenue header. The order in which you pick the columns sets the priority. Shift+click on a column that is already in the sort flips its direction. If you Shift+click a column that was added earlier, it moves to the back of the sort order.
Why: two kinds of sorting
- Sort by column is a model-level setting for a column. It is the fix for months, weekdays and any text that has a natural order.
- Sort in the visual is a visual-level setting. Most visuals sort by one field, sometimes two. Treemaps, filled maps, scatter charts, gauges, waterfall charts and cards cannot be sorted, and neither can tiles on a dashboard.
- In the Power BI service you cannot open Column tools. The documented workaround for a visual is to drag the Month Number field into the Tooltip fields bucket, then choose More options, Sort axis, Month Number. The number then also shows in the default tooltip, so a custom tooltip (Moment 4) hides it.
- Readers' changes persist. Sort changes in a report stay when the reader returns. Reset to default returns to the author's settings, and the author can prevent saving. A key column ignores its sort-by setting.
The line now runs from January to December. Sana grunts, which you decide to count as approval.
Exam lens
- Sort by column: Report view, Column tools, same granularity, unique values, numeric type.
- Visual sorting: More options, Sort ascending or descending, Sort axis. Shift+click for multi-level sorts in tables.
- Cannot sort: treemap, filled map, scatter, gauge, waterfall, card.
Moment 2. “I clicked a bar and the wrong chart changed”
Sana clicks the Pune bar. The map zooms, the line chart collapses to one city, and the card showing national sales drops to a fraction. “I did not ask for that one,” she says, pointing at the card.
By default visuals on a page cross-filter and cross-highlight each other. You control this per visual, from the visual you click outward.
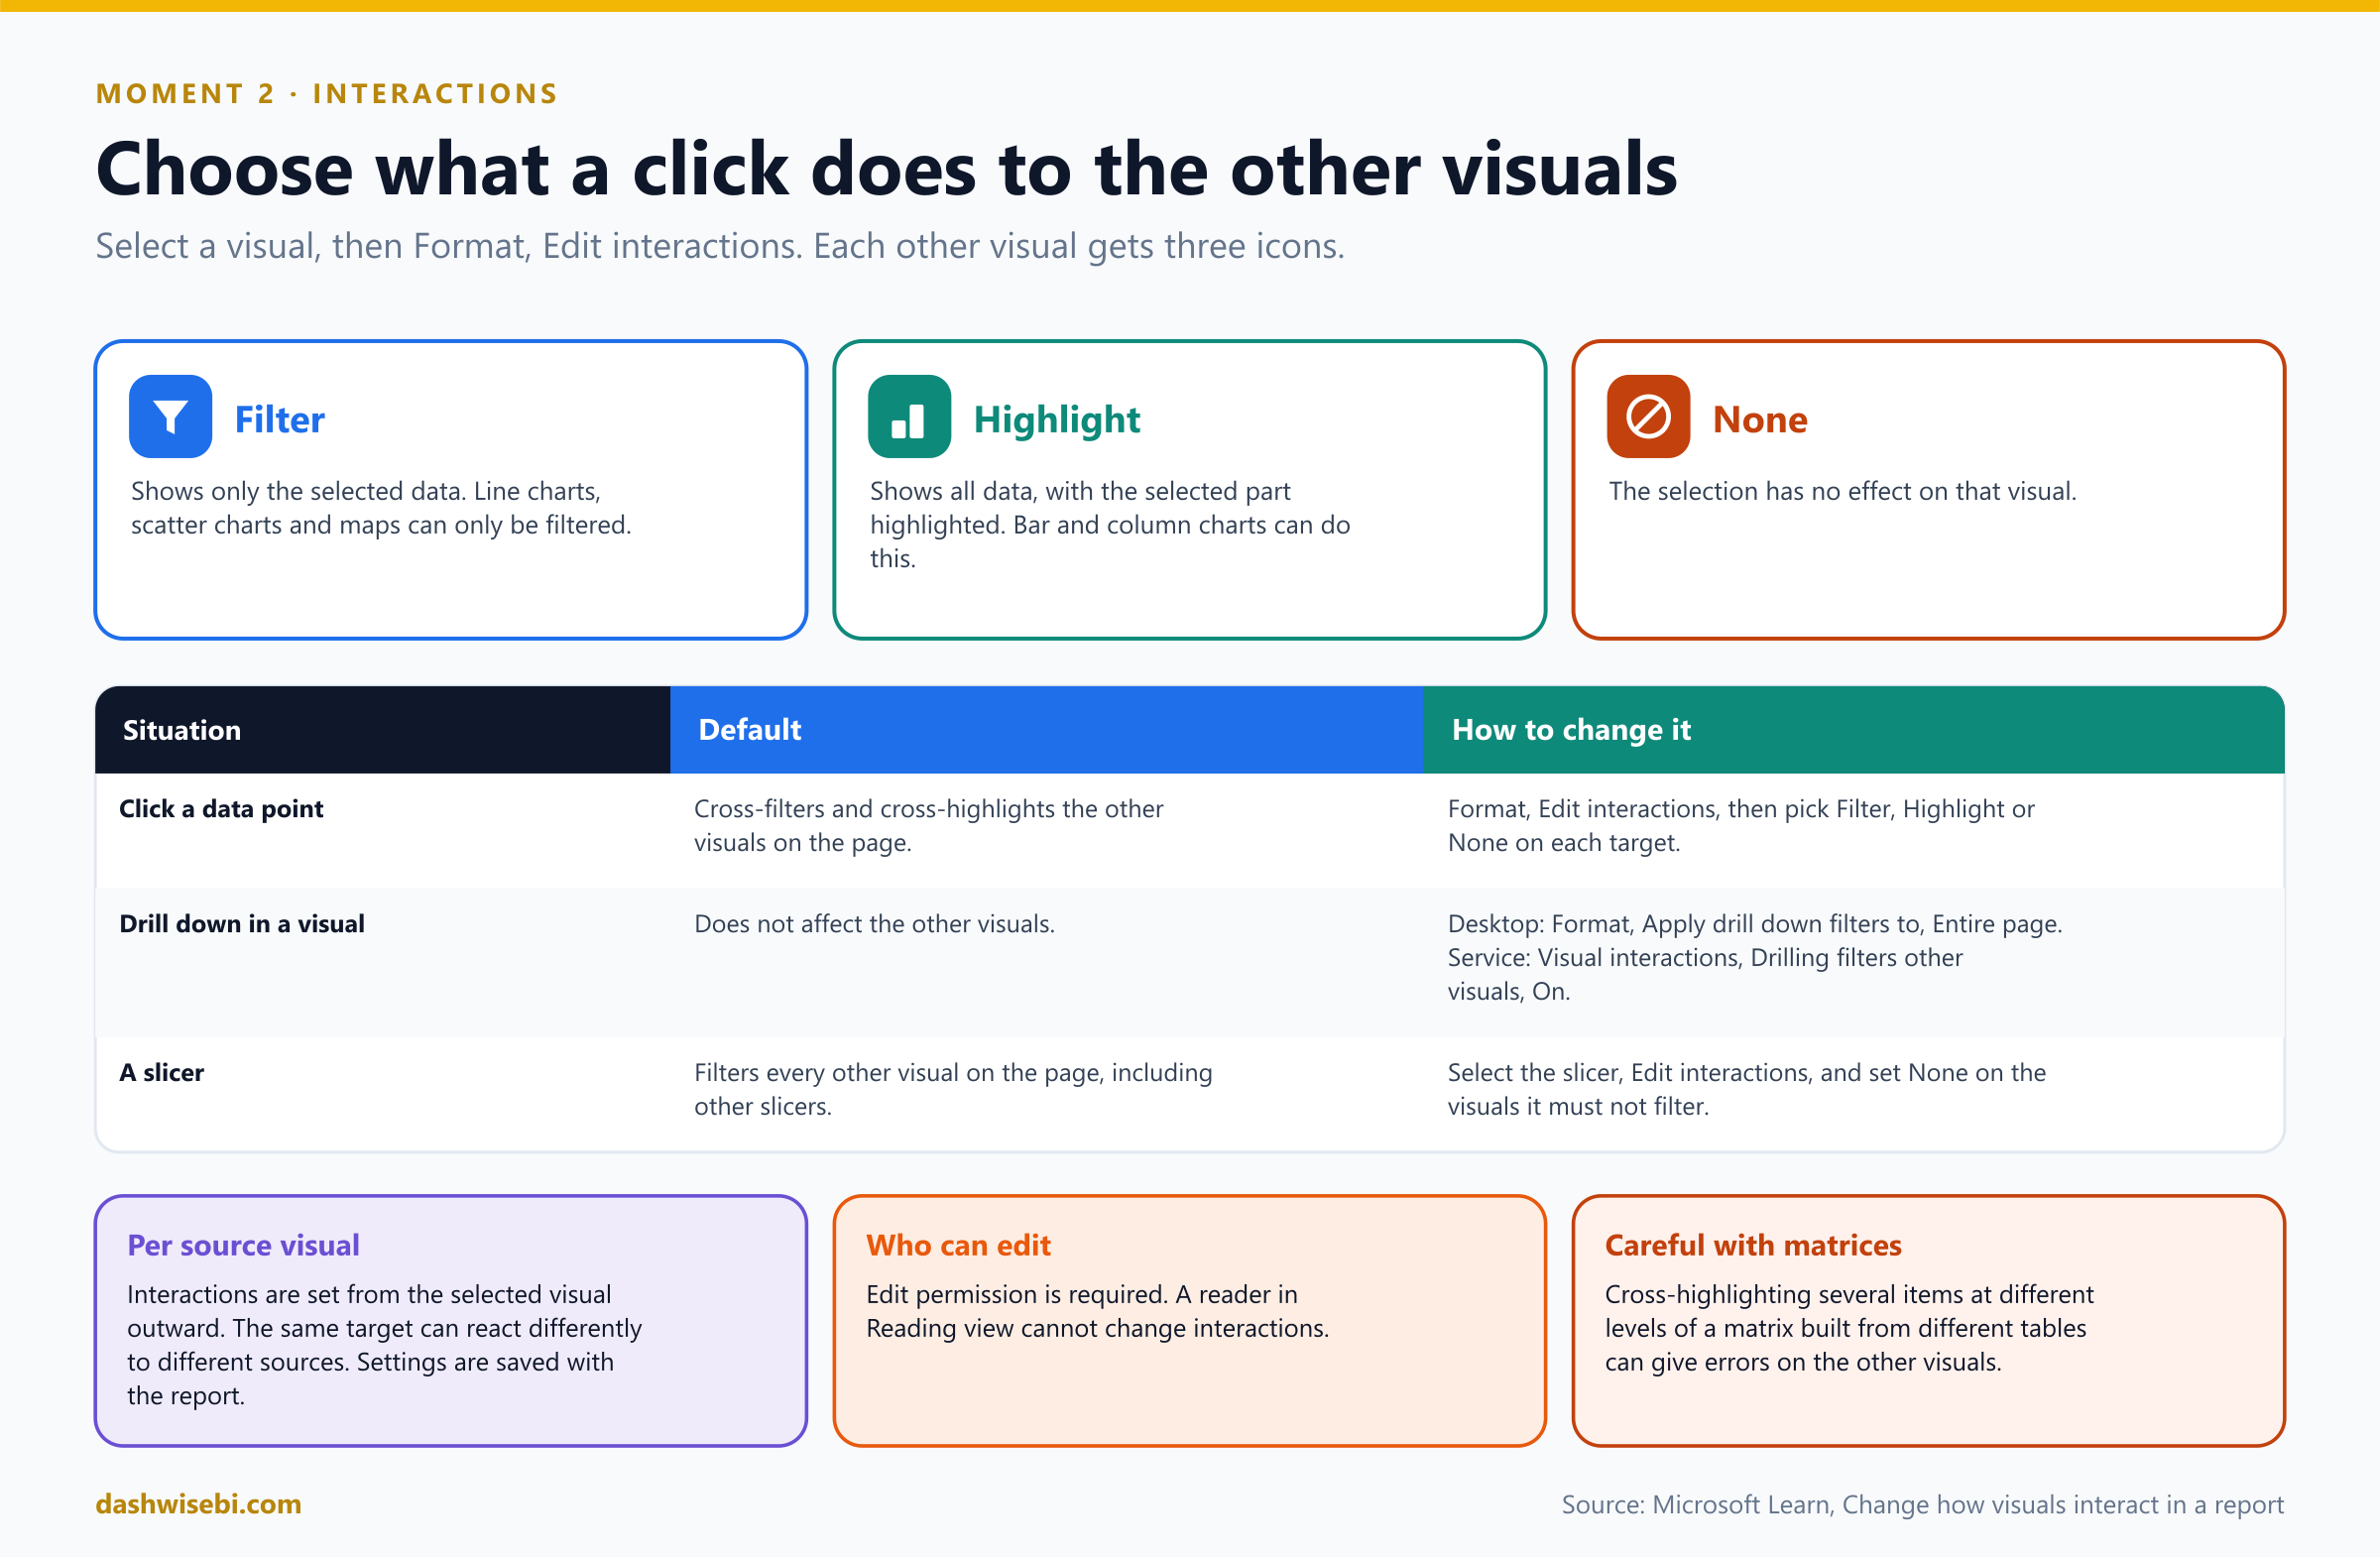
Pause and decide. How do you turn on the controls that let you change this?
Select a visual (the source). In Desktop choose Format and then Edit interactions. In the service, open the report in Editing view, select Visual interactions and turn on Edit interactions. Every other visual on the page then shows icons in its corner. You need edit permission.
Pause and decide. The national card must stay at the national total, whatever Sana clicks. Which icon?
Select the source visual, then select the None icon on the card. You do this for each source visual that affects the card. If the source is a slicer, it is the same: select the slicer, choose Edit interactions, and set None for the visuals it must not filter.
Pause and decide. What is the difference between Filter and Highlight?
Filter shows only the selected data in the target. Highlight keeps all the data and highlights the selected part. Line charts, scatter charts and maps can only be filtered. Bar and column charts can do both. The bold icon is the one in effect.
Pause and decide. Sana drills down from year to month in a column chart, and the other visuals do not change. Bug?
No, it is the default. Drilling does not affect other visuals. In Desktop, select the visual, turn on drill down, and under Format set Apply drill down filters to to Entire page. In the service, set Drilling filters other visuals to On in the Visual interactions menu.
Pause and decide. Which is different: cross-filtering or the Filters pane?
They are different mechanisms. The terms cross-filter and cross-highlight describe what visuals do to each other. The Filters pane filters visuals from the side (visual, page and report levels). The interaction settings are saved with the report, so readers get the same behavior.
Why: interactions belong to the source
- The setting lives on the source. The same card can be filtered by one visual and unaffected by another.
- By default slicers filter every visual on the page, including other slicers. That is another reason to learn Edit interactions.
- A known limit: if you cross-highlight several items at different levels of a matrix whose fields come from different tables, the other visuals can show errors.
- A reader in Reading view cannot change interactions. If you only have viewing access, you cannot edit them.
Sana clicks Pune again. The map and the line chart respond, and the national card stays calm. “Better,” she says.
Exam lens
- Format, Edit interactions, then Filter, Highlight or None on each target.
- Line charts, scatter charts and maps: filter only.
- Drilling affects other visuals only after you change the setting (Entire page).
Moment 3. “I picked West on page one and page two forgot”
Sana chooses the West region on the Overview page, moves to Stores, and sees every region again. She sighs and picks West a second time.
Episode 5 introduced slicers. The exam adds the settings around syncing.
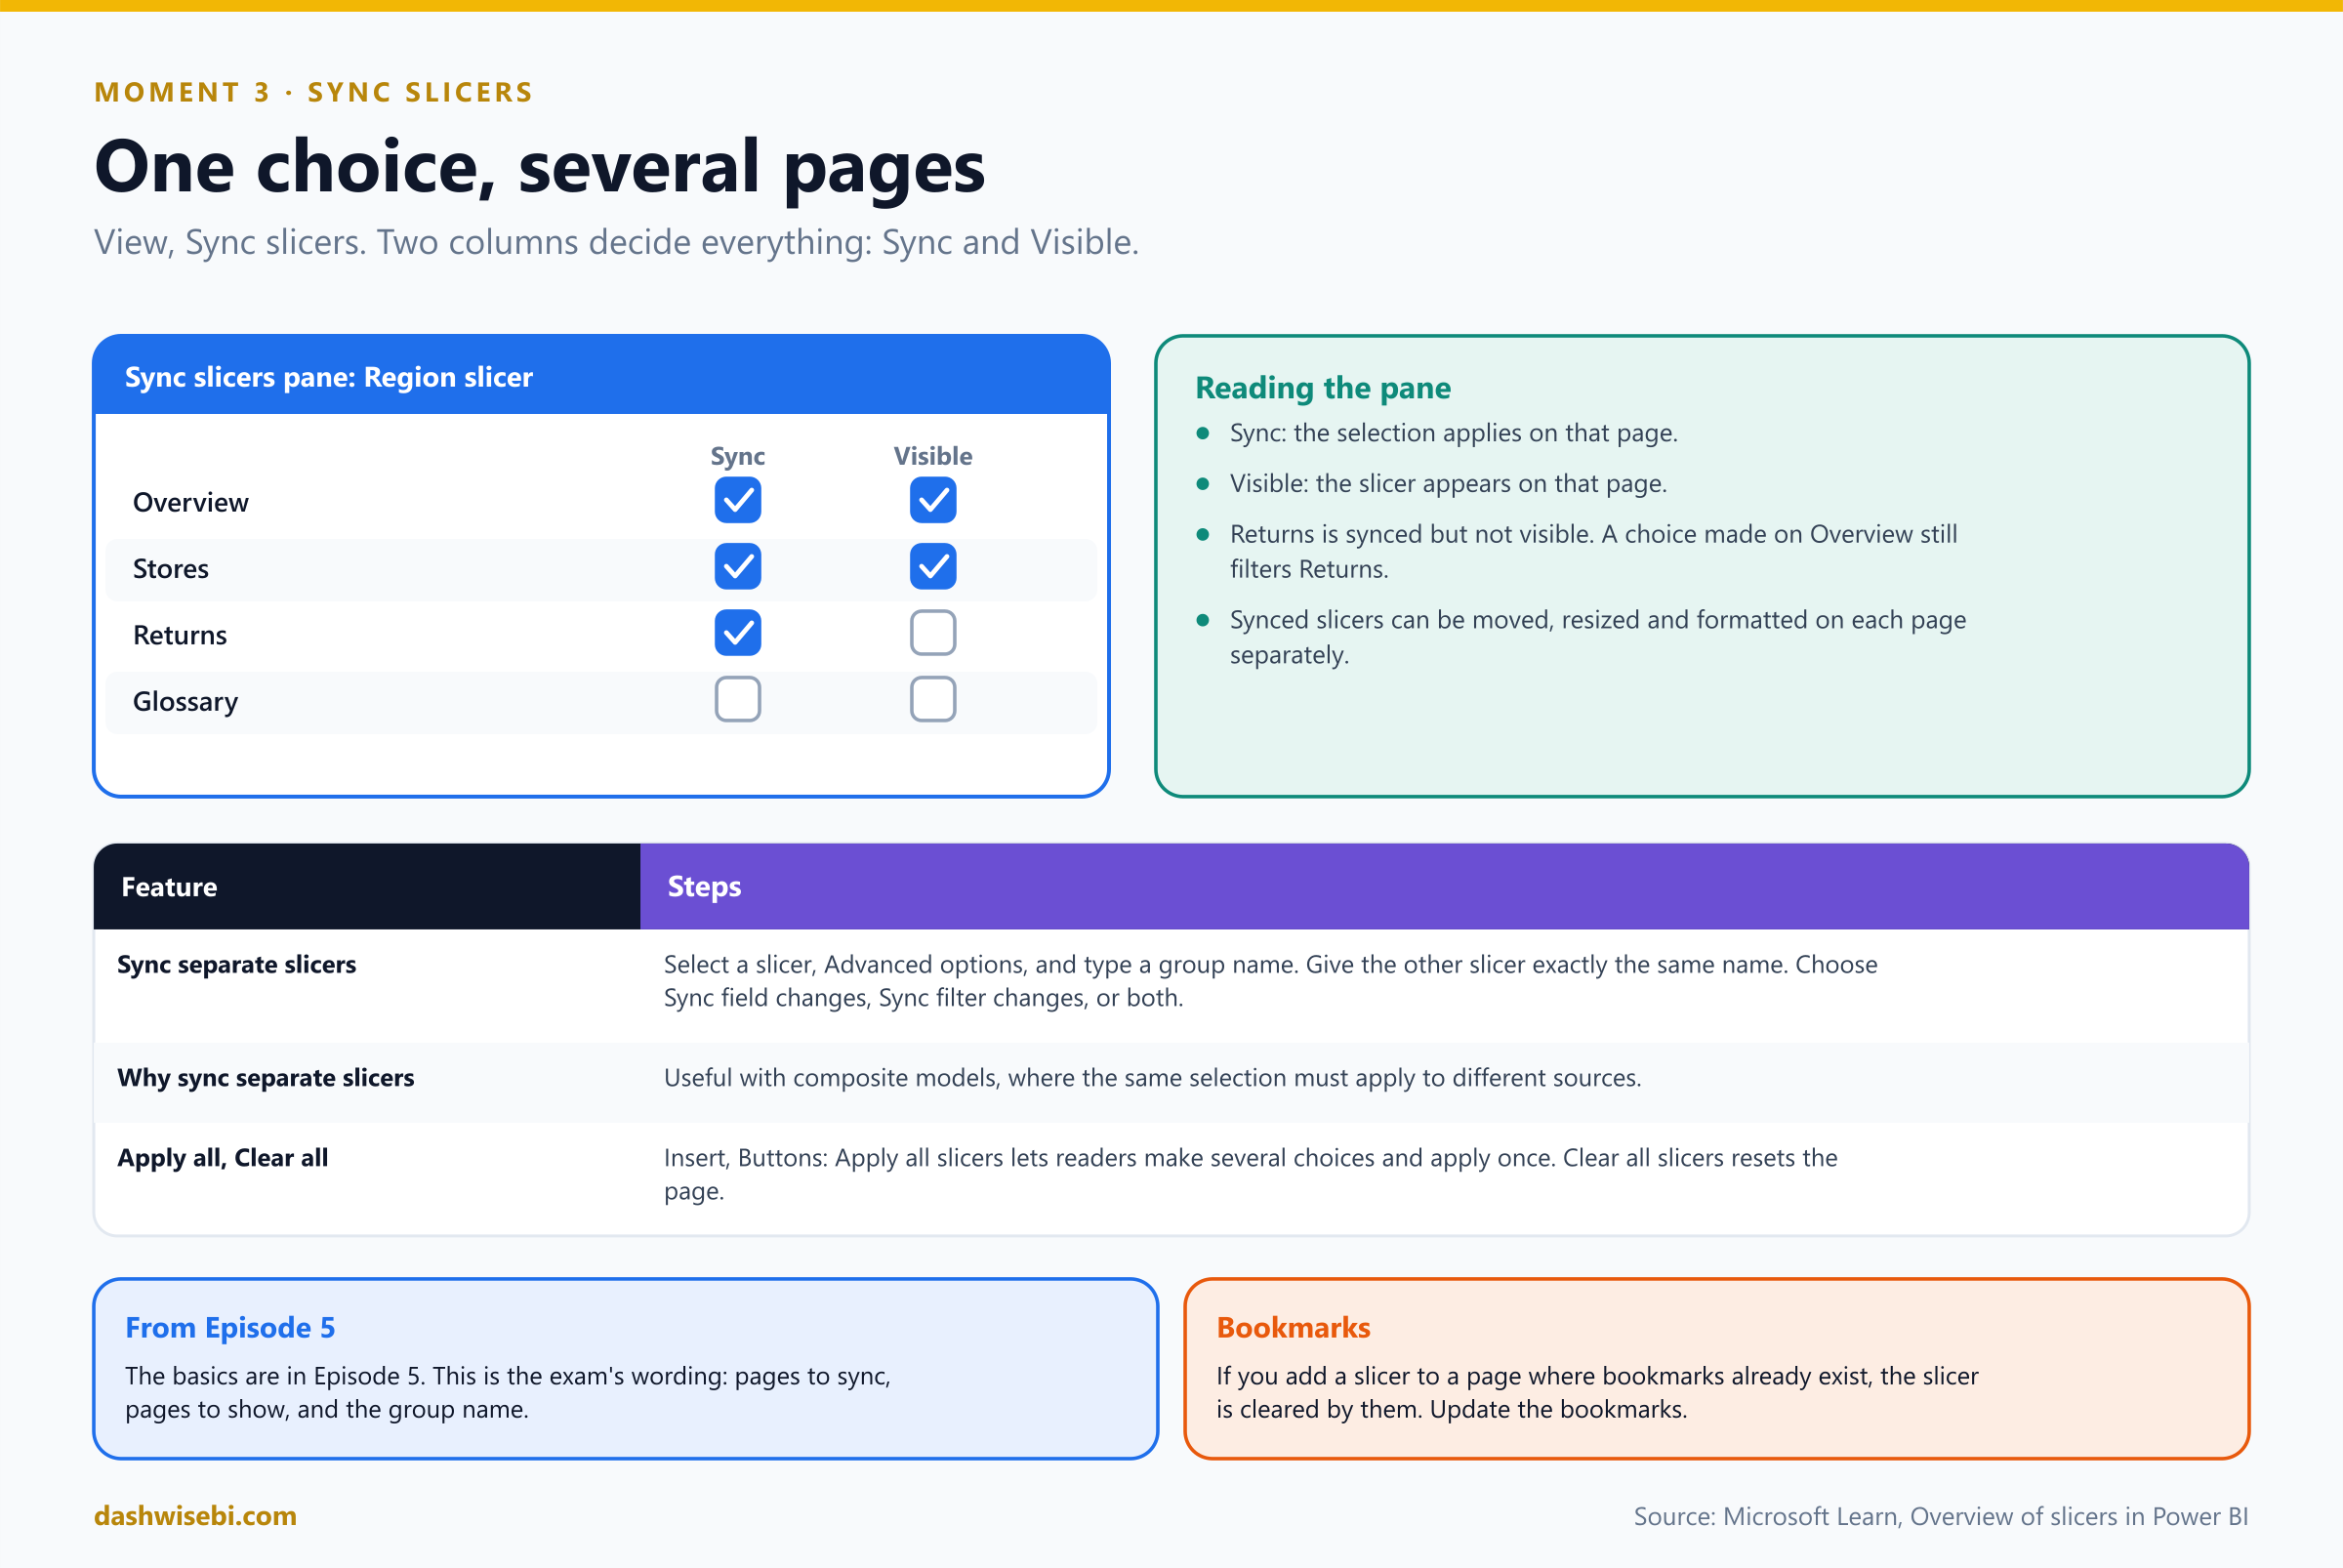
Pause and decide. How do you open the pane, and which two columns matter?
Desktop: View ribbon, Sync slicers. In the service: the View menu. The pane sits between the Filters and Visualizations panes. Select a slicer. In the Sync column tick the pages where the selection must apply. In the Visible column tick the pages where the slicer must appear.
Pause and decide. Region is synced to the Returns page but not visible there. Does it filter Returns?
Yes. If you sync a slicer to a page but do not make it visible, selections made on other pages still filter the data on that page. The slicer can also be moved, resized and formatted on each page independently.
Pause and decide. Two different slicers, from two different tables, must always show the same selection. Can you sync them?
Yes. In the Sync slicers pane expand Advanced options, give the first slicer a group name, and give the second slicer exactly the same name. Then choose Sync field changes to other slicers, Sync filter changes to other slicers, or both. This is useful with composite models, where you want the same selection across sources.
Pause and decide. Sana wants to choose three slicers and then apply them all at once, to avoid a query after each click. What do you add?
Apply all slicers and Clear all slicers buttons: Insert, Buttons. They reduce unnecessary visual queries. Clear all slicers resets every slicer on the page in a single click.
- Slicers do not have to be visible to filter. Hidden or visually tucked away slicers still apply.
- If you add a slicer to a page where bookmarks already exist, the slicer is cleared by them. Update the bookmarks (Moment 8).
Exam lens
- View, Sync slicers. Sync = where the choice applies. Visible = where the slicer is drawn.
- Separate slicers: group name in Advanced options, with the exact same name.
- Apply all and Clear all slicers buttons.
Moment 4. “Hovering tells me nothing”
Sana hovers over the Pune bar. A small box says “Pune, 3.2M”. “And? Is that good? What is the trend? I only have two hands, Rohit.”
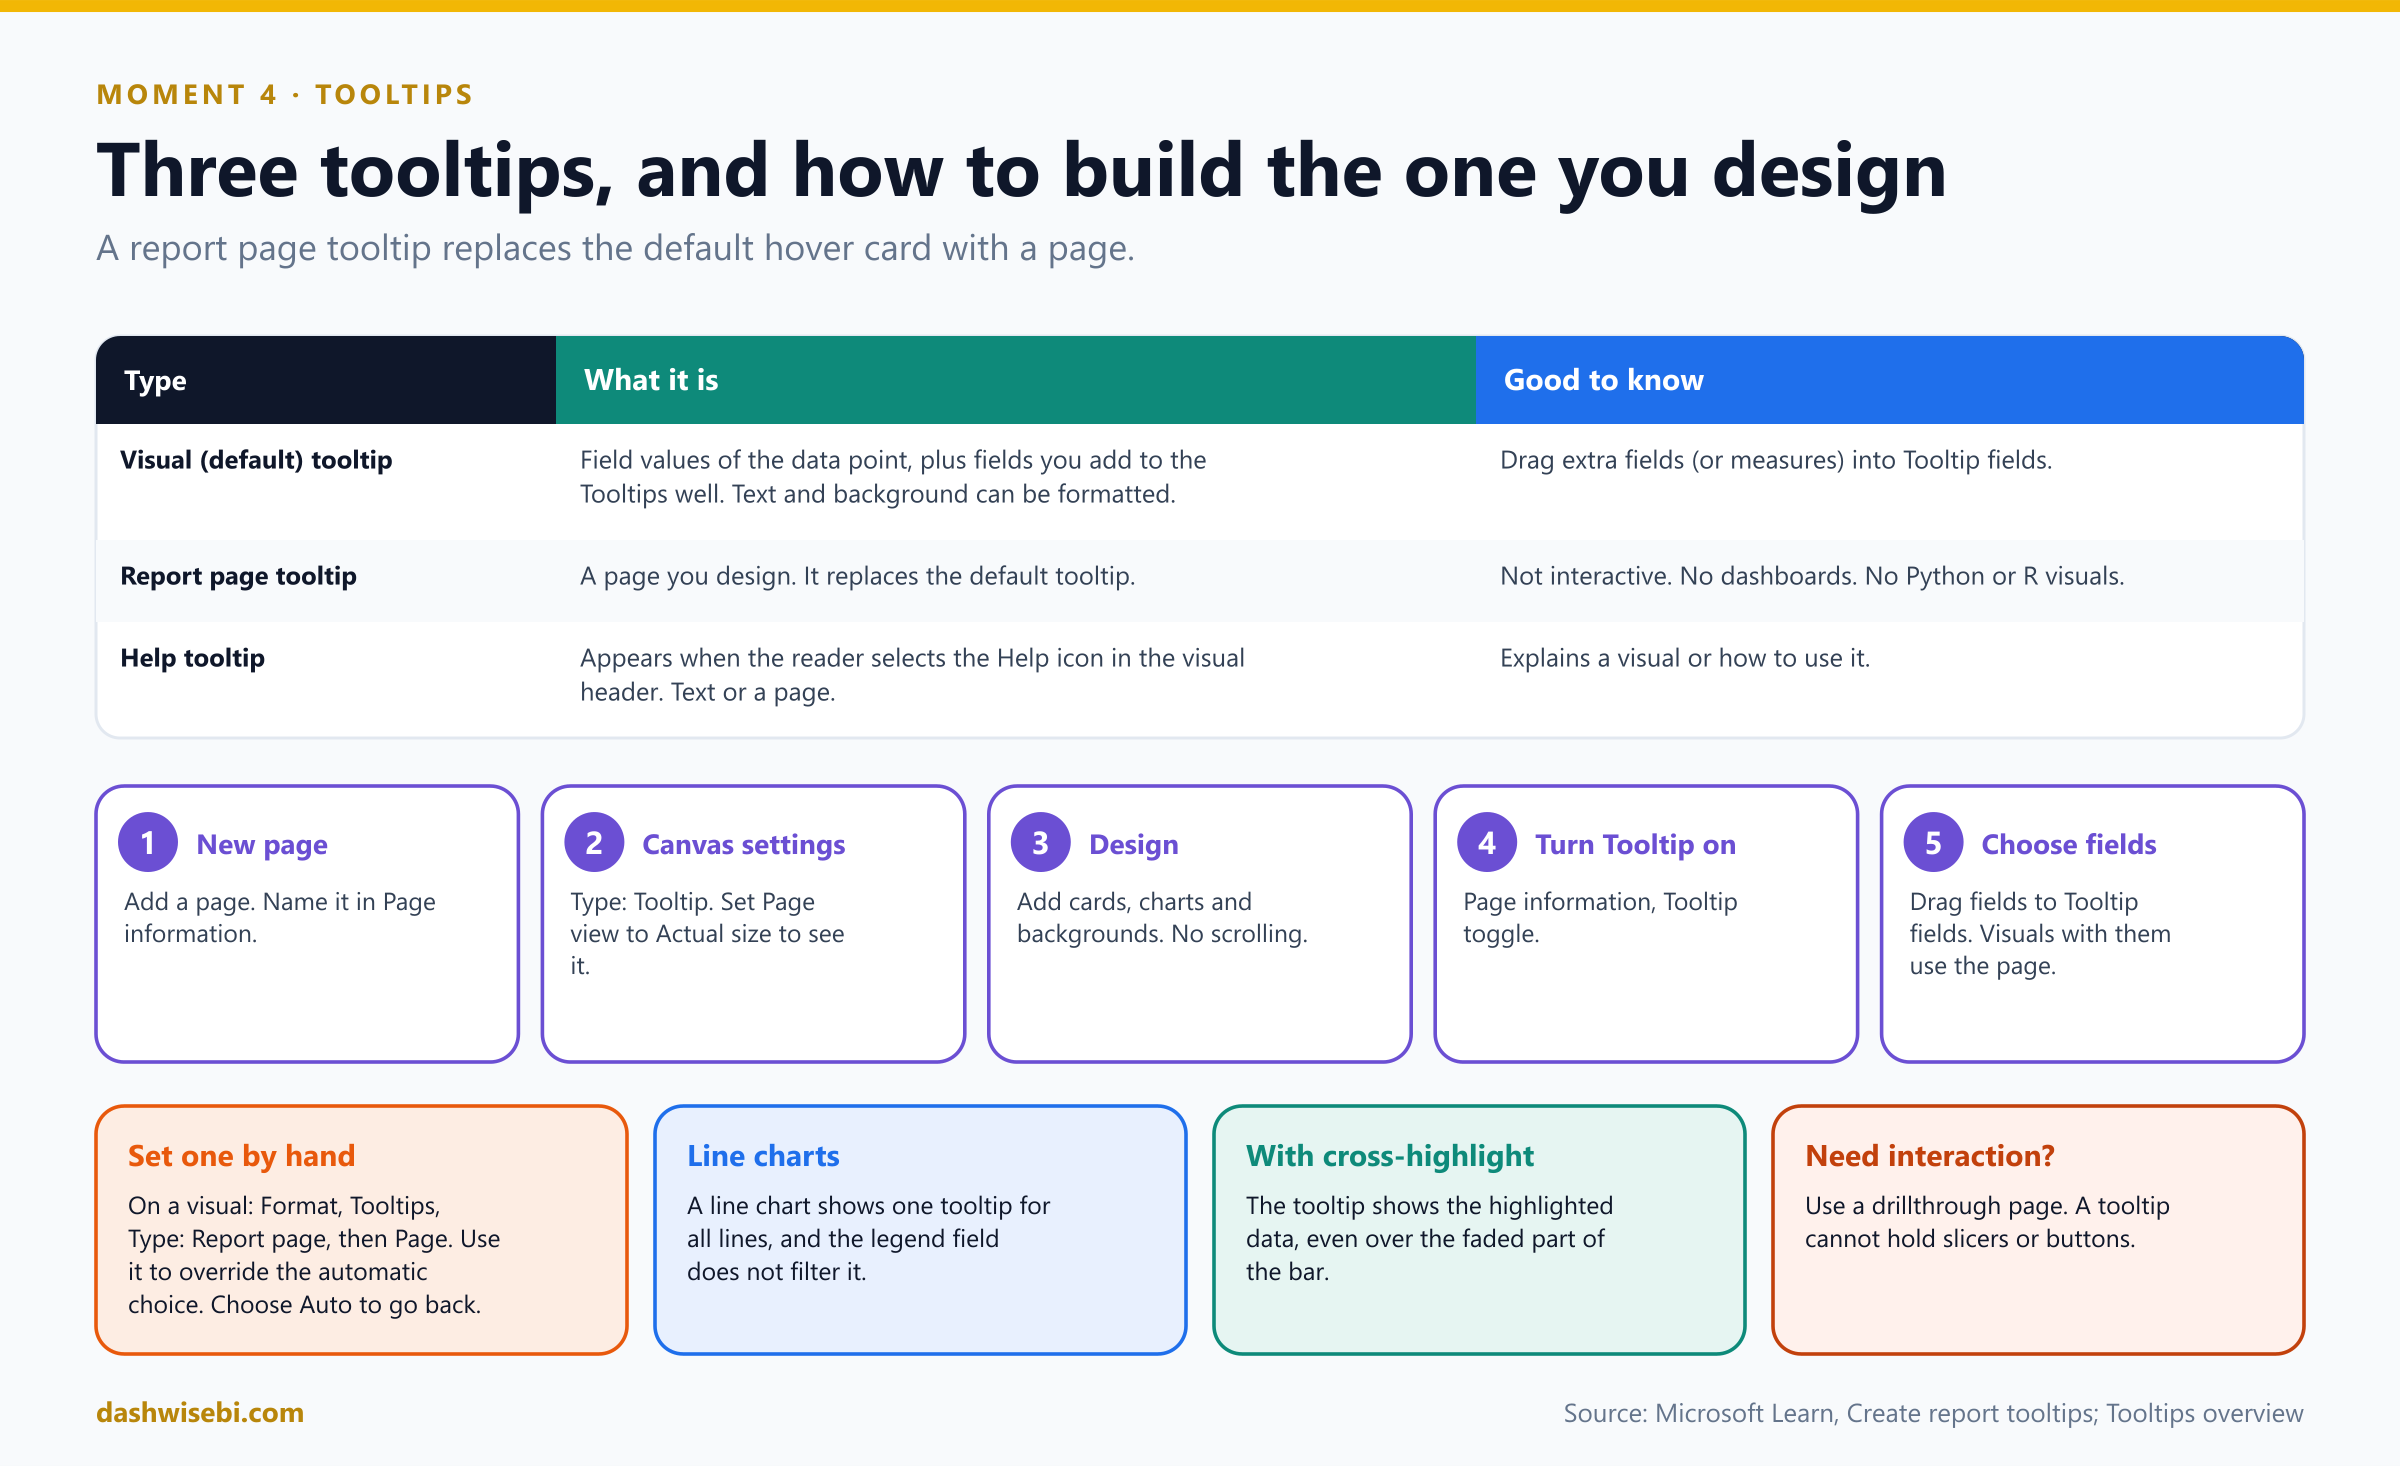
There are three kinds of tooltip, and you can combine them on one visual.
Pause and decide. Which of these is the tooltip Sana sees now, and how do you add a field to it without building a page?
It is the visual (default) tooltip. It shows the field values of the data point. Drag more fields, including measures, into the Tooltip fields bucket of the visual to add them.
Pause and decide. List the steps for a report page tooltip.
(1) Add a new page and name it in Page information. (2) In Canvas settings set the page type to Tooltip. (3) Set Page view to Actual size to see it as readers will. (4) Add the visuals. (5) In Page information turn the Tooltip toggle on. (6) Drag the fields that should trigger it into Tooltip fields. Visuals that contain those fields now show the page instead of the default tooltip.
Pause and decide. A bar chart contains two fields that both have a tooltip page. Which one appears?
Power BI shows only one. To choose which, set it by hand: select the visual, open Format, expand Tooltips, set Type to Report page and pick the Page. Choose Auto in the Page list to revert to the default. Only pages that are set as tooltips appear in the list.
Pause and decide. A teammate puts a slicer and a button on the tooltip page. What happens?
Nothing useful. Report tooltips are not interactive: readers cannot select slicers, tab through content or scroll. Design the page so everything is visible, and use a drillthrough page when you need interaction.
Pause and decide. What is a Help tooltip?
It appears when the reader selects the Help tooltip icon in the visual header. It shows short text or a whole report page that explains the visual or how to interact with it.
Why: details that catch people
- Page tooltips are not supported on dashboards. Python and R visuals do not appear in them, and clusters cannot be tooltip fields.
- A line chart shows one tooltip for all its lines, and the legend field does not filter it.
- With cross-highlighting, the tooltip always shows the highlighted data, even if you hover over the faded part.
- A visual field triggers the tooltip page only when its summarization matches the field you placed in Tooltip fields.
- Screen readers cannot read the content of a report tooltip.
- You can also turn tooltips off for a visual, but a pinned dashboard tile still shows a basic tooltip.
Rohit builds a small tooltip page with two cards and a sparkline. Sana hovers over Pune again and looks at it for a long time. “That,” she says, “is a tooltip.”
Exam lens
- Page tooltip: Tooltip page type, Page information, Tooltip on, Tooltip fields.
- Manual override: Format, Tooltips, Type: Report page. Auto reverts.
- Not interactive. Not on dashboards.
Moment 5. “I want every order for one store”
Sana points at the Pune bar. “I do not want a bigger tooltip. I want a page about Pune. Orders, returns and staffing. Then I want to come back.”
That is drillthrough. It is different from drill mode, which moves through a hierarchy inside a single visual. Drillthrough moves to another page, filtered to the item you chose.
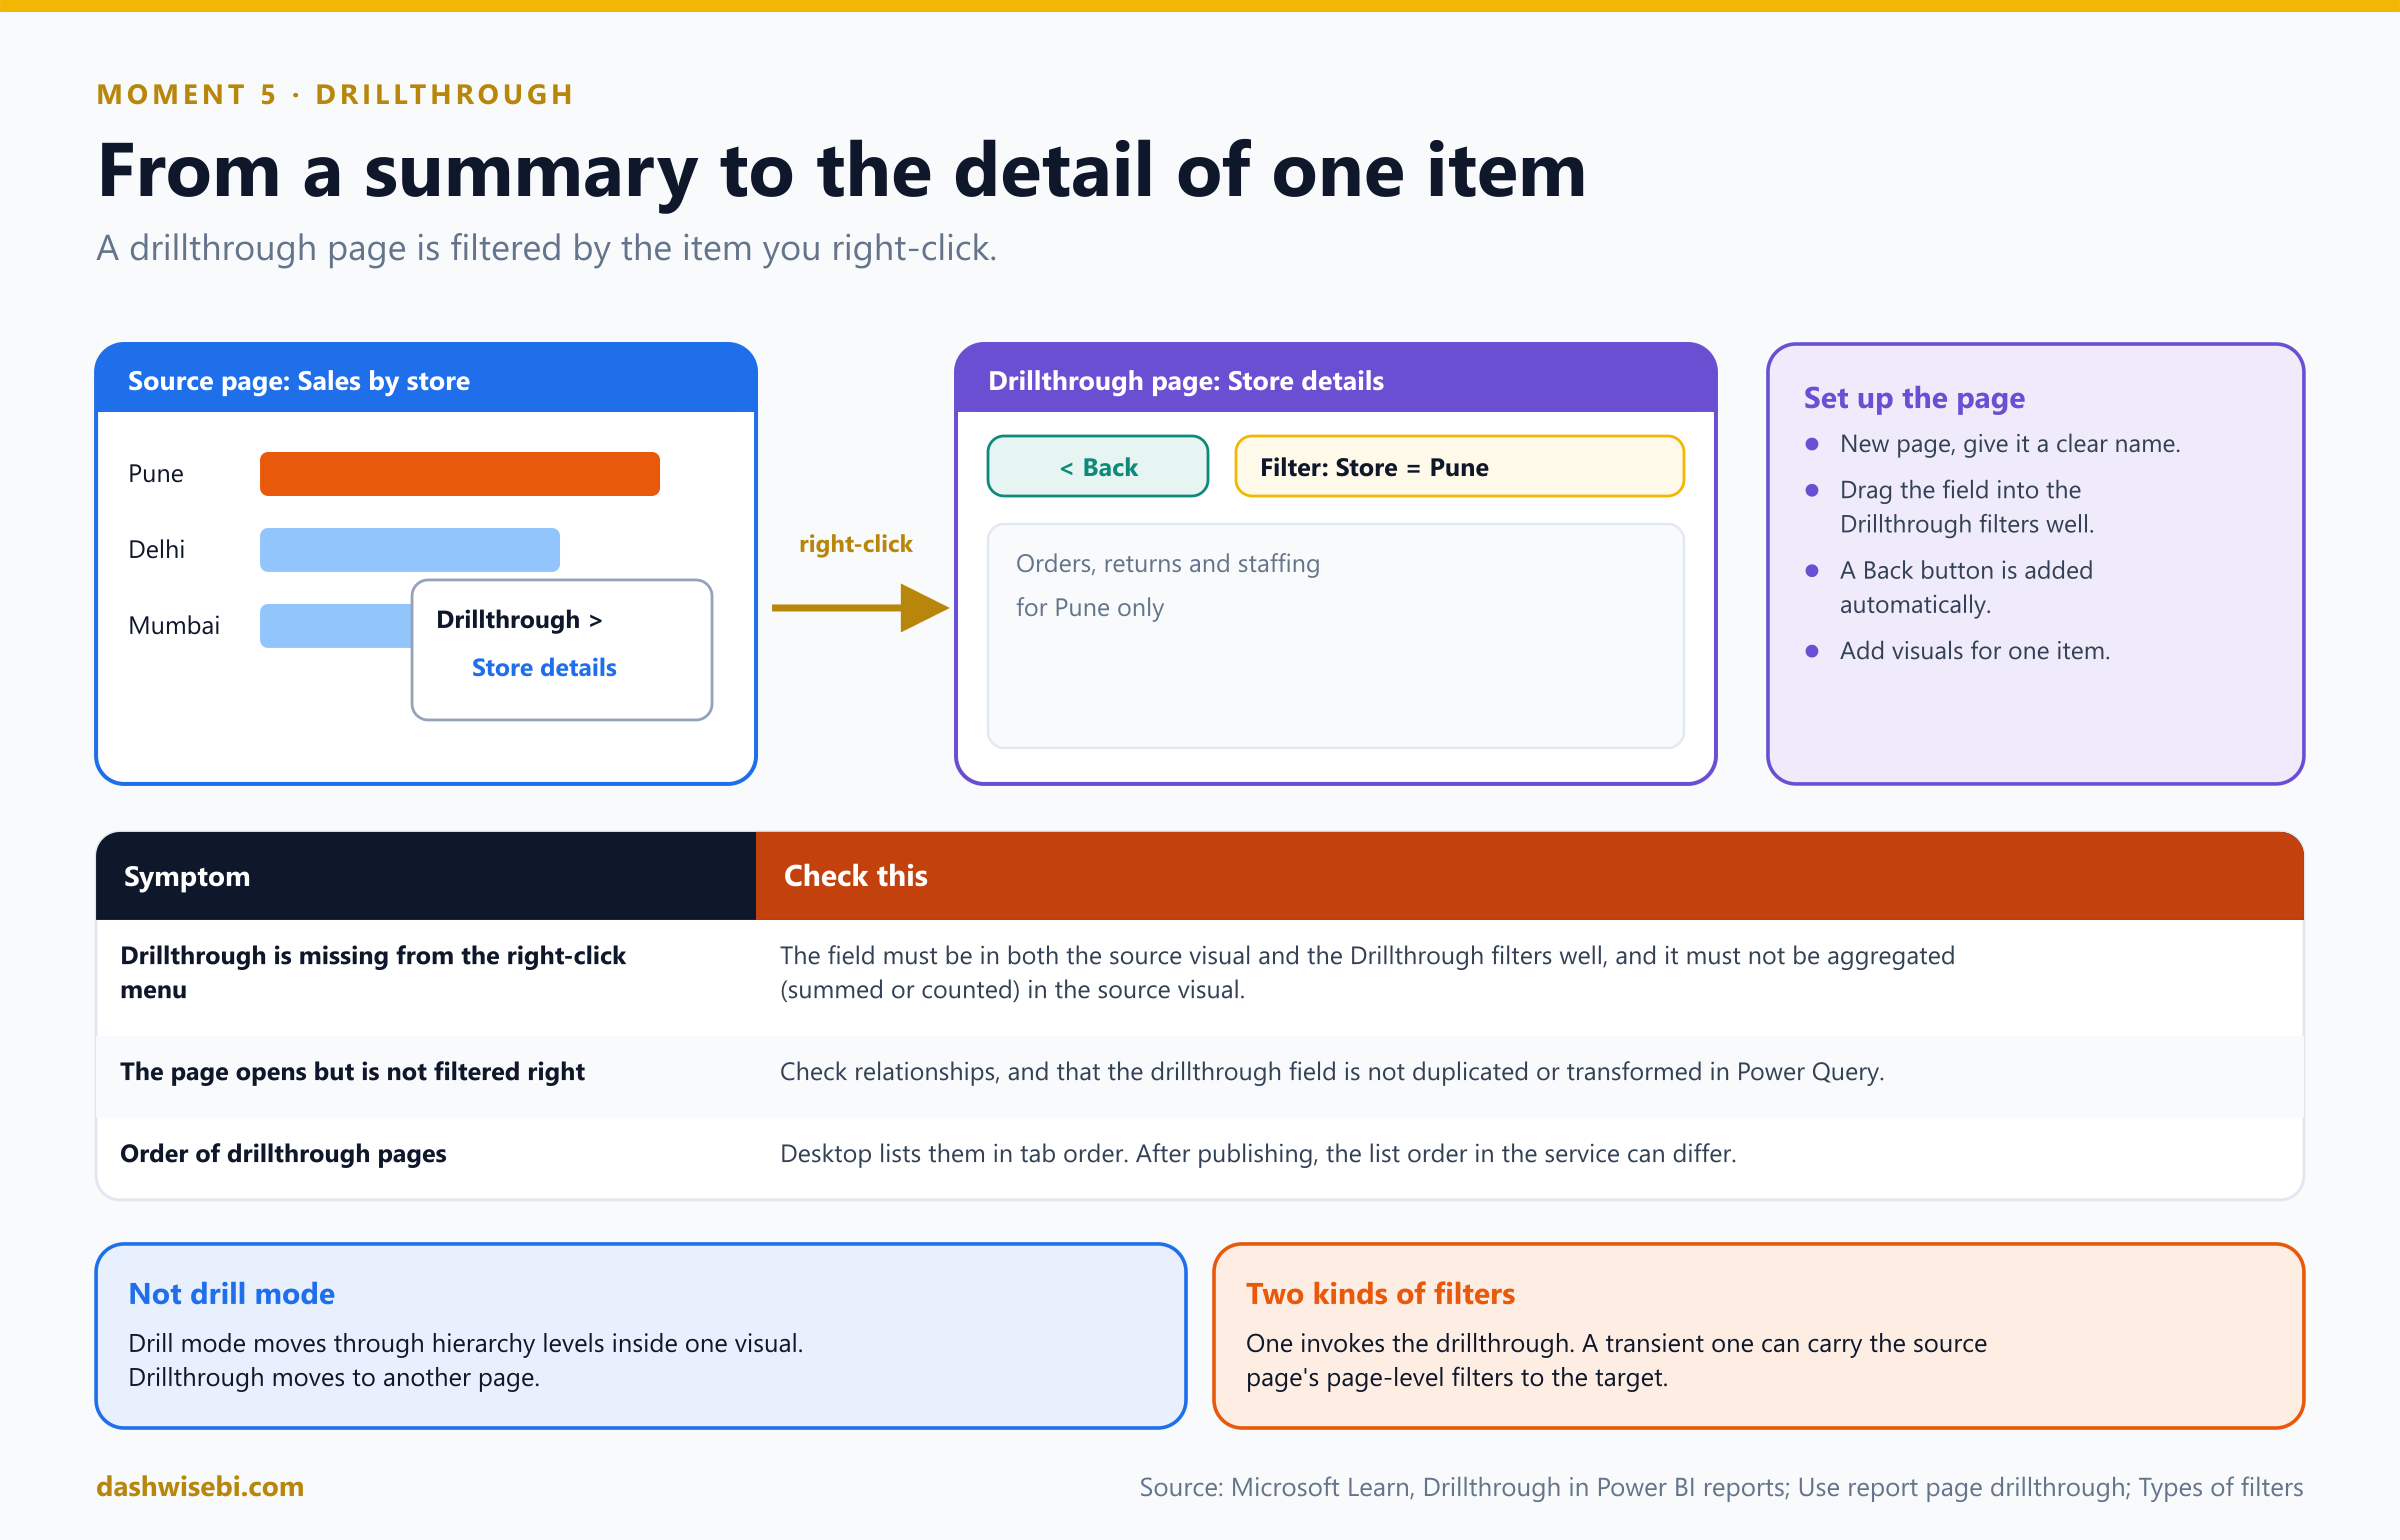
Pause and decide. How do you set up a drillthrough page?
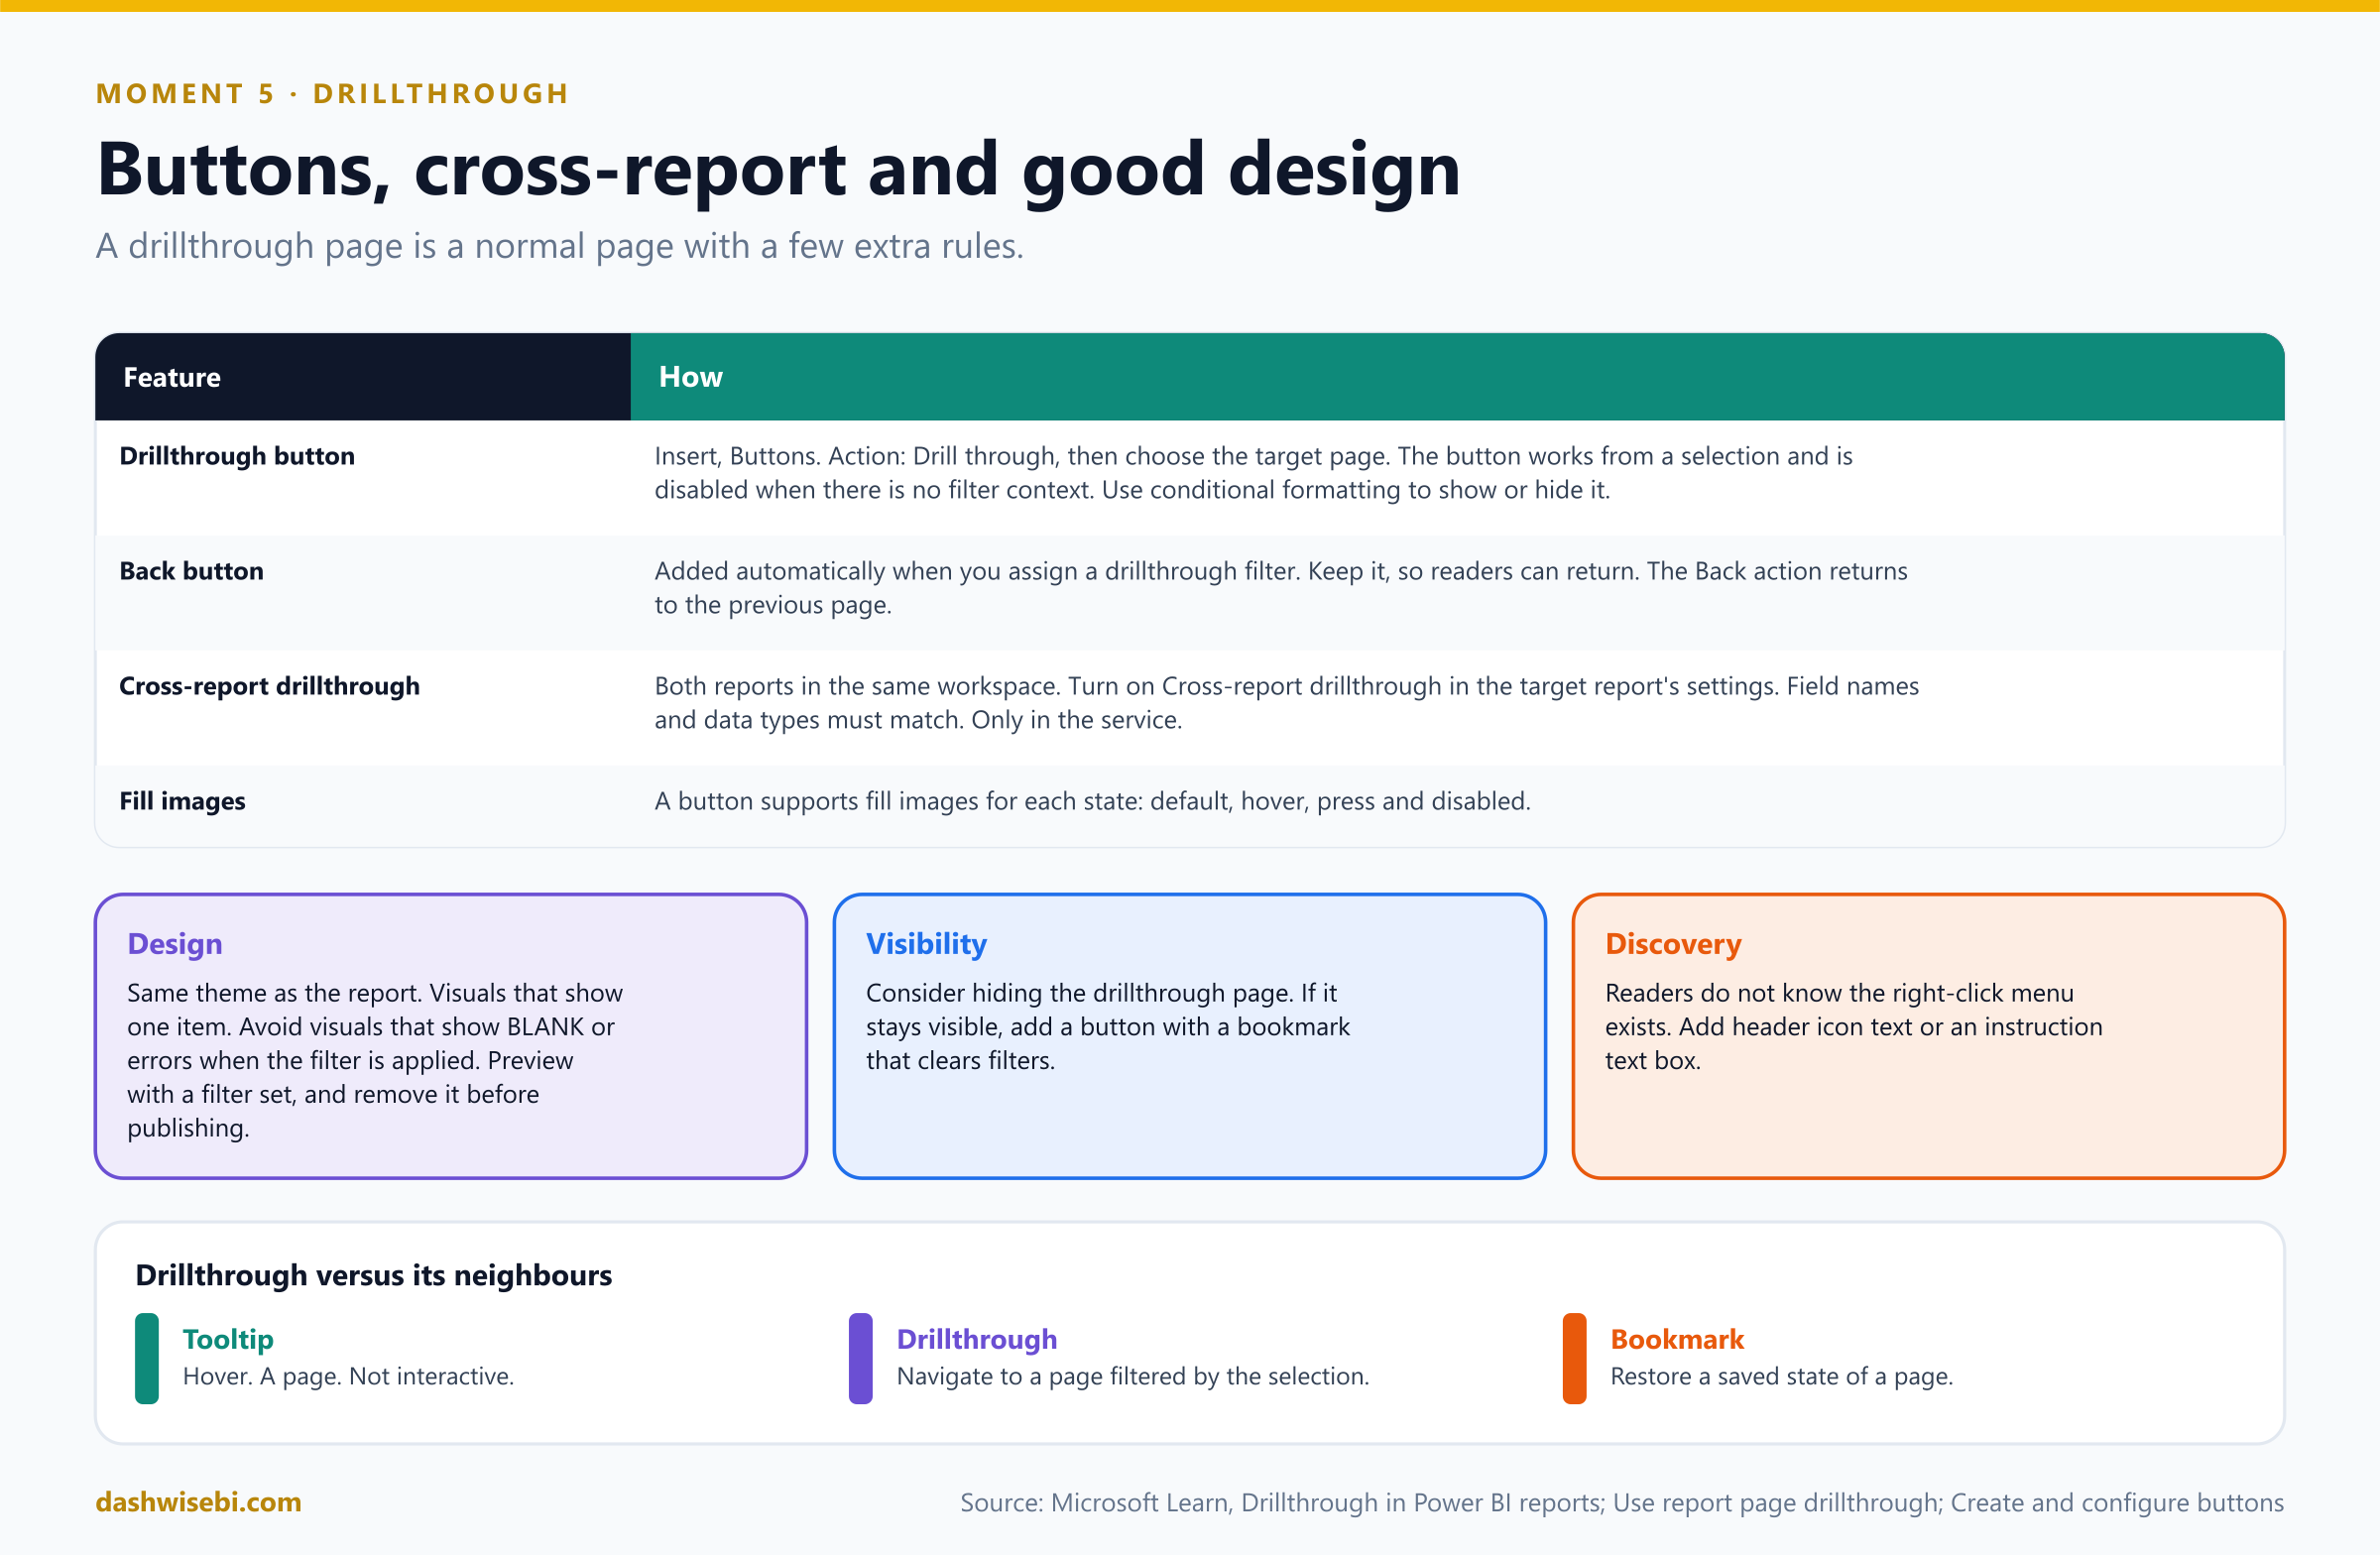
Add a page and give it a clear name. In the Visualizations pane find the Drillthrough section and drag the field (for example Store) into the Drillthrough filters well. Power BI automatically adds a Back button. Then add visuals that show detail for one store. Readers right-click a data point, choose Drillthrough, and pick the page.
Pause and decide. The Drillthrough option is missing when Sana right-clicks a bar. What do you check?
The field must be in the drillthrough filters well of the target page and in the source visual. It must also not be aggregated (summed or counted) in the source visual. Other causes are duplicated or transformed fields in Power Query and relationships that block filter propagation.
Pause and decide. The drillthrough page opens, but Sana loses sight of where she came from. What is the fix?
Keep the Back button that Power BI added automatically. It returns the reader to the source page. A Back action is also available for any button.
Pause and decide. Which filters travel with a drillthrough?
There are two kinds. The first invokes the drillthrough. The second, transient kind carries the page-level filters of the source page to the target. You can edit, delete or clear the transient type but not hide or lock it for end users.
Pause and decide. Sana prefers to click a button than to right-click. What do you configure?
Insert a button, turn Action on, and set the Type to Drill through. Choose the target page. The button works from a selection and can be shown or hidden with conditional formatting. It has a Disabled state, and buttons support fill images for each state.
Pause and decide. Sana wants to drill from a report in one workspace into a different report. Is that possible?
Yes: cross-report drillthrough. Both reports must be in the same workspace. Turn on Cross-report drillthrough in the target report's settings. Field names and data types must match. It is supported only in the Power BI service.
Why: design the target page for one item
- Style it like the rest of the report. Preview with a drillthrough filter set while you design, and remove that filter before you publish.
- Avoid visuals that show BLANK or errors when the filter is applied.
- Visibility. Consider hiding the page. If it stays visible, add a button with a bookmark that clears the filters.
- Discovery. Readers do not know the right-click menu. Use header icon text or an instruction text box.
- In Desktop the drillthrough menu lists pages in tab order. After publishing, the order in the service can differ.
Sana right-clicks Pune, selects Store details and lands on a page with only Pune's numbers. She clicks Back and is home. “I would marry this button,” she mutters.
Exam lens
- Drillthrough filters well on the target page. Field not aggregated in the source. Back button is automatic.
- Drill through button action. Cross-report: same workspace, setting on, matching fields.
- Drill mode = within a visual. Drillthrough = to another page.
Moment 6. “Where do I click to get to Returns?”
Sana looks for the Returns page. The page tabs are at the bottom of the window, and she is in a browser in presentation mode, where she cannot see them. She hovers over everything.
Navigation inside the report is made with buttons and navigators. A button needs its Action turned on, and the Type says what it does.
Pause and decide. Name the action types you can give a button.
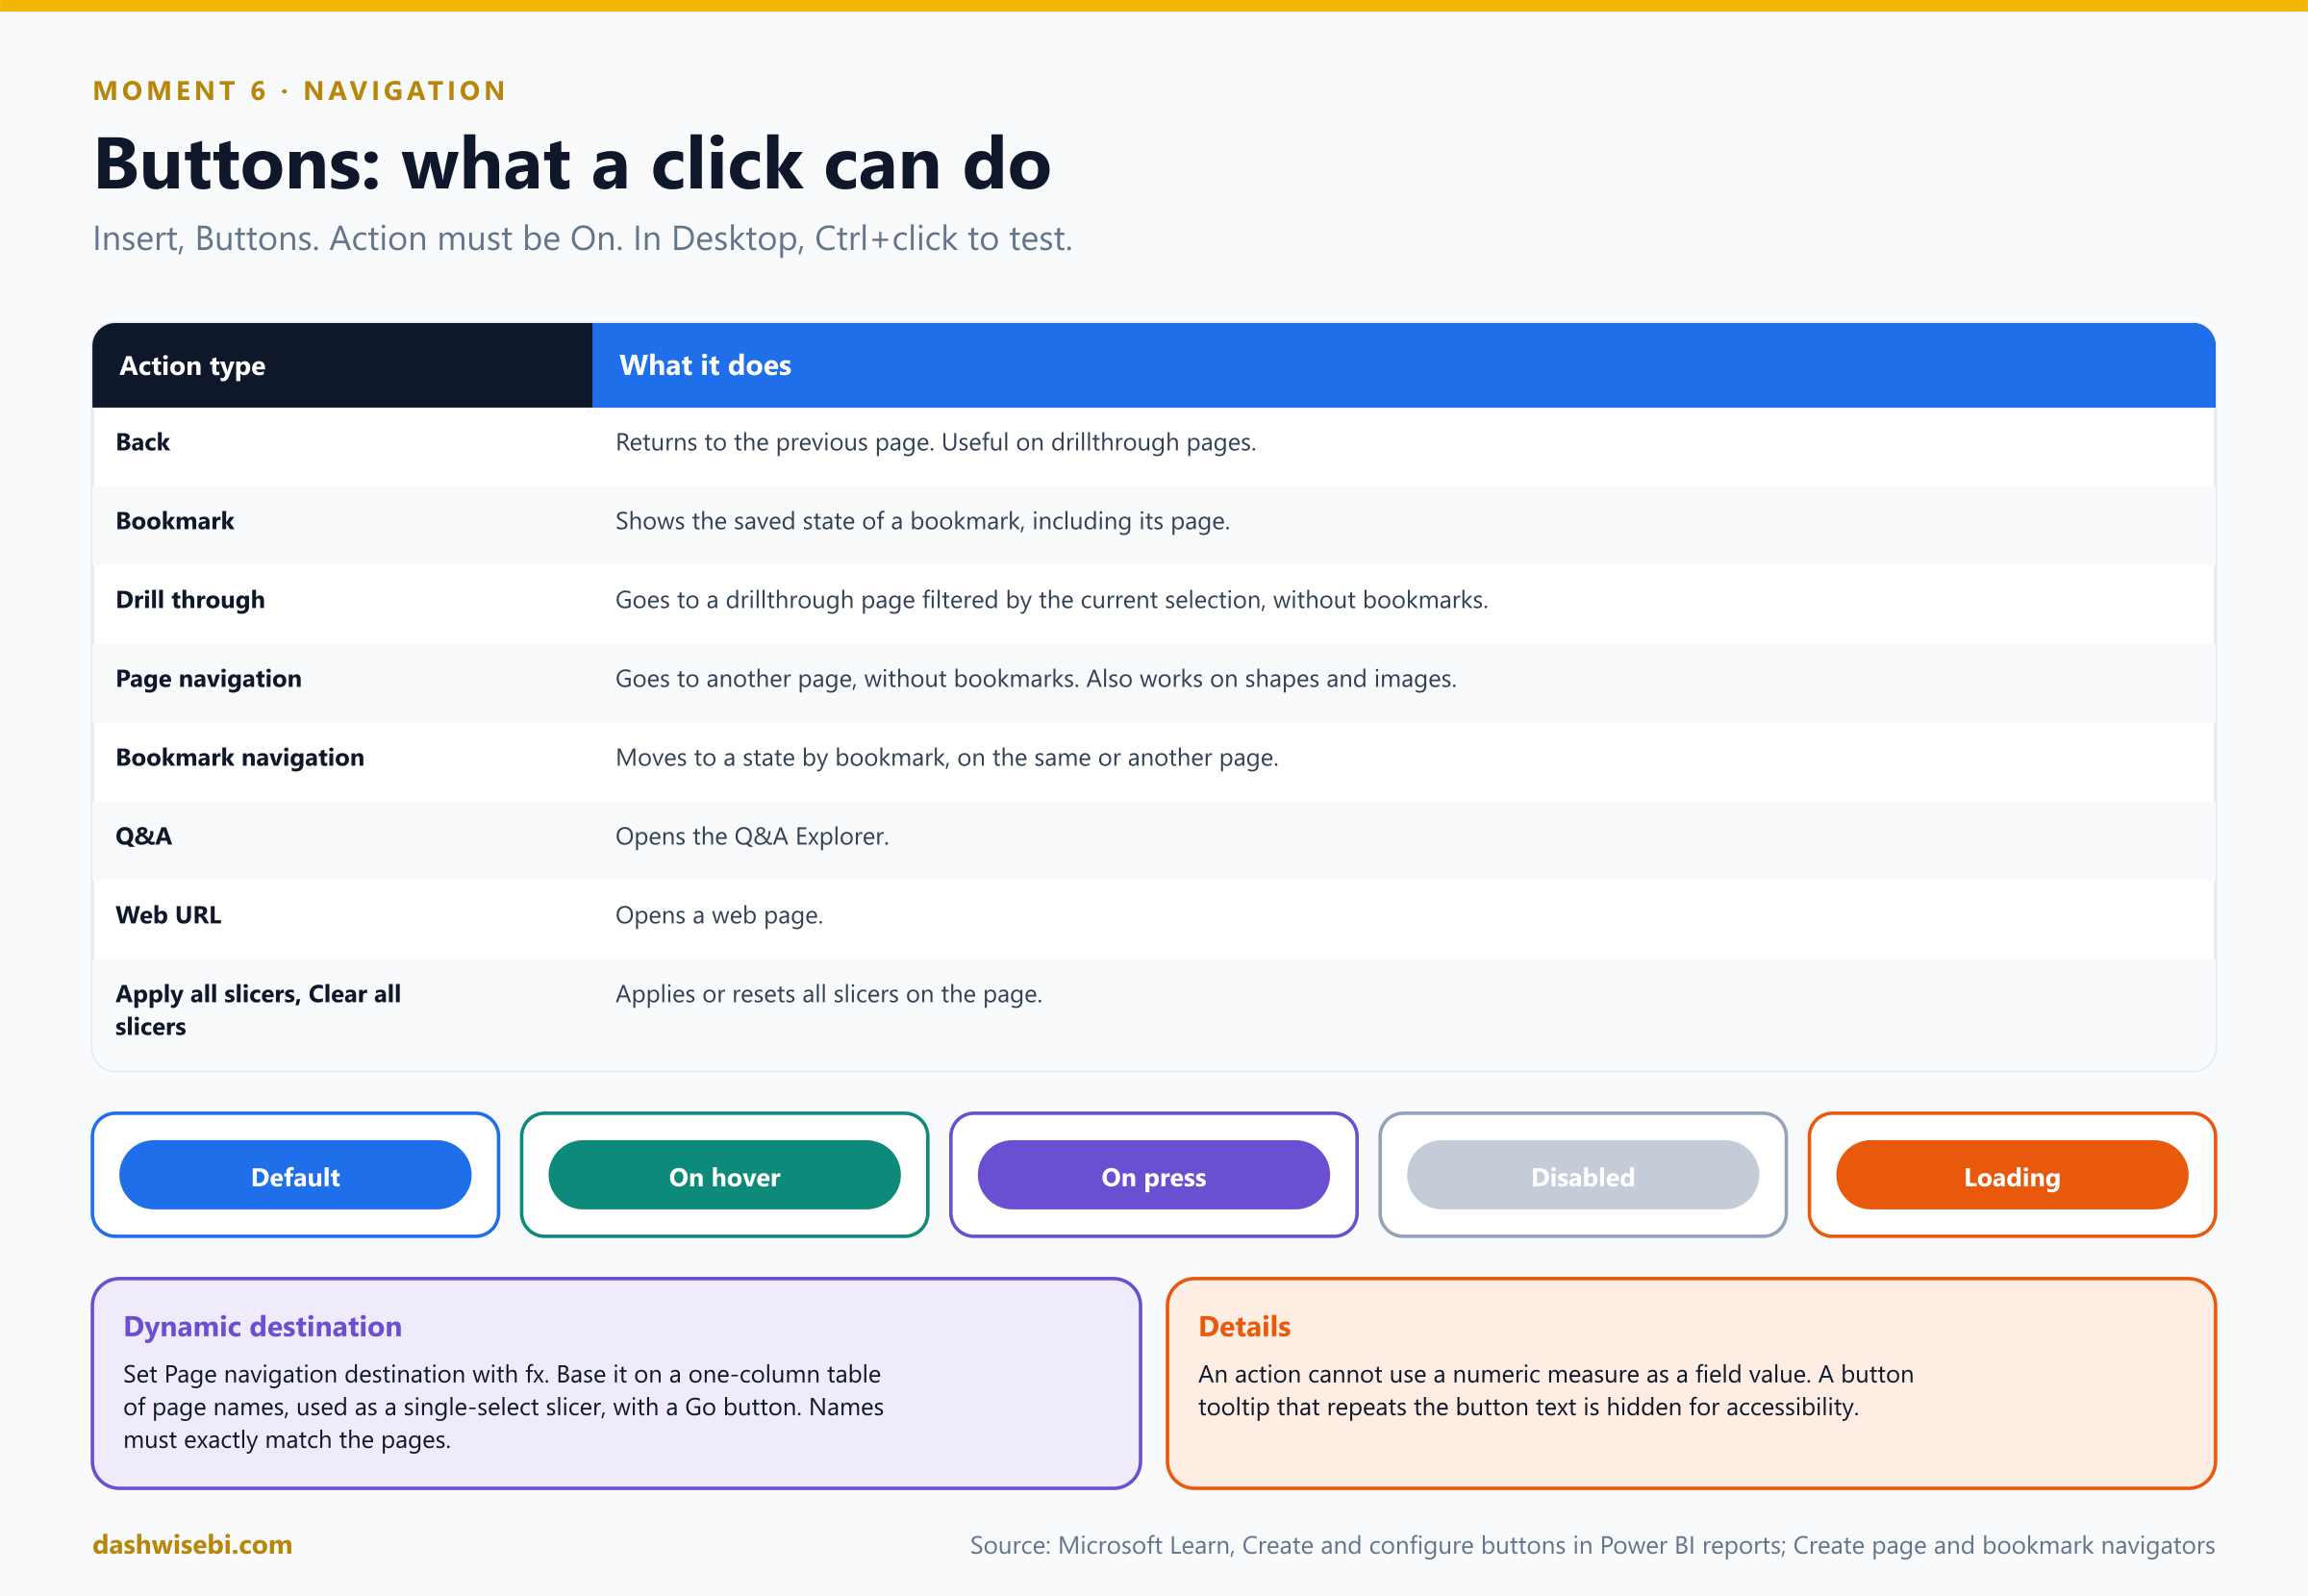
Back, Bookmark, Drill through, Page navigation, Bookmark navigation, Q&A, Web URL, and Apply all slicers and Clear all slicers. (A Data function action also exists with a preview feature.)
Pause and decide. You build a button that goes to the Returns page. The simplest configuration?
Insert, Buttons, then Blank. On the Button tab turn Action on, set the Type to Page navigation and the Destination to the Returns page. This needs no bookmark. Shapes and images support page navigation too.
Pause and decide. How do you test the button in Desktop?
Press Ctrl and select the button. In Reading view, in the service, just select it.
Pause and decide. A button should look different when hovered, pressed or when it cannot be used. Where?
On the Button tab of the Format pane, expand Shape or Style, and under Apply settings to choose the State: Default, On hover, On press, Disabled. (There is also a Loading state for data functions.)
Pause and decide. Sana wants a dropdown to pick a destination and a Go button. How do you set the destination?
Create a one-column table of page names (Enter data) and use it as a single-select slicer. On the button set Type to Page navigation and, for Destination, select the fx (conditional formatting) icon and base it on the table column. The names must exactly match the page names.
Pause and decide. The report has 12 pages, and you do not want 12 hand-made buttons. What do you insert?
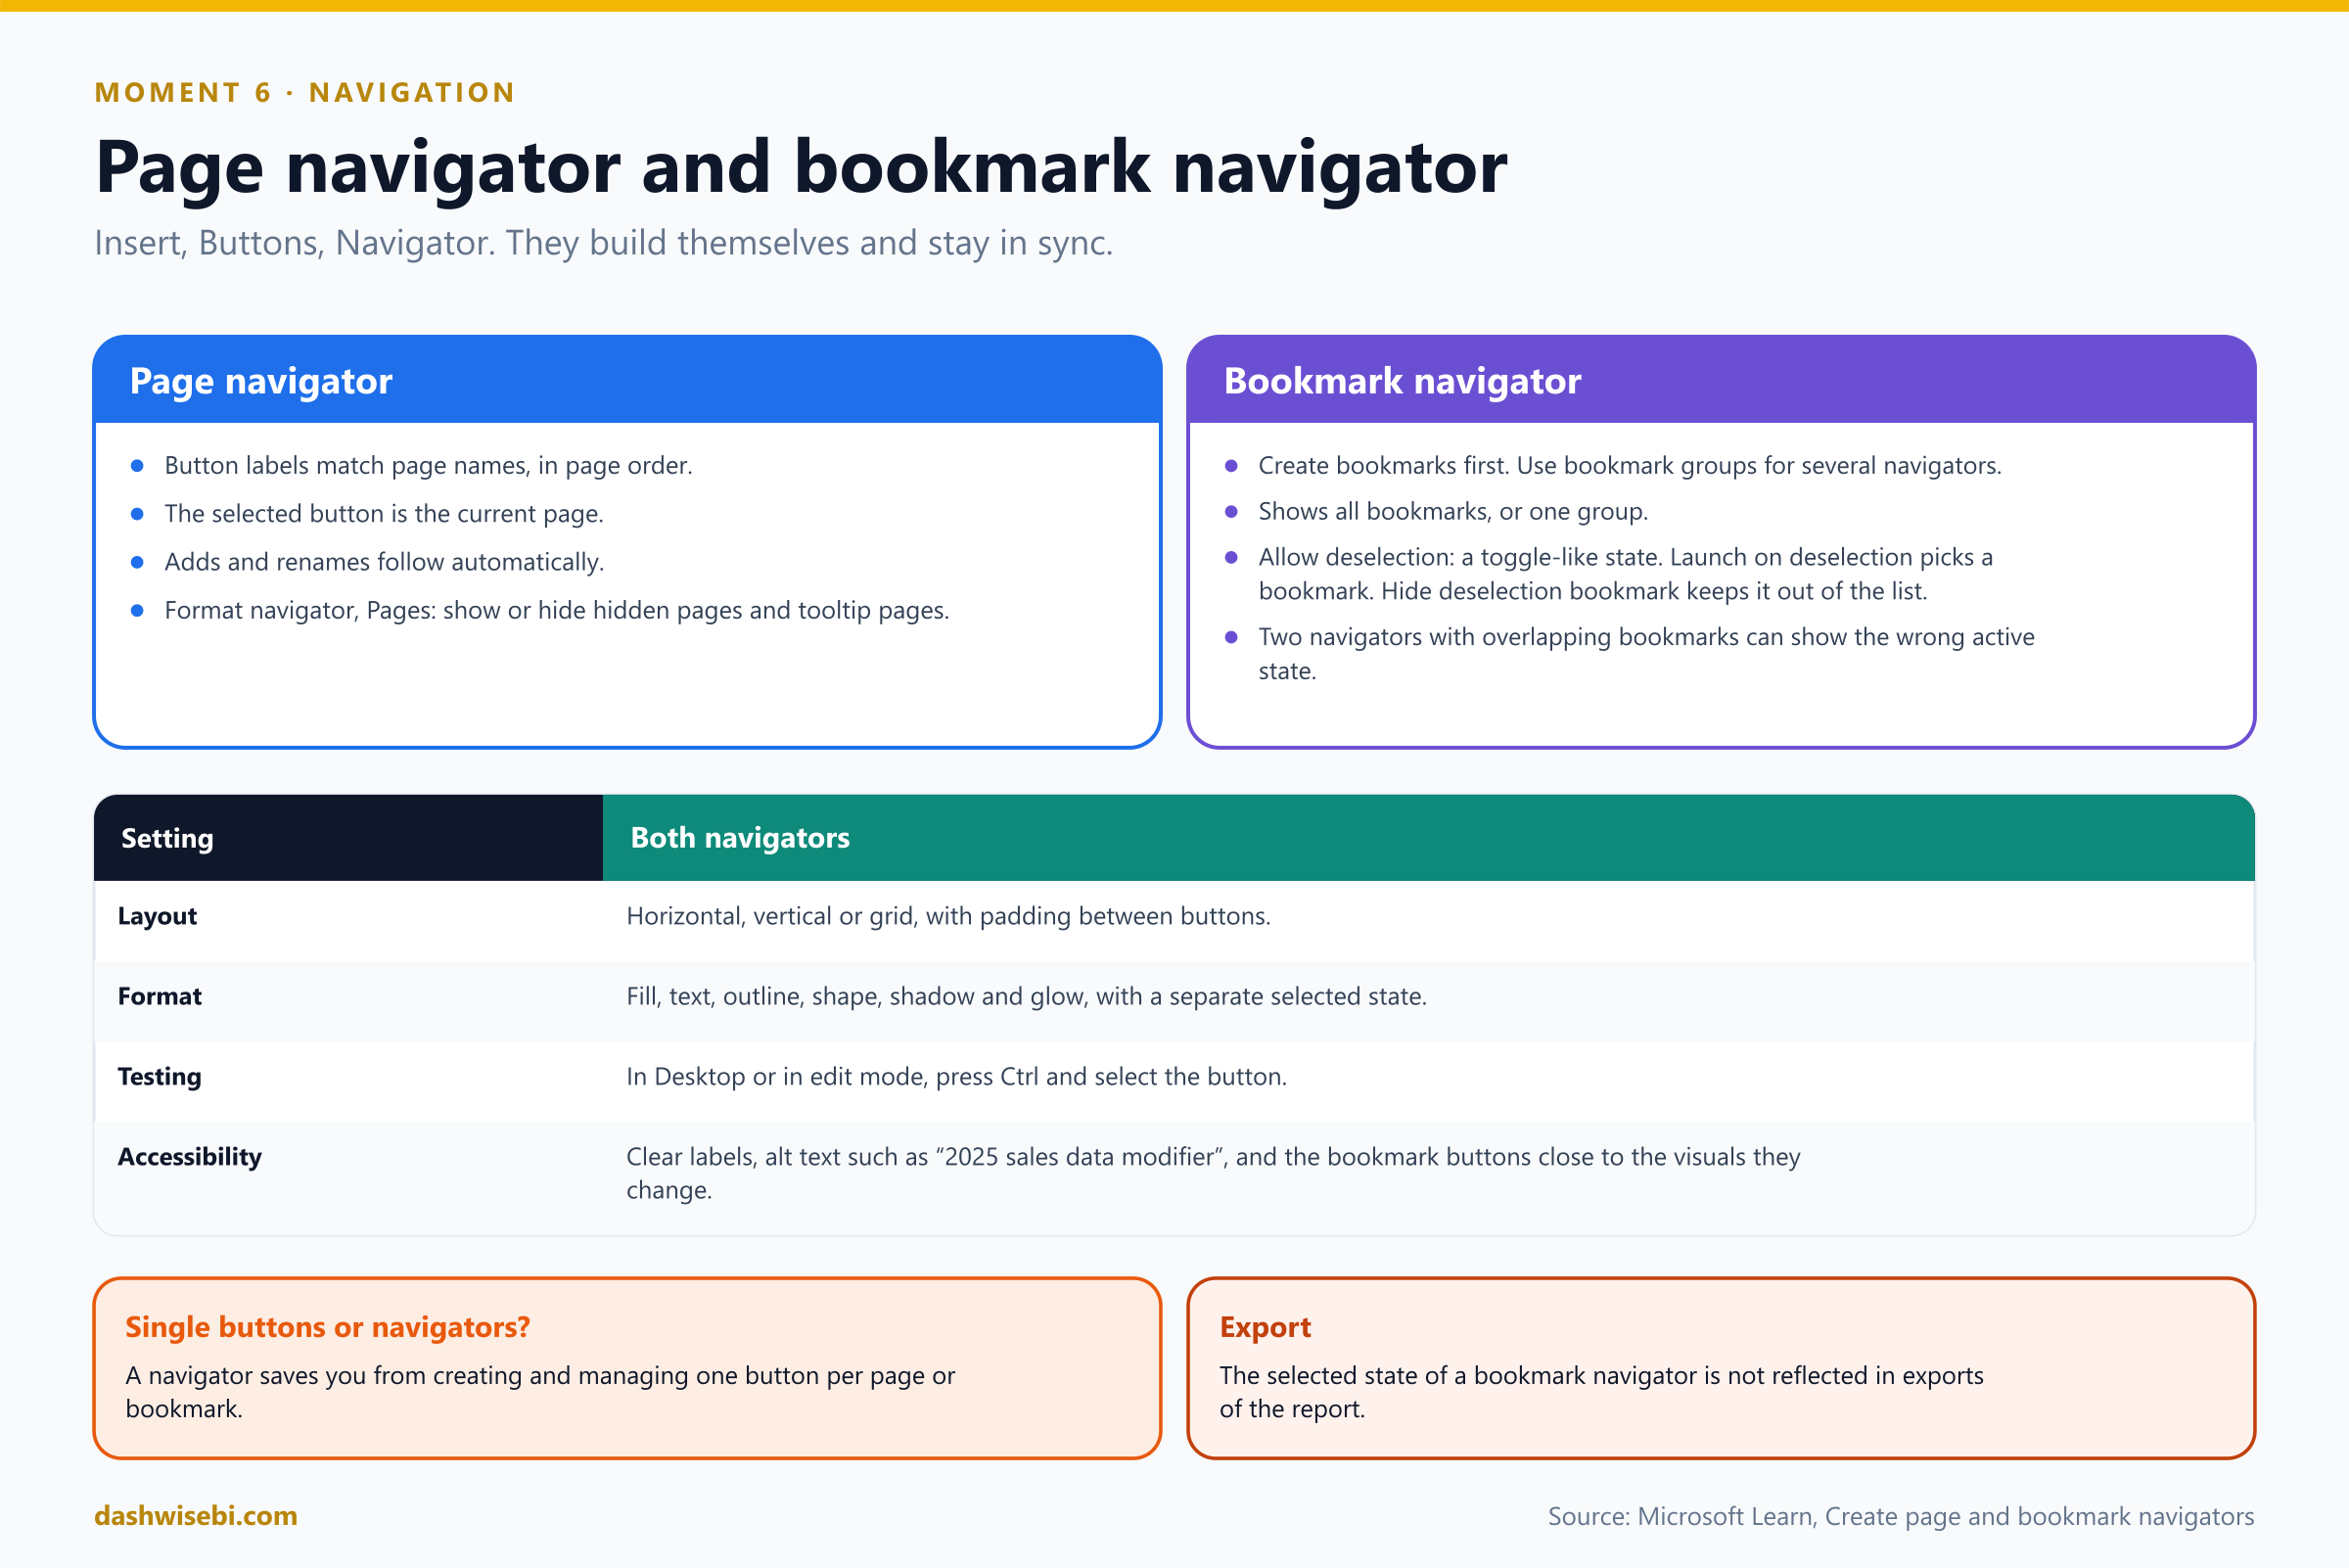
A page navigator: Insert, Buttons, Navigator, Page navigator. It builds the buttons for you. Labels match page names, order matches page order, the selected button is the current page, and it updates when pages are added, removed or renamed. In the Format navigator pane, Pages, you can show or hide hidden pages and tooltip pages.
Pause and decide. What does a bookmark navigator need before you can create it, and what does Allow deselection do?
You need bookmarks first, and separate bookmark groups if you plan more than one navigator. Allow deselection lets users deselect all buttons, for a toggle-like experience. Launch on deselection chooses the bookmark to go to then, and Hide deselection bookmark keeps it out of the list.
- Navigators can be laid out horizontally, vertically or in a grid, and have a separate selected state format.
- Two bookmark navigators that control overlapping settings can show an active bookmark that does not match what is applied, because a report has only one active bookmark.
- For accessibility: clear labels, alt text for the navigator, and buttons close to the visuals they change.
A row of tabs now sits across the top of every page: Overview, Stores, Returns, Glossary. Sana finds Returns in one click.
Exam lens
- Action type list. Page navigation needs no bookmark. Ctrl+click to test.
- Page navigator syncs with page names and order. Bookmark navigator uses bookmarks or a group.
- Dynamic destination: fx on a table column, names must match exactly.
Moment 7. “The page is crowded. Can some things hide?”
Sana now has seven slicers, three charts, a legend and a title on one page. “I feel like I am standing in a market,” she says.
The Selection pane (View, Selection) lists every object on the current page, in layers. It is where you name, group, layer and hide things.
Pause and decide. How do you group a title, a logo and a subtitle so they move together?
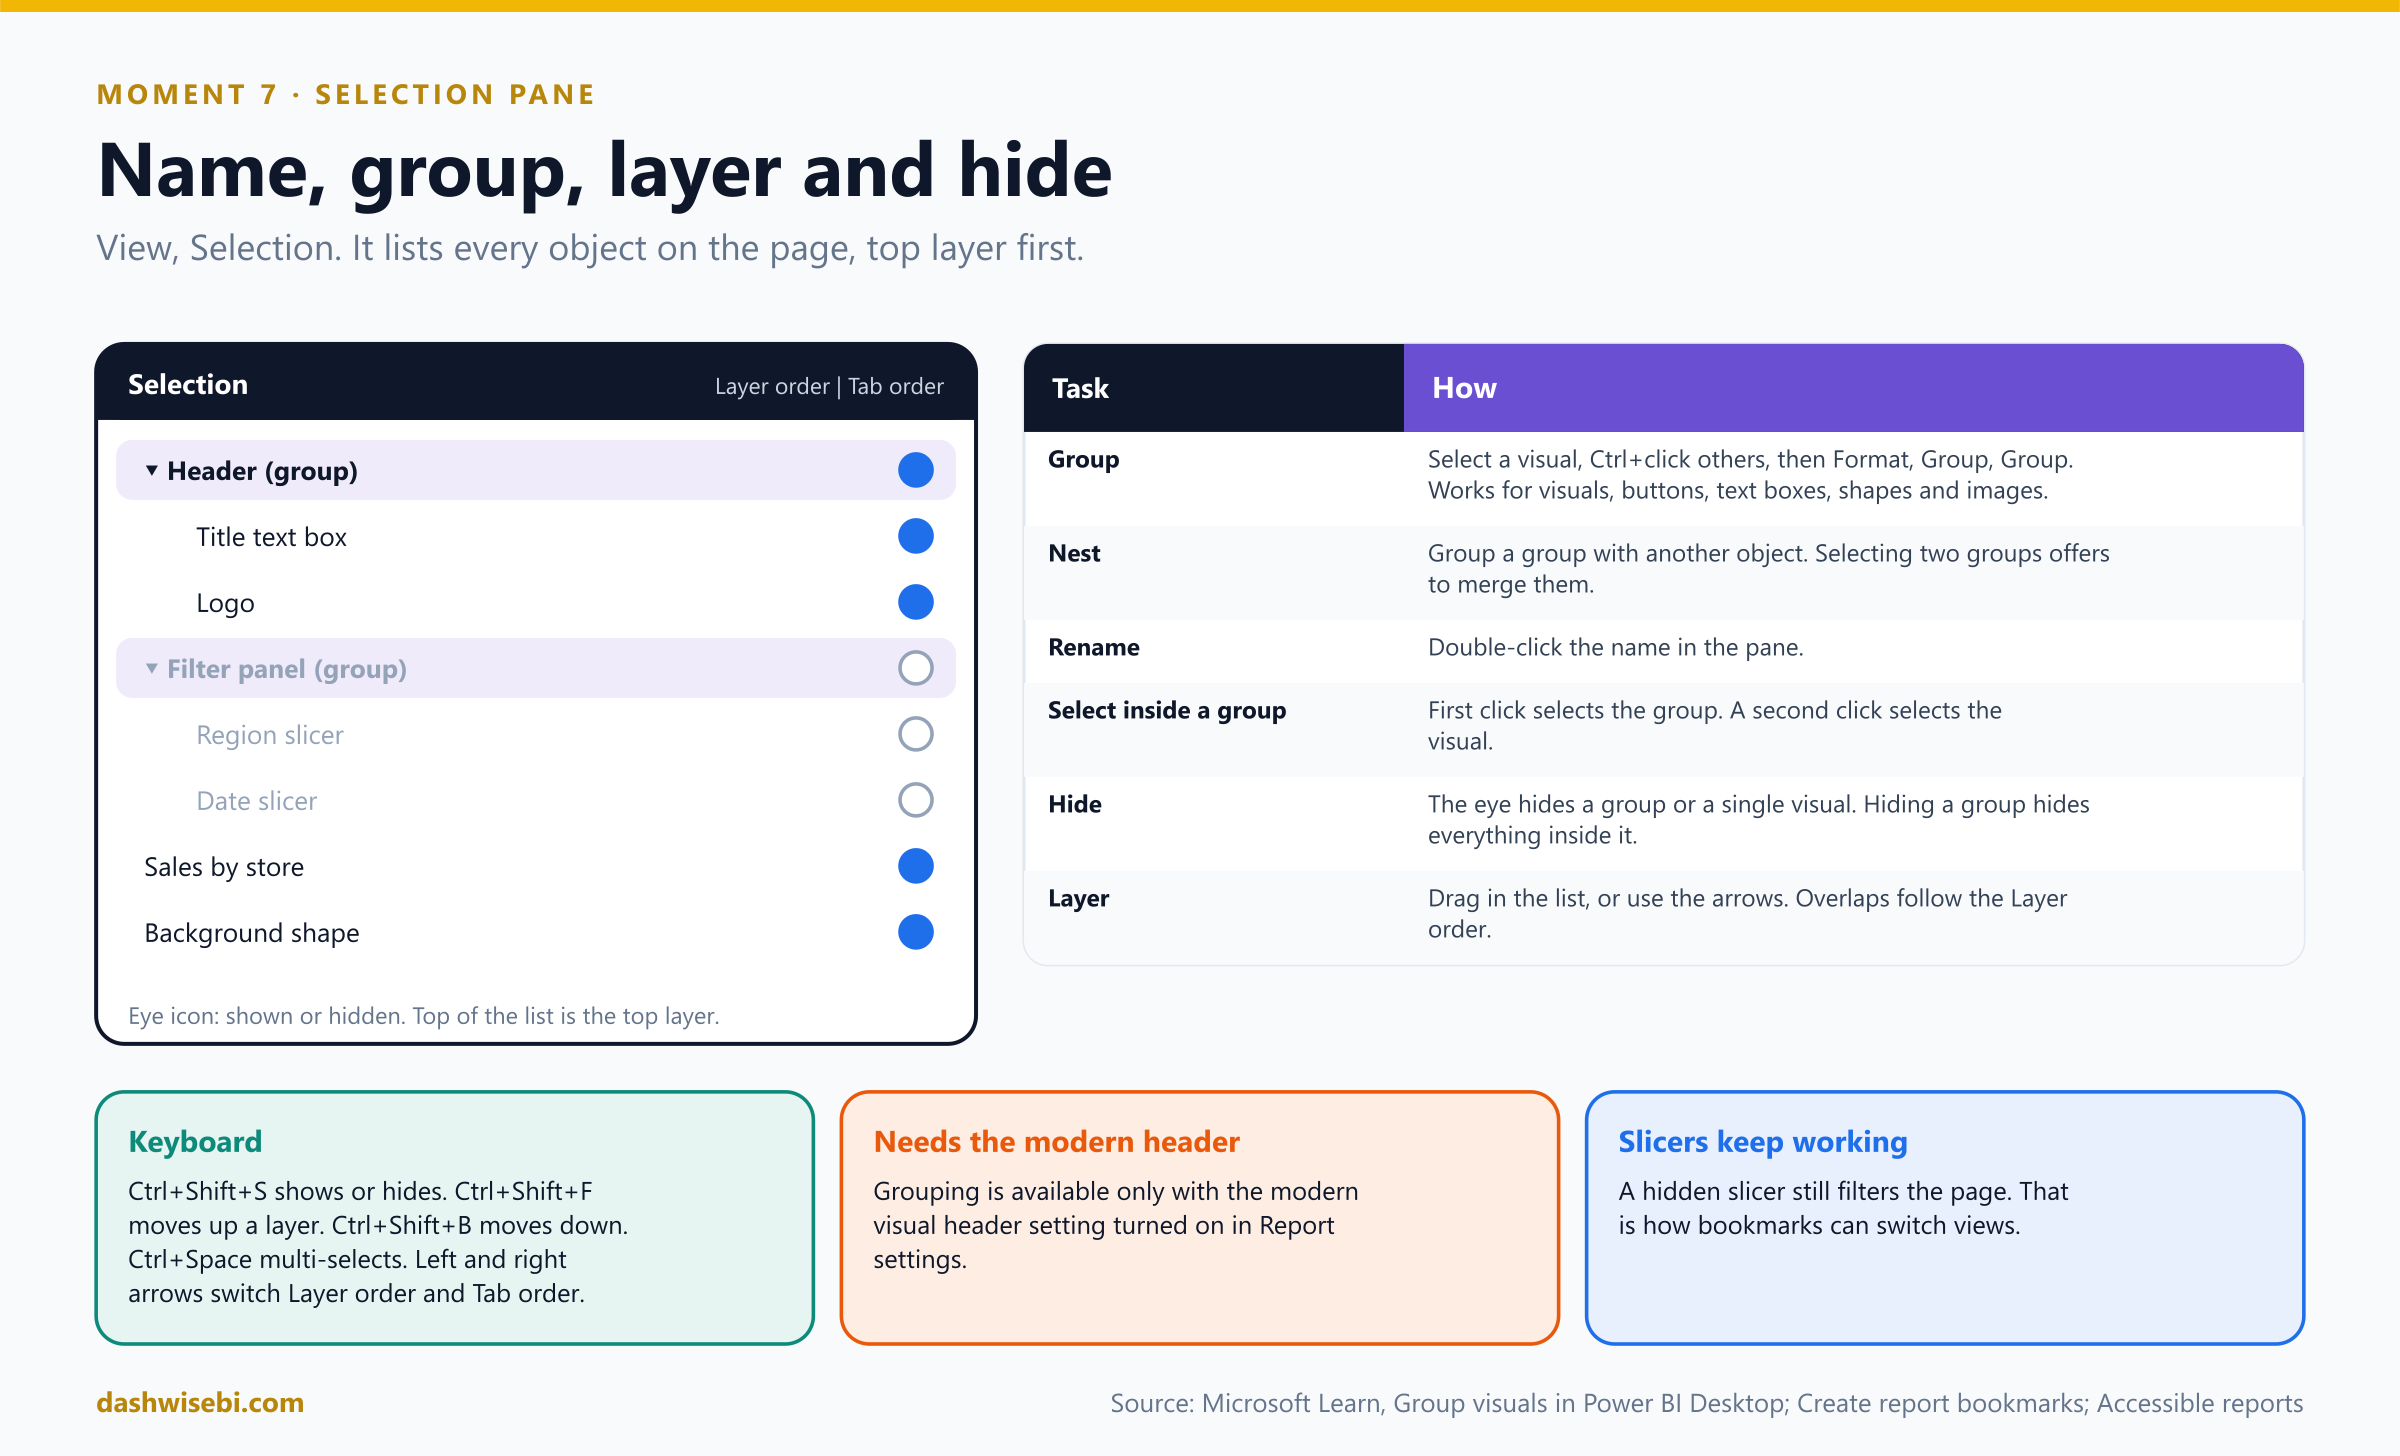
Select the first object, hold Ctrl and select the others. Then on the Format menu choose Group, then Group. You can group visuals, buttons, text boxes, shapes and images. The Selection pane shows the group, and you rename it by double-clicking the name.
Pause and decide. Sana clicks a visual inside a group and the whole group is selected. How do you select just the visual?
Click again. The first click selects the group and a second click selects the individual visual. Empty space between visuals in a group selects nothing, unless you gave the group a background color.
Pause and decide. Two visuals overlap, and the background shape hides a chart. What do you change?
The layer order. In the Selection pane drag the item to a higher position, or use the up and down arrows. The top of the list is the top layer. If visuals overlap, their order is determined by the Layer order list.
Pause and decide. You hide the group Filter panel with its eye icon. What happens to the visuals inside?
All of them are hidden, and their individual eye icons are greyed out. You can still hide a single visual in a group with its own eye icon. A hidden slicer still filters the page.
Pause and decide. Can you nest groups?
Yes. Select a group, then another object, and group them to create a nested group. If you select two groups, the menu offers to merge them instead of nesting. Grouping needs the modern visual header setting.
Why: the pane does two other jobs
- Bookmarks save the visibility of each object. This is what makes show and hide panels work (Moment 8).
- Tab order: the pane has a switch between Layer order and Tab order, which controls the order in which keyboard users move through objects. Name your visuals clearly (alt text and titles) too.
- Keyboard: Ctrl+Shift+S shows or hides an object, Ctrl+Shift+F moves it up a layer, Ctrl+Shift+B moves it down, Ctrl+Space multi-selects.
The seven slicers become one group called Filter panel. Rohit hides it, and the page breathes. “Where did the market go?” Sana asks. “Behind a button,” you say. That is the next step.
Exam lens
- View, Selection. Ctrl+select, Format, Group. Rename by double-click. Nest and merge.
- Layer order: top of the list is on top. Eye icon hides an object or a group.
- Hidden slicers still filter. Visibility is saved in bookmarks.
Moment 8. “I want to flip between three saved views”
Sana has found her three favorite combinations: stores in the West by month, returns in the South, and the top ten products. She wants each to be one click, and she wants to present them to her boss in order.
Bookmarks capture the state of a report page so you can return to it. Open the Bookmarks pane on the View tab (in the service: Edit, then View, Bookmarks pane). You need edit permission to create report bookmarks.
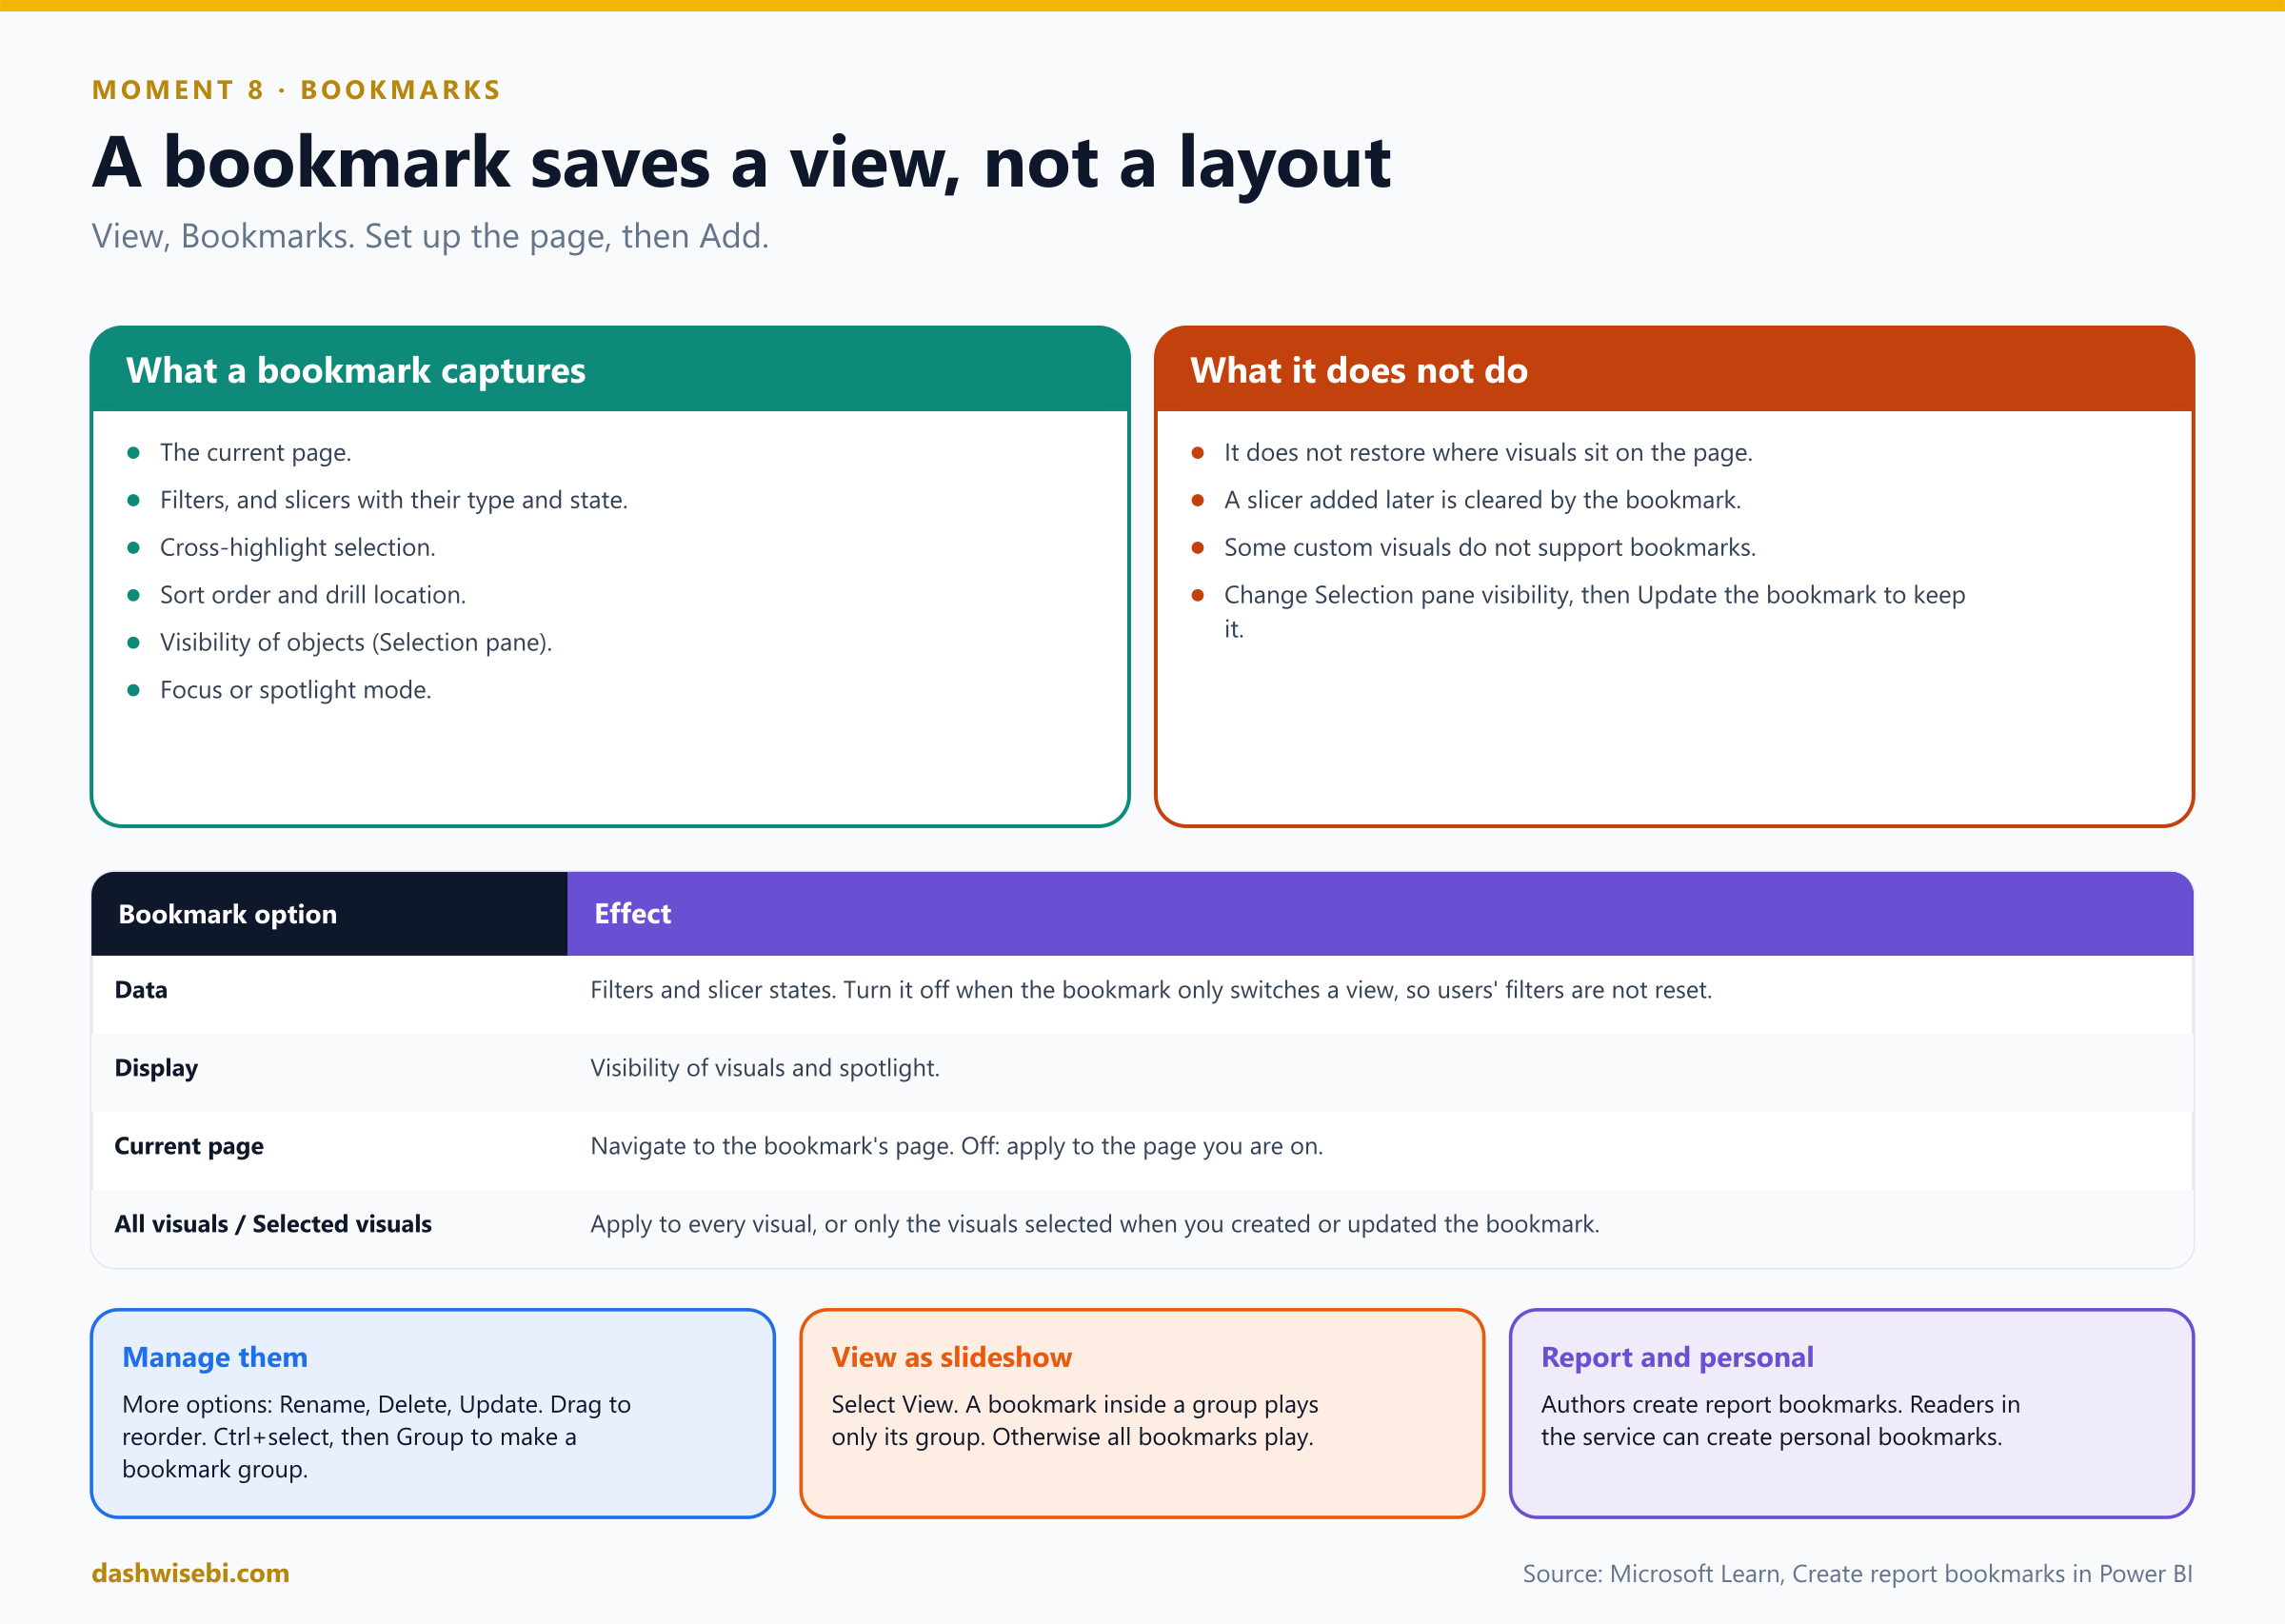
Pause and decide. List what a bookmark saves.
The current page, filters, slicers (including slicer type and state), visual selection state such as cross-highlighting, sort order, drill location, the visibility of objects (from the Selection pane), and the focus or spotlight mode of a visible object.
Pause and decide. You create a bookmark, then move a chart. Does selecting the bookmark move the chart back?
No. Bookmarks apply to the state of visuals, not to their location on the page.
Pause and decide. A bookmark that only shows or hides a panel keeps resetting the reader's filters. Which setting do you change?
Turn Data off in the bookmark's options (More options (...) next to the bookmark). Data controls whether filters and slicers are applied. Display controls visibility and spotlight, and Current page controls whether the bookmark navigates to its page. You can also apply a bookmark to All visuals or only to Selected visuals.
Pause and decide. You change which objects are visible with the Selection pane, and the bookmark still shows the old state. What now?
Right-click the bookmark (or open its More options) and choose Update. Changing visibility reverts it to the saved state until you update.
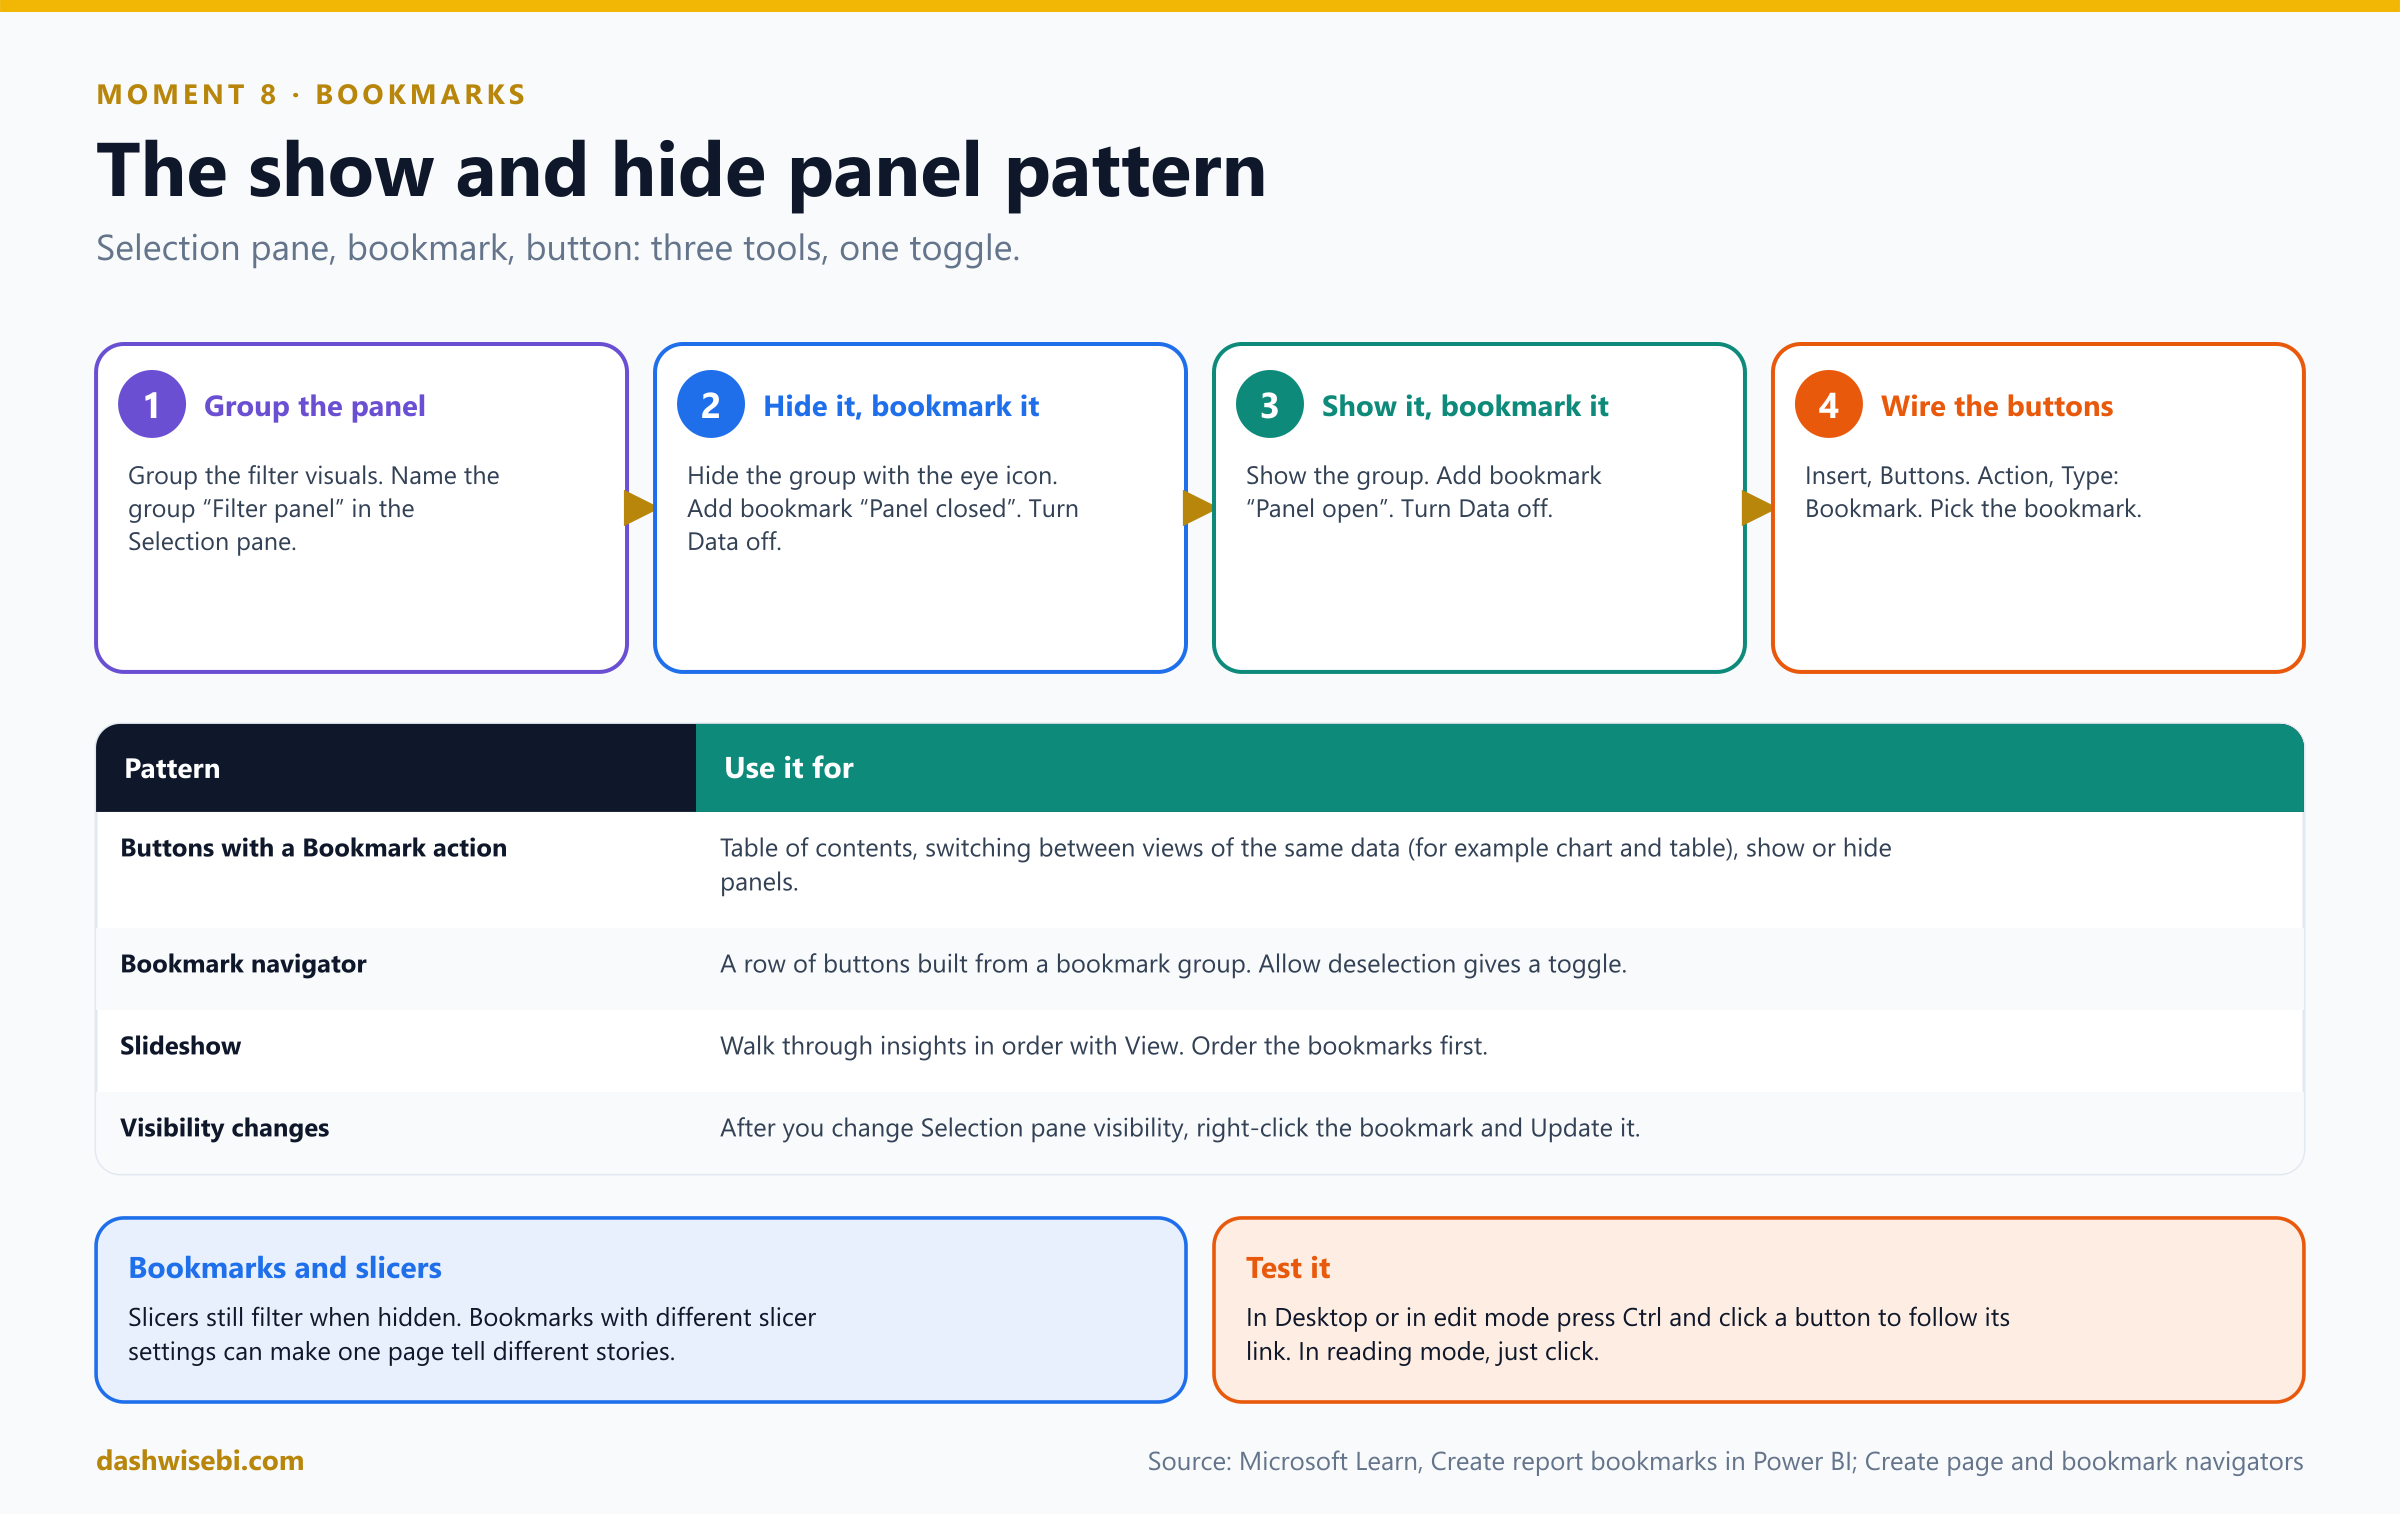
Pause and decide. Describe the show and hide panel pattern.
(1) Group the panel in the Selection pane. (2) Hide the group, add a bookmark “Panel closed”, with Data off. (3) Show the group, add “Panel open”, with Data off. (4) Insert two buttons with the Action type Bookmark, one for each bookmark. In Desktop test them with Ctrl+click.
Pause and decide. Sana wants three of her views in a row of buttons that always matches the bookmark list. What do you use?
A bookmark navigator, based on a bookmark group. To make a group, Ctrl+select the bookmarks, open More options and choose Group. You cannot create groups of personal bookmarks.
Pause and decide. Sana's boss wants to see the bookmarks in order, like slides. How?
Select View in the Bookmarks pane. Drag bookmarks to set the order first. If the selected bookmark is in a group, only that group plays. If it is not in a group, all bookmarks play, including bookmarks in groups. It works in Desktop, and in the service in Edit or Reading mode.
Why: bookmark options and limits
- Report bookmarks are made by authors. Readers in the service can make personal bookmarks.
- If you add a slicer to a page that already has bookmarks, the slicer is cleared.
- Most Power BI visuals work with bookmarks. For a custom visual that does not, contact its creator.
- You can link a bookmark to a shape or image as well as a button, for example to build a visual table of contents.
The report now has a tab bar, a hidden filter panel, a drillthrough page, a tooltip that tells a story, and a row of bookmarks. Sana tries everything in ten minutes, without asking a single question. Rohit realizes that this is the best review of his career.
Exam lens
- Bookmarks save page, filters, slicers, selection state, sort, drill, visibility, focus. Not visual positions.
- Options: Data, Display, Current page, All or Selected visuals. Update after visibility changes.
- Bookmark group for navigators and for slideshows. View plays them.
The debrief: ten quick calls
Sana packs her laptop and offers a final test: ten questions, from her notes. Answer in your head first, then open each one.
Pause and decide. 1. Month names sort alphabetically. What is the model-level fix?
Sort by column: Month Name by Month Number (same granularity, unique values).
Pause and decide. 2. Which interaction icons can you pick on a target visual?
Filter, Highlight and None.
Pause and decide. 3. How do you make drilling affect the whole page?
Desktop: Apply drill down filters to Entire page. Service: Drilling filters other visuals On.
Pause and decide. 4. A slicer is synced to a page and not visible there. Does it filter the page?
Yes.
Pause and decide. 5. Which setting makes a page act as a tooltip, and where do you pick the triggering fields?
Page information, Tooltip on (and the Tooltip page type). The fields go in Tooltip fields.
Pause and decide. 6. Why would Drillthrough be missing from the right-click menu?
The field is not in both places, or it is aggregated in the source visual.
Pause and decide. 7. Which button action goes to another page without bookmarks?
Page navigation.
Pause and decide. 8. Which visual builds a row of buttons from the pages and updates itself?
The page navigator.
Pause and decide. 9. What controls which visual is on top?
The layer order in the Selection pane.
Pause and decide. 10. A bookmark should not reset the reader's filters. Which option?
Turn Data off.
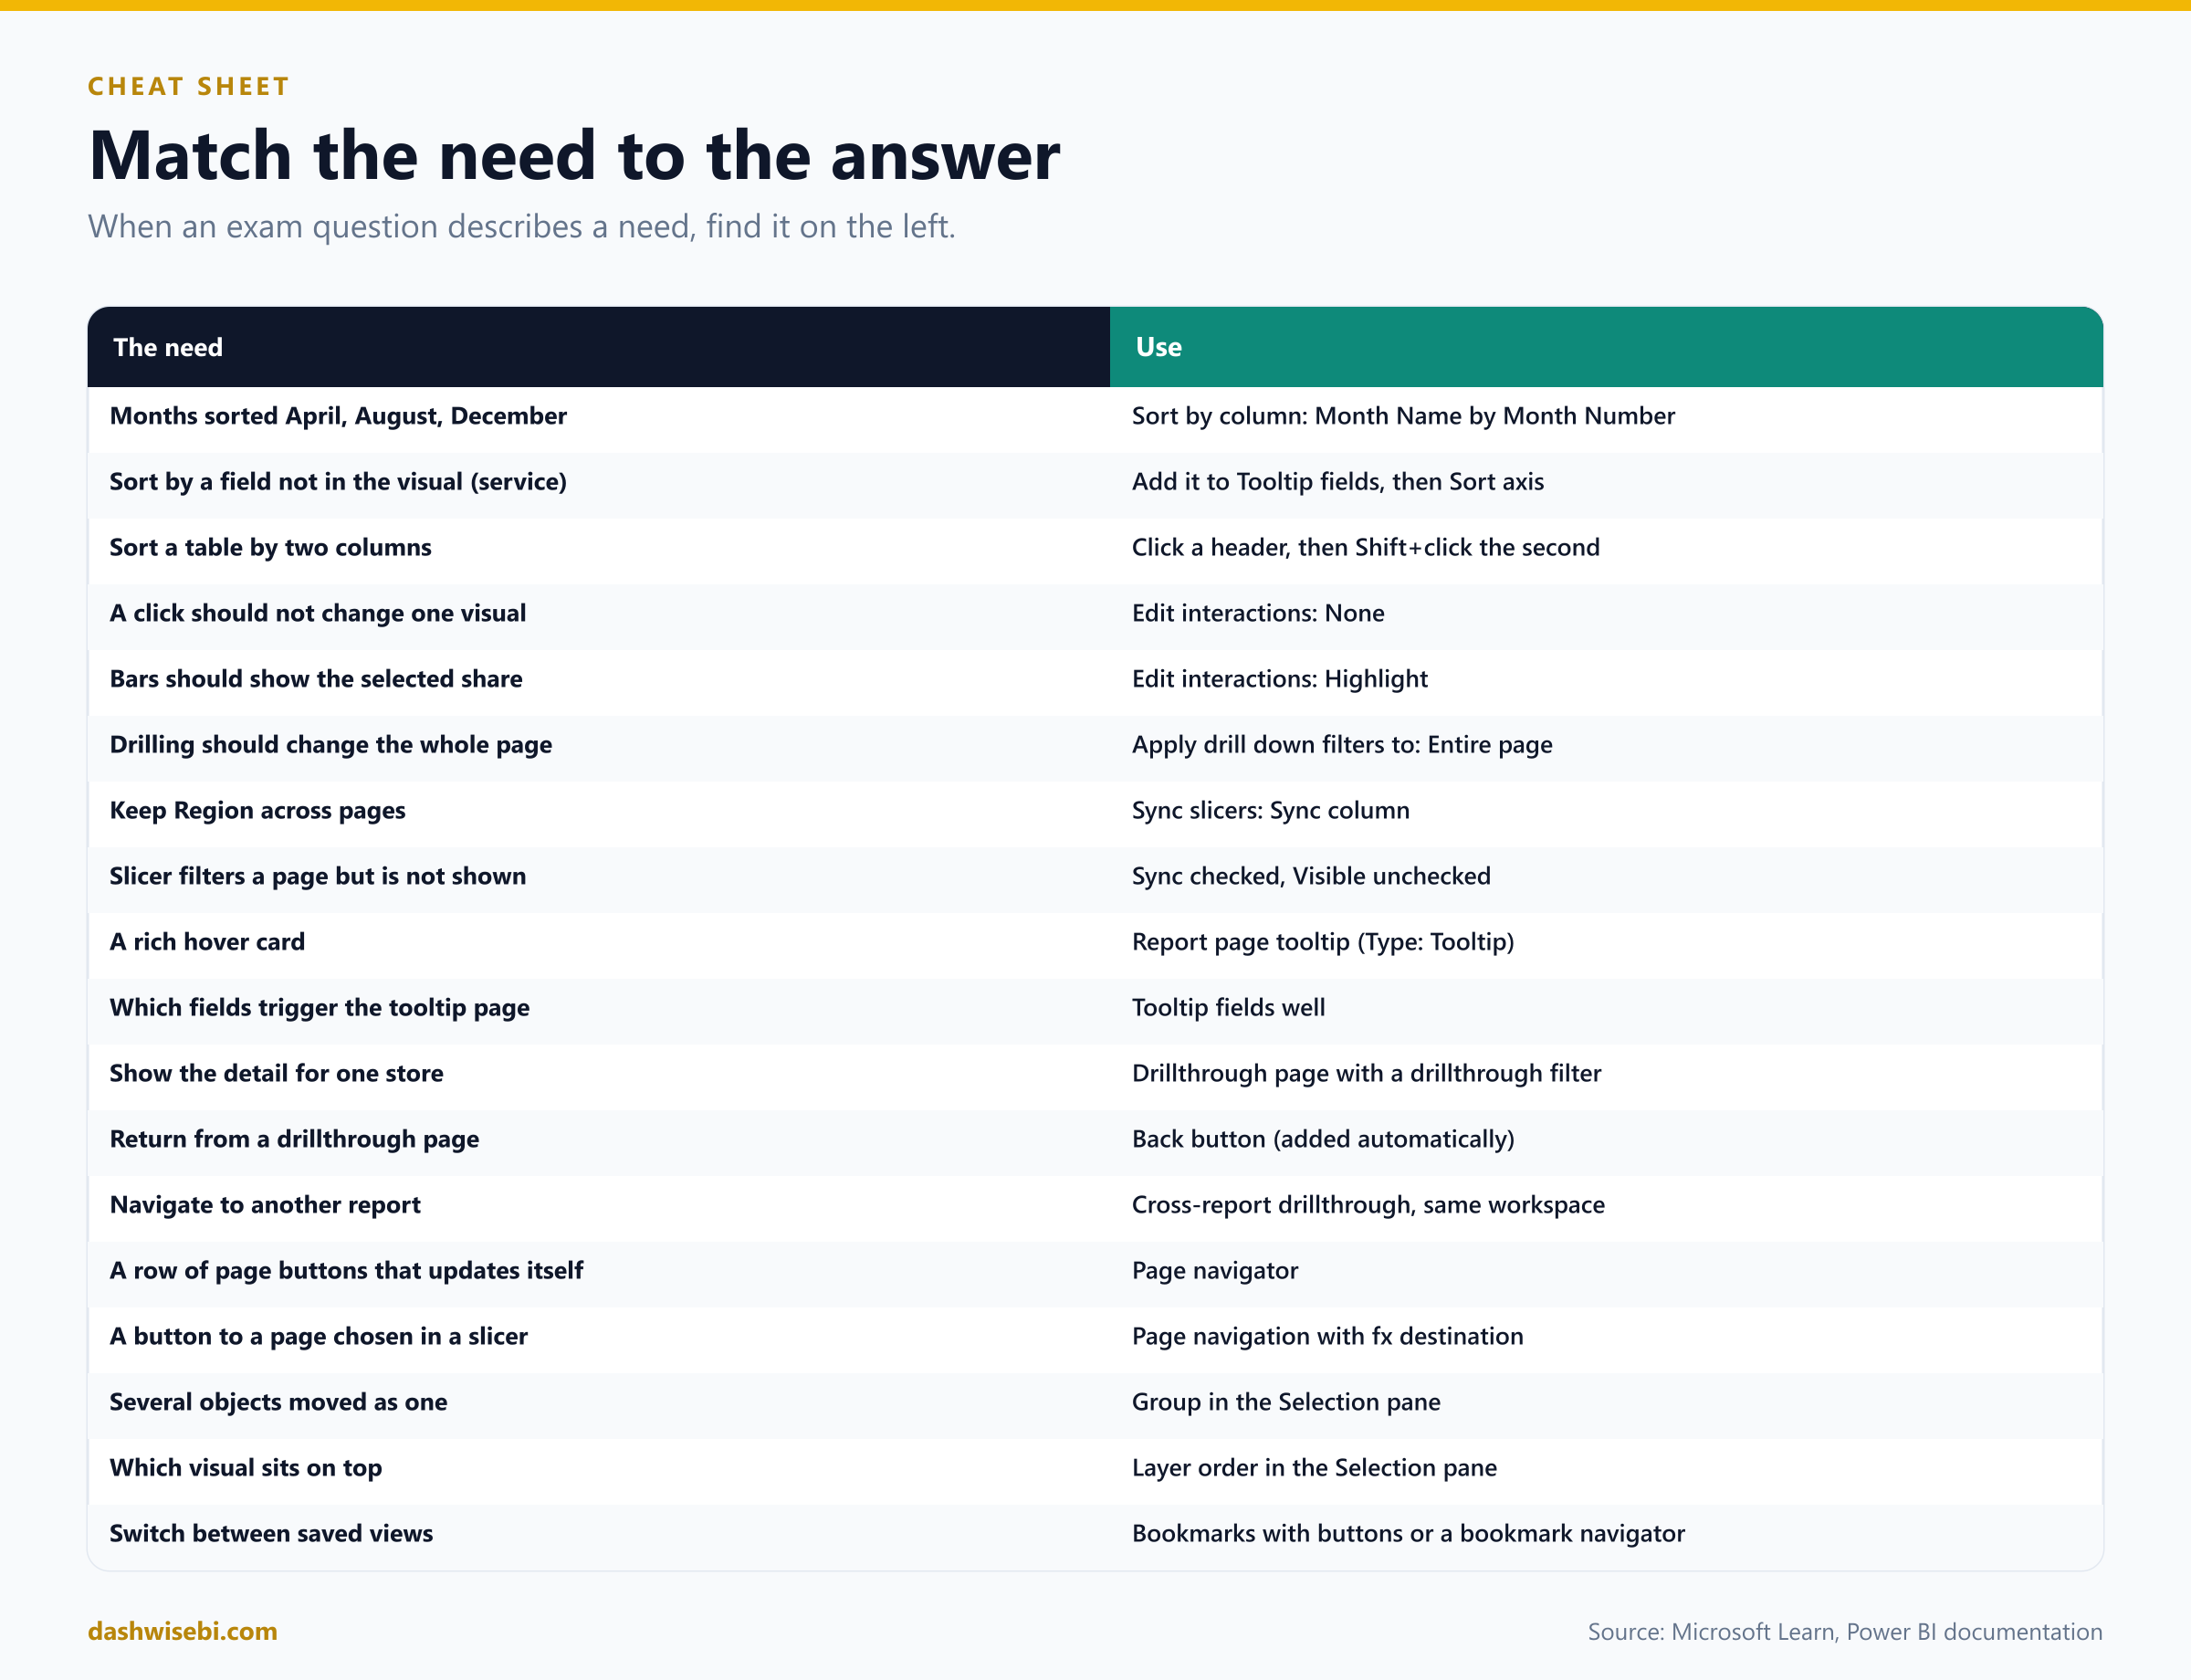
The cheat sheet
Myth or fact?
- “Every visual can be sorted.” Myth. Treemaps, filled maps, scatter charts, gauges, waterfall charts and cards cannot.
- “Sort by column works with any column.” Myth. Same granularity, unique values.
- “Drilling changes the other visuals by default.” Myth. You must change the setting.
- “A slicer must be visible to filter.” Myth.
- “A tooltip page can hold slicers.” Myth. It is not interactive.
- “Drillthrough works with an aggregated field.” Myth. The field must not be aggregated in the source visual.
- “Page navigation needs a bookmark.” Myth. It does not.
- “Bookmarks restore where visuals sit.” Myth. Only their state.
- “Cross-report drillthrough works between workspaces.” Myth. Same workspace only.
- “Hiding a slicer stops it filtering.” Myth.
Where to go next
- Build a sales page with a Month Name column. Break the sort, then fix it with Sort by column.
- Put four visuals on a page and use Edit interactions so that one never changes.
- Build a tooltip page of 320 by 240 and attach it to a bar chart with Tooltip fields. Then override it by hand.
- Create a drillthrough page for Store with a button and a Back button. Try it with an aggregated field to see it disappear.
- Insert a page navigator. Then group your slicers, hide the group, and build the show and hide pattern with two bookmarks.
- Read the sources behind this post: PL-300 study guide, Sort one column by another column, Change how a chart is sorted, Change how visuals interact in a report, Overview of slicers in Power BI, Create report tooltips, Tooltips overview, Drillthrough in Power BI reports, Use report page drillthrough, Types of filters in Power BI reports, Create and configure buttons, Create page and bookmark navigators, Group visuals in Power BI Desktop, Create accessible reports in Power BI Desktop and Create report bookmarks.
Keep reading
PL-300 Episode 9: Usability, Mobile & Accessibility
PL-300 as a rollout week: export settings, mobile layouts, personalized visuals, accessibility and automatic page refresh.
PL-300 Episode 7: Secure & Govern Power BI
PL-300 as an audit week: workspace roles, sharing, semantic model access, row-level security, RLS group membership and sensitivity labels.