PL-300 Episode 9: Usability, Mobile & Accessibility

PowerBI consultant ·
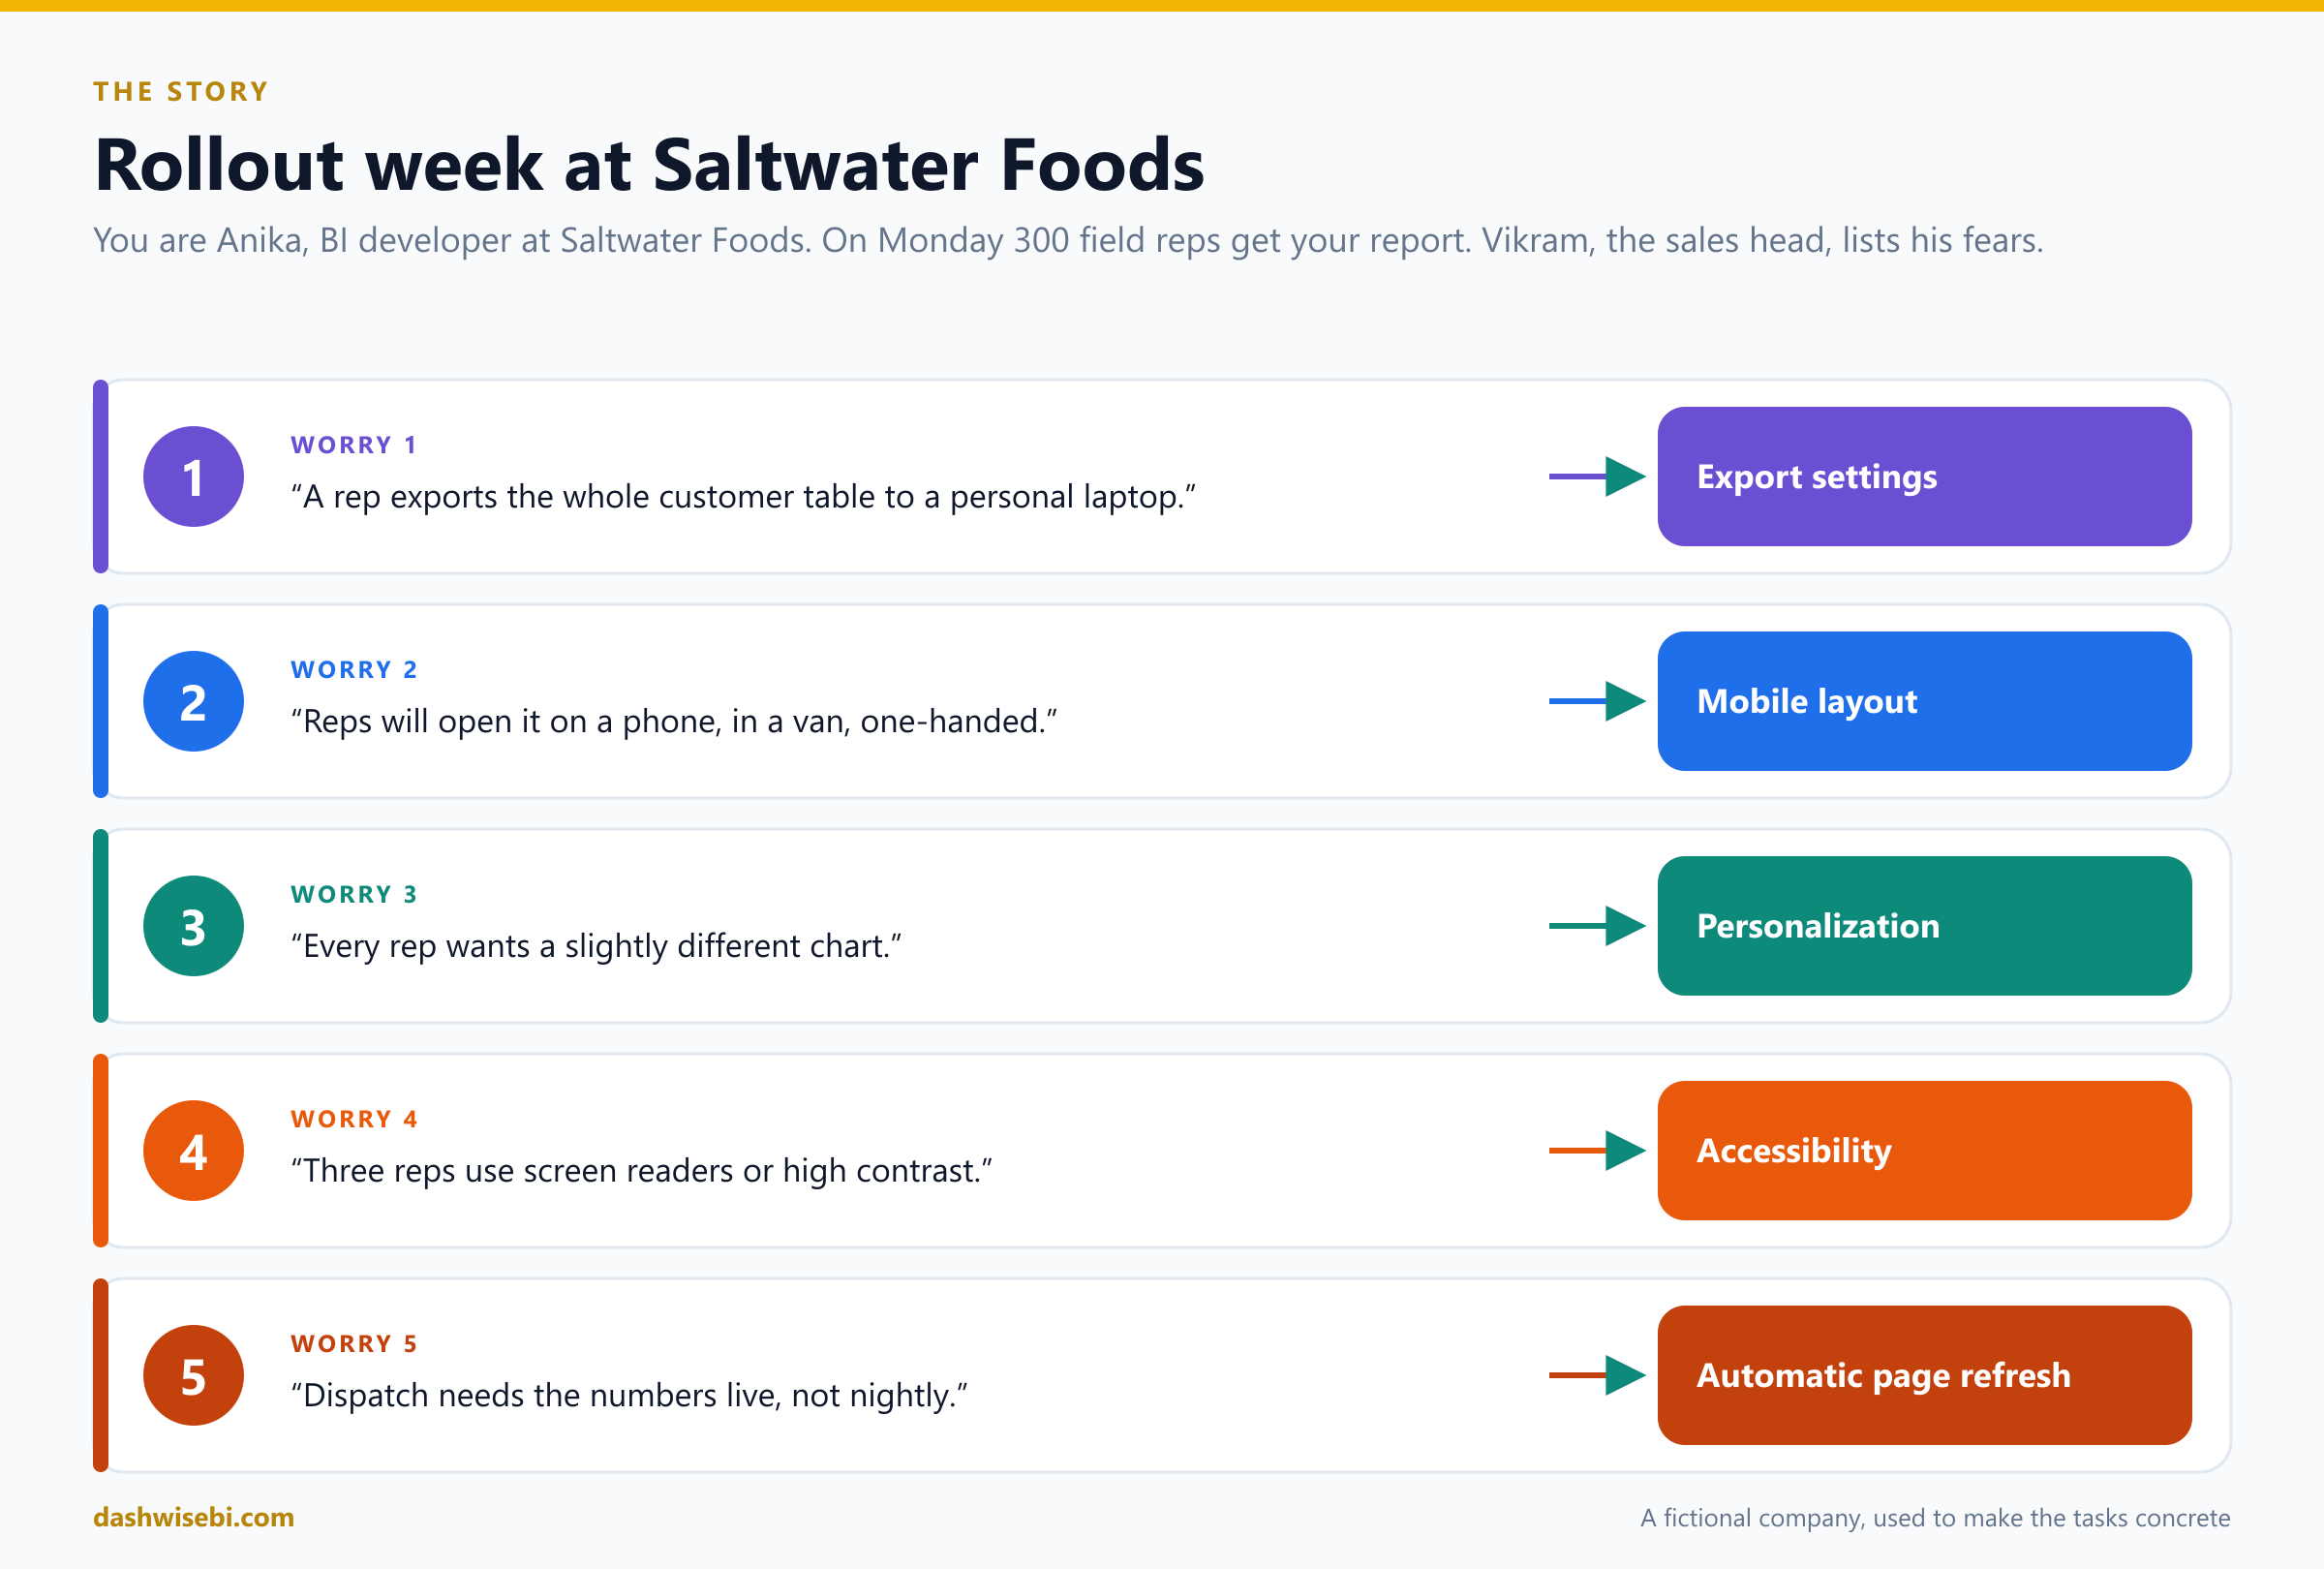
Friday, 5 p.m. Anika, the BI developer at Saltwater Foods, a restaurant-supply distributor, is about to go home. Then Vikram, the head of sales, walks over with a printed list. “Monday, 300 field reps get your Sales Pulse report,” he says. “I have five worries. Fix them or I will be the one explaining.”
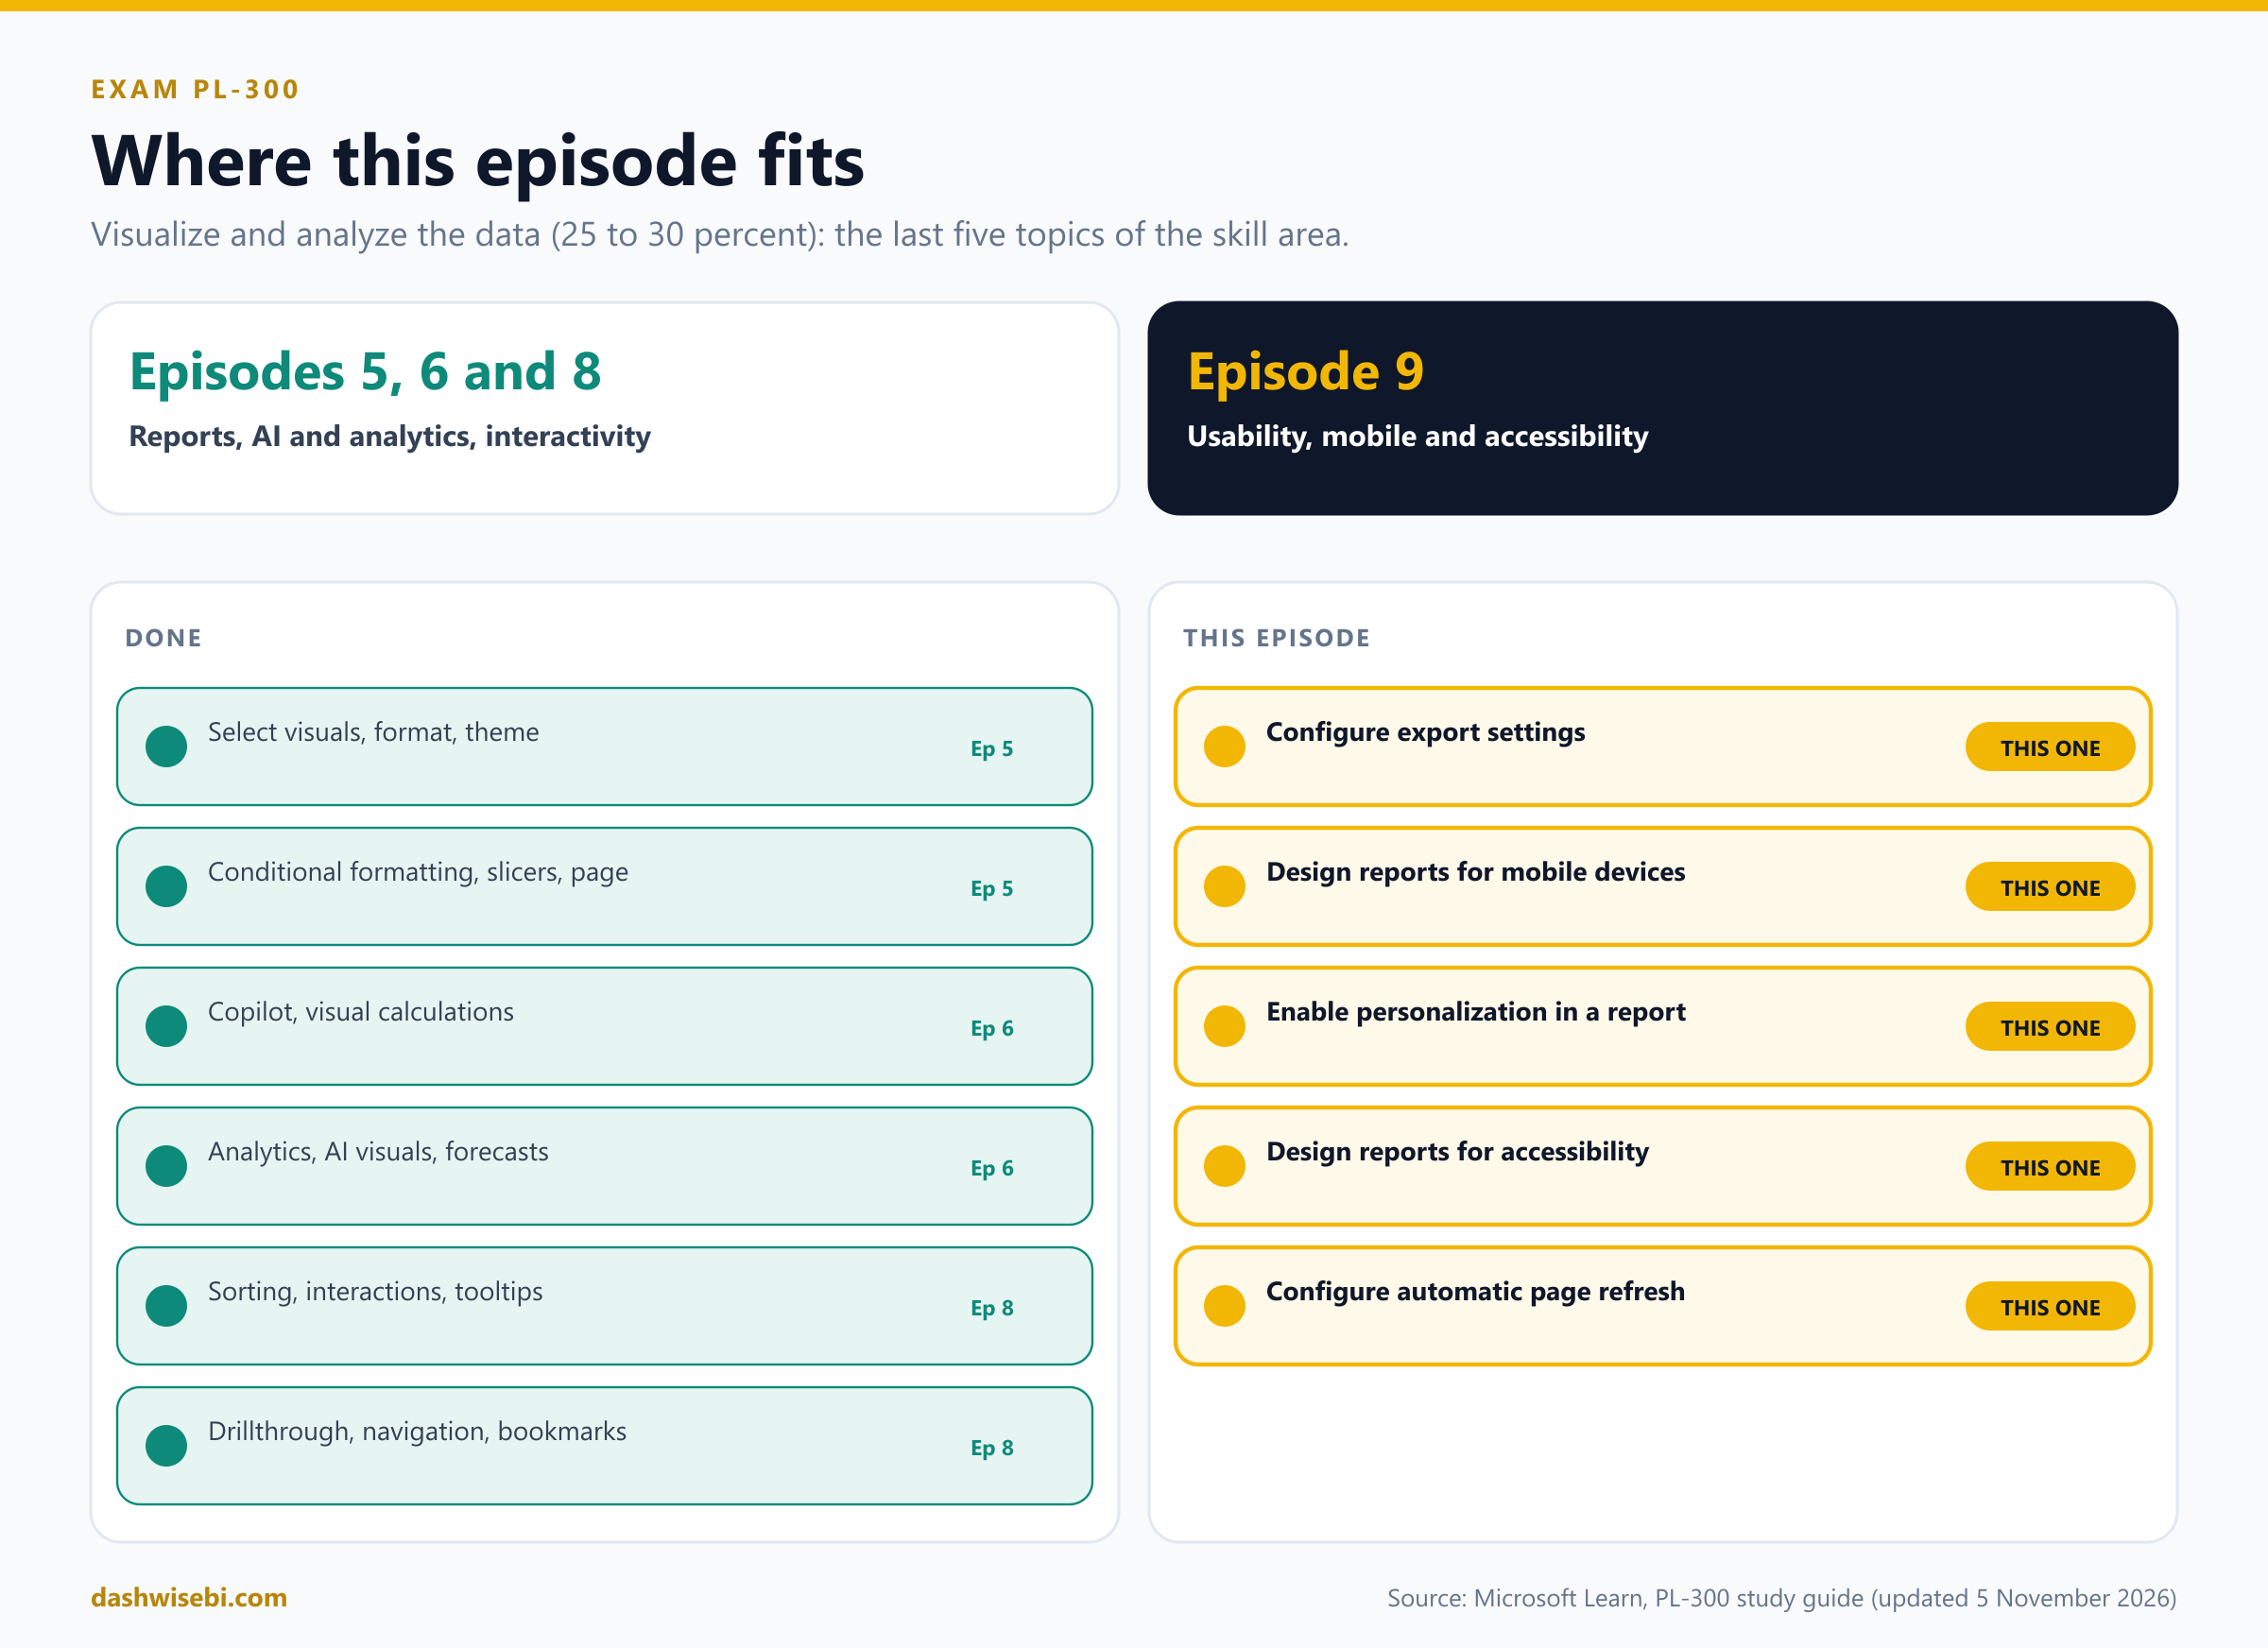
Welcome to Episode 9 of our PL-300 series. In Episode 8 you made a report that flows. This episode finishes the Visualize and analyze the data skill area (25 to 30 percent of the exam) with the things that decide whether a report works in the real world. Vikram's five worries are the five topics:
- Configure export settings
- Design reports for mobile devices
- Enable personalization in a report, including personalized visuals
- Design and configure Power BI reports for accessibility
- Configure automatic page refresh
Each chapter has the same rhythm as the last few episodes:
- The worry. What Vikram says.
- Pause and decide. Choose first. The answer is behind a click.
- Why. The reasoning, with diagrams.
- Exam lens. What PL-300 tends to ask, and the traps.
A few honest notes. Saltwater Foods is made up, and I have not run every step on a live tenant, so I follow Microsoft Learn and say so where it is thin. Automatic page refresh limits, in particular, depend on your capacity and on what your admin has set. A few numbers on Learn pages differ from each other in places (I point out the one that matters), so check the live pages before an exam.
Worry 1. “A rep exports the whole customer table to a personal laptop”
Vikram taps the first line. “Some of this data is commercial. I do not want 300 copies of it in 300 Downloads folders.”
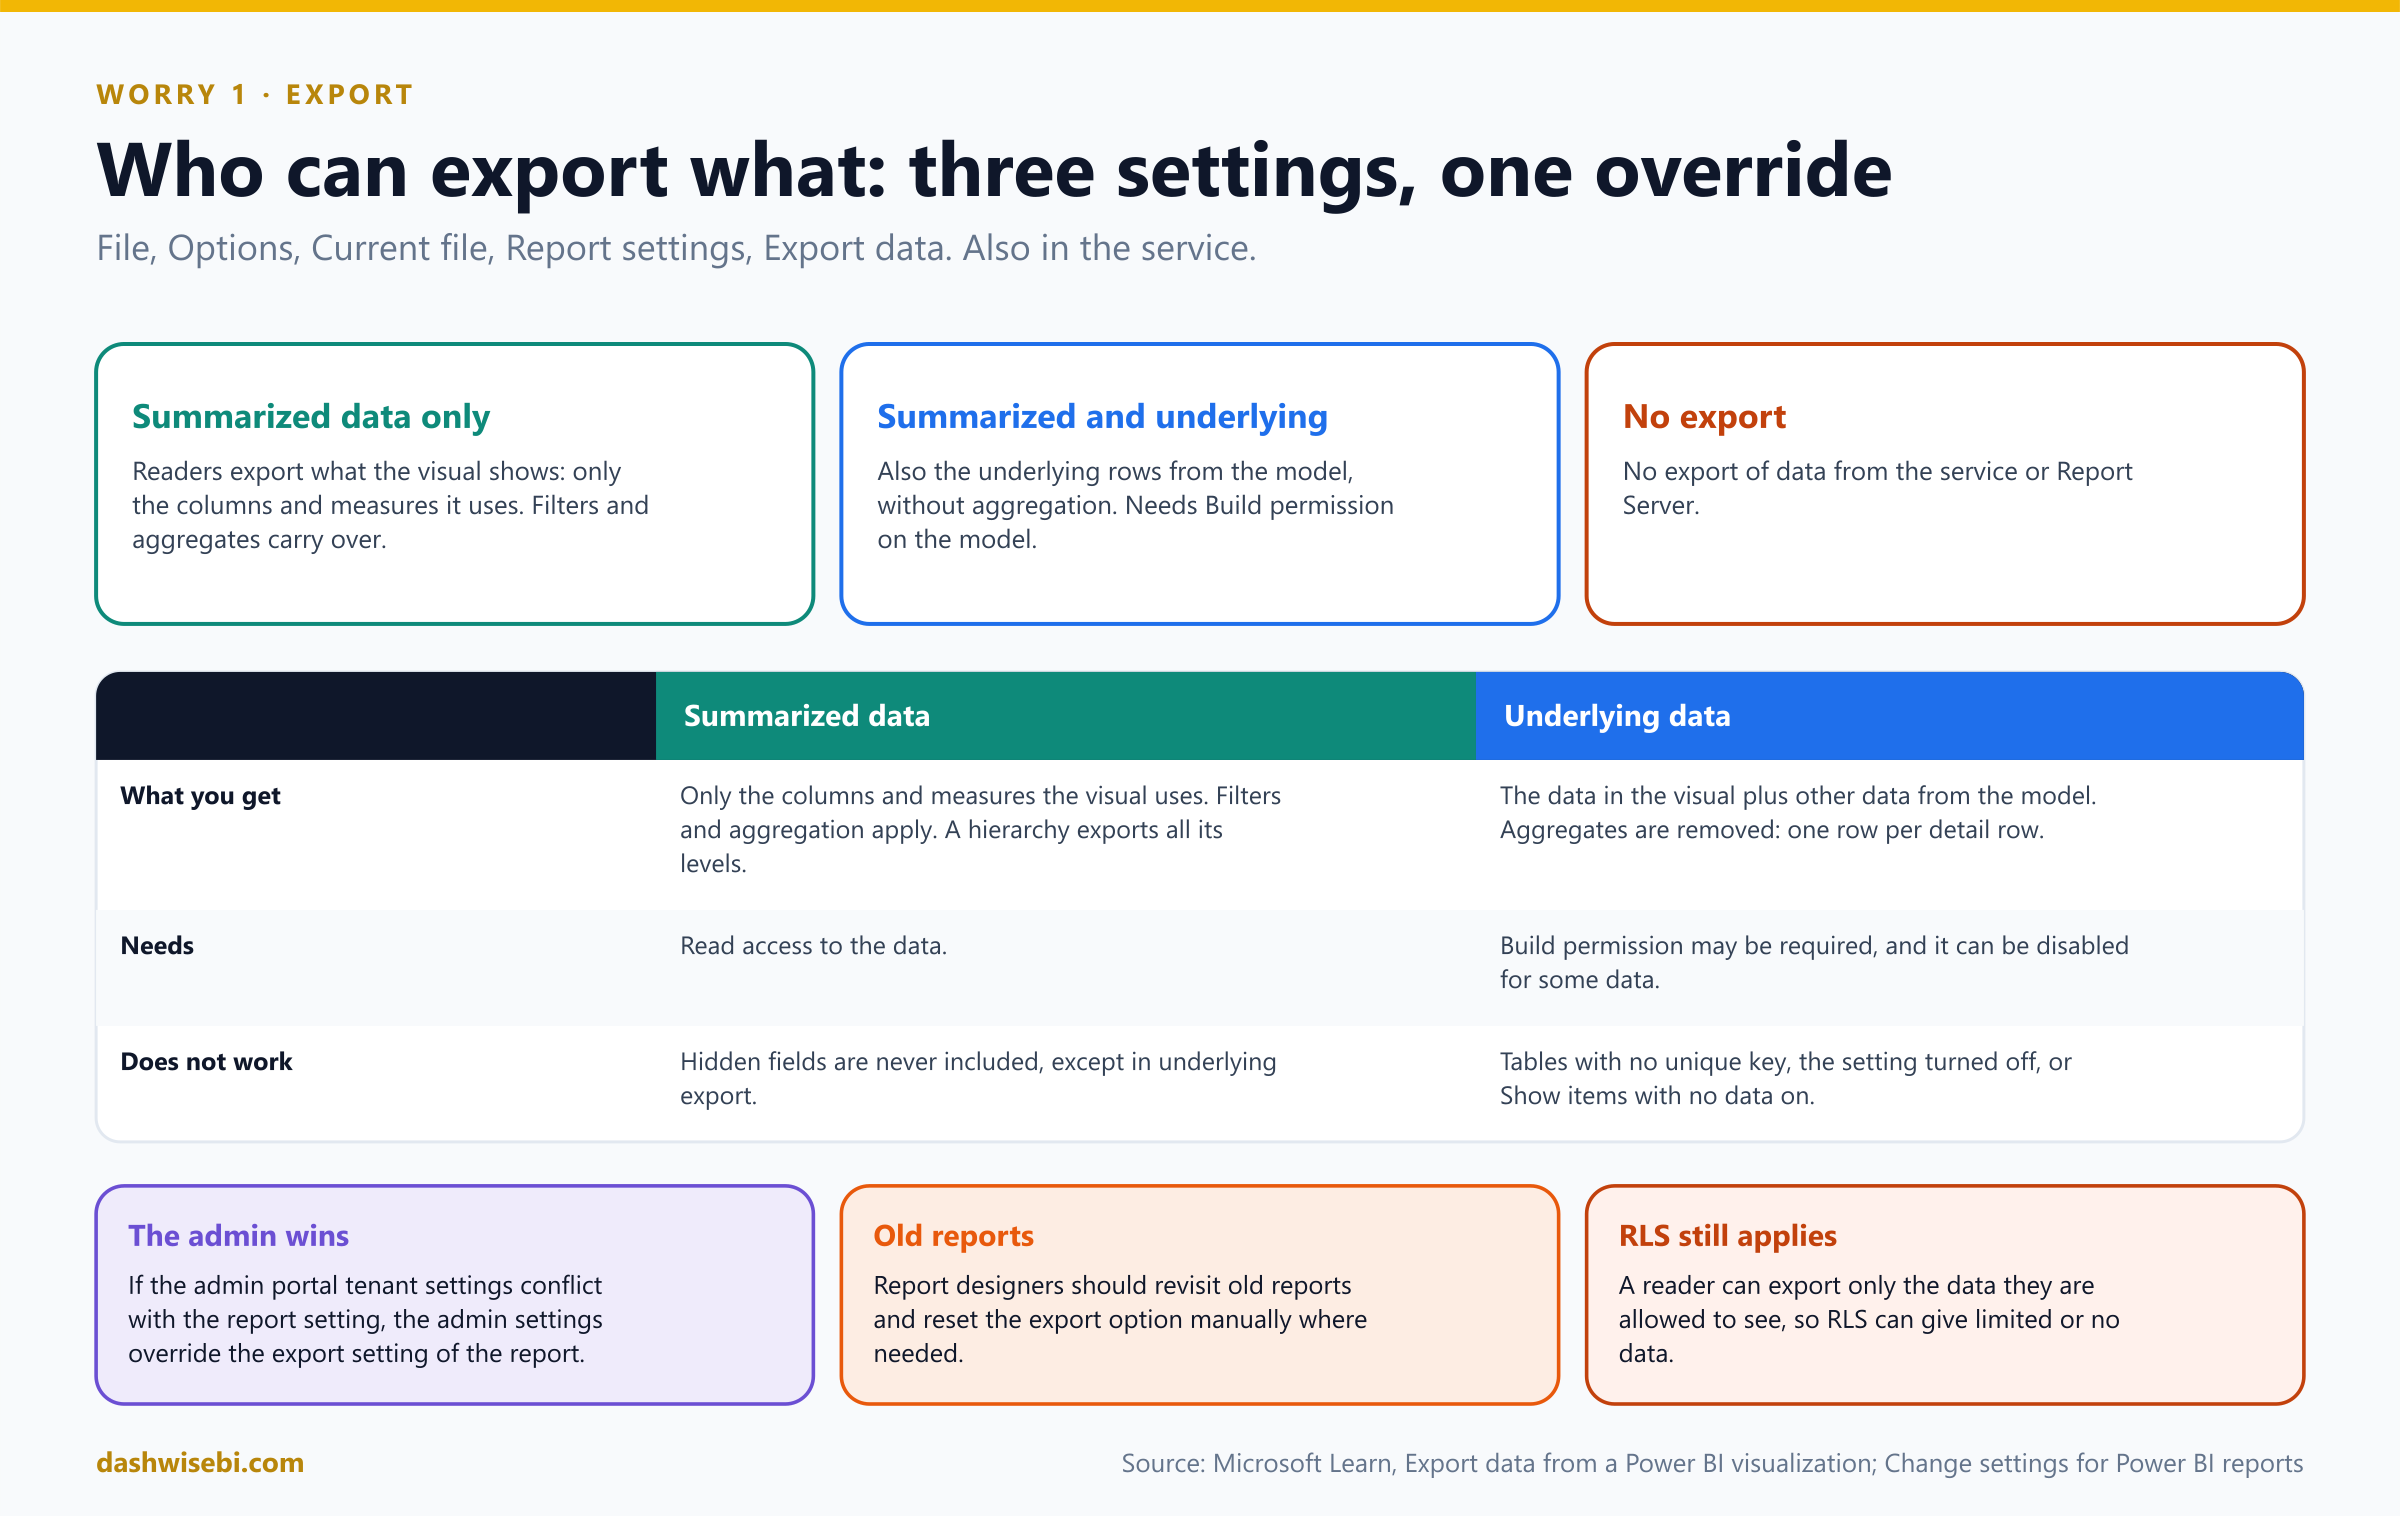
A reader can export data from a visual. By default, report readers can export summarized or underlying data. As the author you decide how much to allow.
Pause and decide. Where do you set what readers can export, and what are the choices?
In Power BI Desktop: File, Options and settings, Options, then under Current file choose Report settings and the Export data section. In the service, open the report's settings. The choices are to allow readers to export summarized data only, to allow summarized and underlying data, or to allow no data export.
Pause and decide. The report says summarized only, but the tenant admin has export enabled for everybody. Which wins?
The admin settings. If the Power BI admin portal settings conflict with the report's export setting, the admin settings override it. Learn also warns report designers to revisit old reports and reset the export option manually where needed.
Pause and decide. A rep exports a visual that shows sales by city, with the average discount. What is the difference between summarized and underlying data in the file?
Summarized data contains only the columns and measures the visual uses, aggregated and filtered as shown. If the visual has a hierarchy, the export includes all its levels, not only the current drill level. Underlying data adds other data from the semantic model and removes the aggregate: one row per detail row. For some data the underlying option is disabled, and you may need Build permission to see more than the visual shows.
Pause and decide. Which export format has the largest row limit, and which one cannot carry a sensitivity label?
The Excel .xlsx with live connections allows up to 500,000 rows and inherits the label of the semantic model. The plain .xlsx is limited to 150,000 rows and inherits the label of the report. A .csv file is limited to 30,000 rows and does not support sensitivity labels. (Episode 7 explained why a label matters on exported files.)
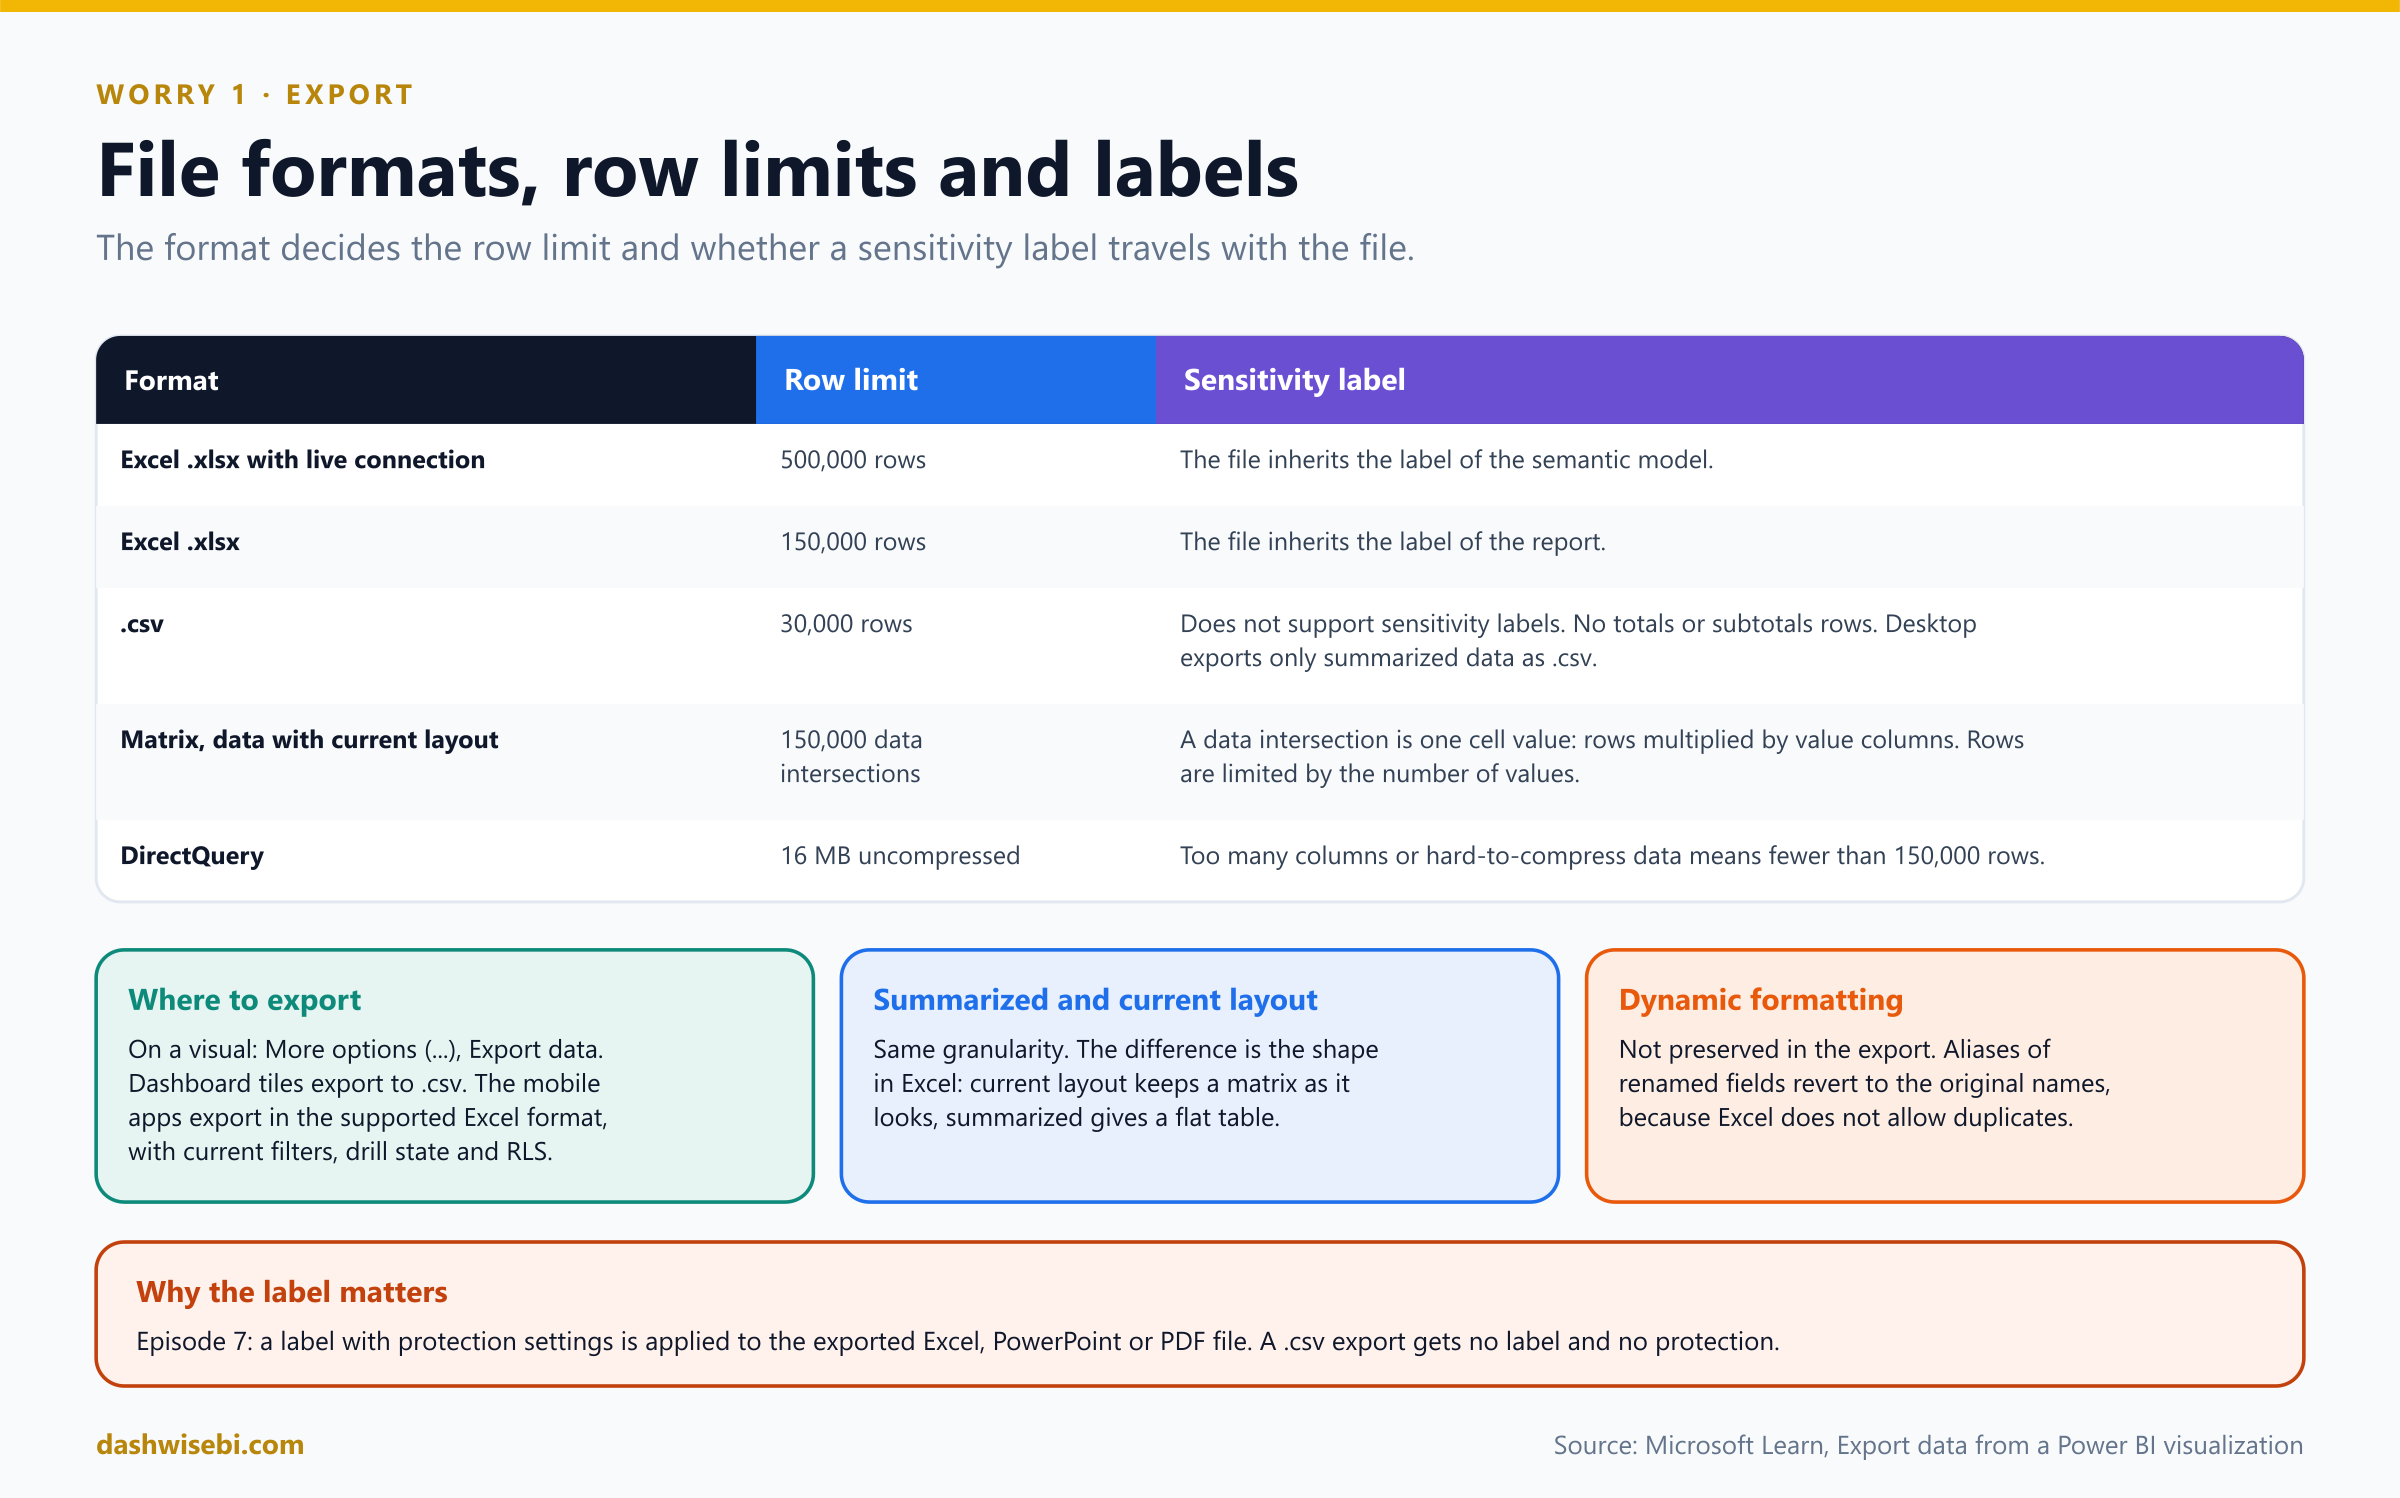
Pause and decide. A matrix export with the current layout stops early and Excel shows a message about the allowed volume. Why?
The limit for Data with current layout is 150,000 data intersections, meaning cells: rows multiplied by value columns. With three value columns the maximum is 50,000 rows. The footer says that exported data exceeded the allowed volume. Reduce row or column categories, limit the measures, or filter. (With DirectQuery there is also a 16 MB limit of uncompressed data.)
Pause and decide. A rep with row-level security exports a visual. What do they get?
Only the data they are allowed to see. Export respects RLS (Episode 7), so it can result in limited data or none.
Why: export is a leak path, so treat it like one
- When a visual is exported, summarized and current layout have the same granularity. The only difference is the shape in Excel: a matrix keeps its shape with current layout and becomes a flat table with summarized data.
- Dynamic formatting is not preserved. Renamed fields (aliases) revert to their original names, because Excel does not allow duplicate names.
- Admins can disable export, and some custom visuals do not support it. In the mobile apps readers can also export, and the file respects their filters, drill state and RLS.
- Layers work together: RLS limits rows, sensitivity labels protect exported files, and export settings limit what leaves in the first place.
Anika sets Export data to summarized only. The underlying customer rows stay in the model, and the reps still get the numbers behind each chart. Vikram ticks his first line.
Exam lens
- Report settings, Export data: summarized only, summarized and underlying, or none. The admin setting wins.
- .xlsx with live connection 500,000; .xlsx 150,000; .csv 30,000 and no label.
- Underlying export can need Build permission. RLS still applies.
Worry 2. “Reps will open it on a phone, in a van, one-handed”
Vikram holds up his phone. The wide report is a tiny gray postcard. “Can they read this?” he asks. “Will they pinch and zoom in a van?”
Power BI lets you build a mobile-optimized layout for any page, next to the normal one. The two layouts share the same visuals and data, but the phone layout is a single column designed for portrait use.
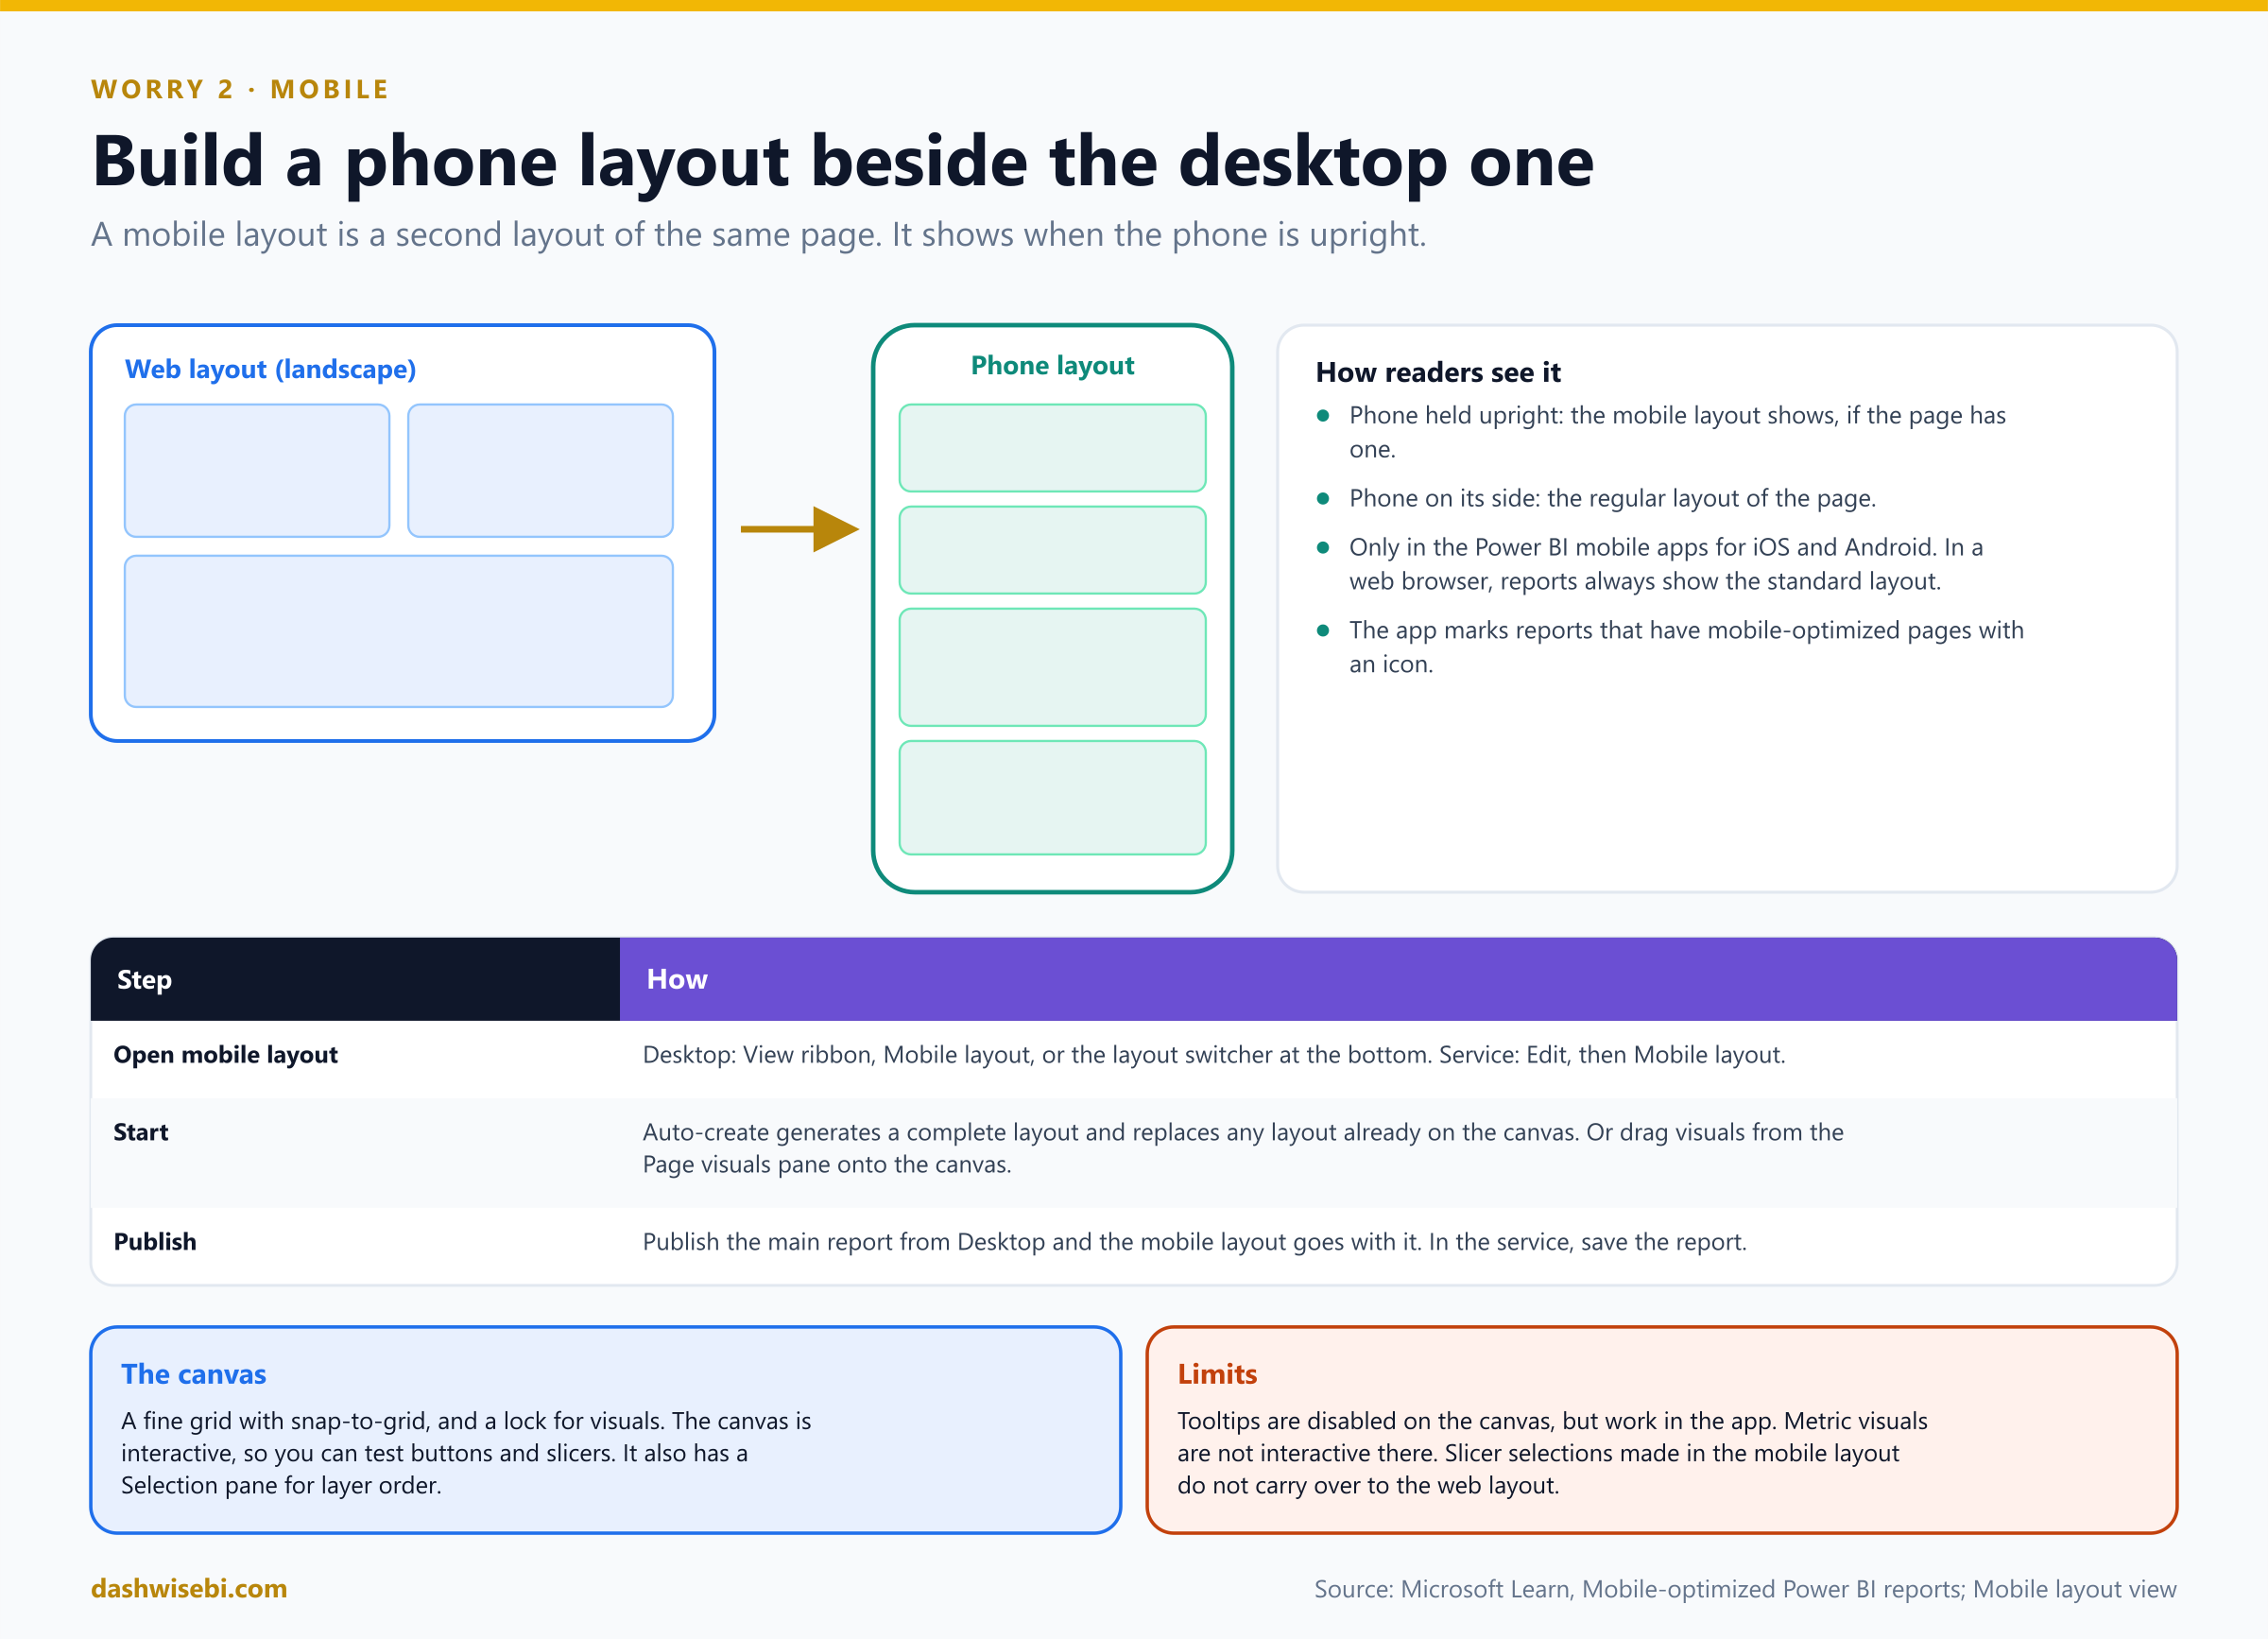
Pause and decide. How do you open the mobile layout, and what can you do to get started quickly?
In Desktop use the View ribbon, Mobile layout, or the layout switcher at the bottom. In the service select Edit and then Mobile layout. Start with auto-create mobile layout, which generates a complete layout from the desktop page, or drag visuals from the Page visuals pane onto the canvas. Auto-create replaces any layout already on the canvas.
Pause and decide. A rep holds the phone upright, then turns it on its side. What do they see?
Upright, the mobile-optimized view (if the page has one). On its side, the regular layout of the page, as on a computer. This only happens in the Power BI mobile apps for iOS and Android. In a web browser the report always shows the standard layout.
Pause and decide. Anika creates the mobile layout in Desktop. What does she have to publish?
Only the main report. The mobile layout is published with it. If you create it in the service, you save the report.
Pause and decide. The auto-created layout looks messy. Name three things that make auto-create worse.
The engine reads the desktop page left to right from the top, so a page with a strong vertical part, such as a left-hand navigation bar, renders worse. It cannot handle background images. Heavy overlaying is a challenge, and many images may not all fit on the canvas. You can always adjust the result by hand.
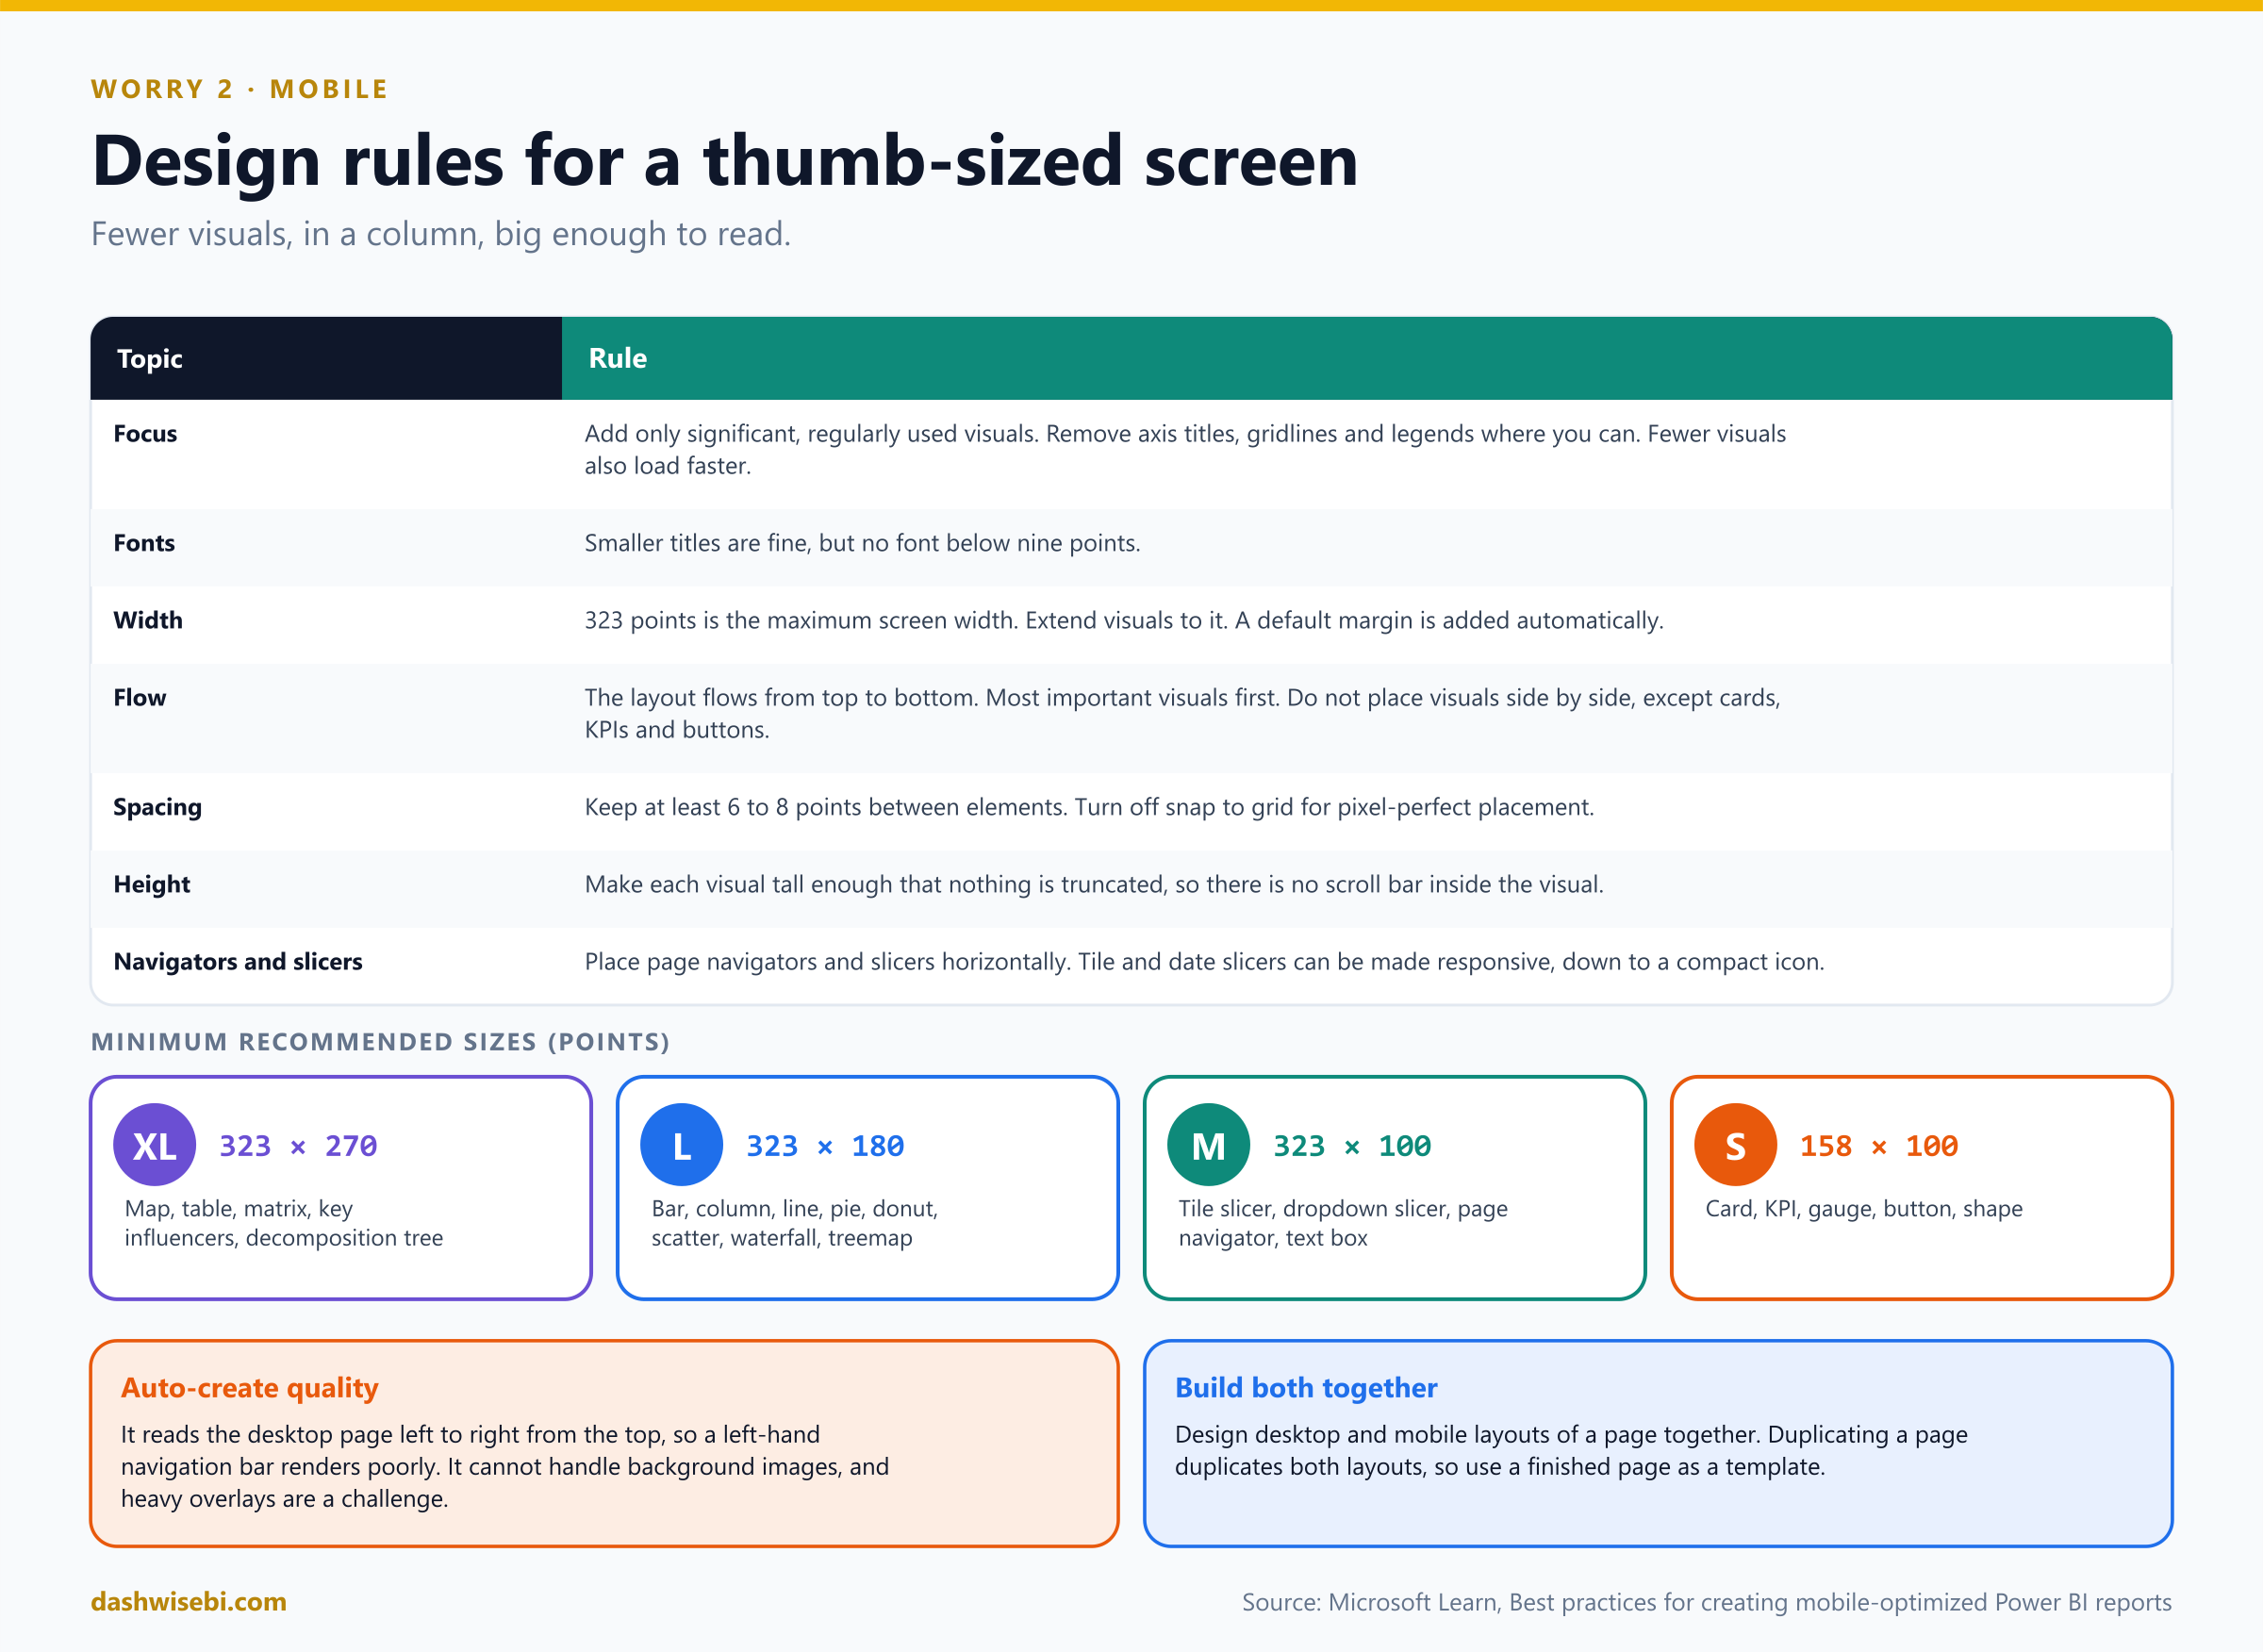
Pause and decide. Which design choices does Microsoft recommend for a phone layout?
Add only significant, regularly used visuals. Keep fonts at nine points or larger. Extend visuals to the maximum width of 323 points. Let the page flow top to bottom, with the most important visuals first, and do not put visuals side by side (except single-value visuals like cards, KPIs and buttons). Keep 6 to 8 points between elements. Make each visual tall enough to avoid a scroll bar inside it. Place page navigators and slicers horizontally.
Pause and decide. A map, a table and a card all go on the phone page. Which of them needs the most room?
The map and the table (size XL: at least 323 by 270 points). A card is S, at least 158 by 100 points. Bar, column and line charts are L (323 by 180), and slicers, navigators and text boxes are M (323 by 100).
Pause and decide. Anika changes a slicer selection on the mobile layout canvas, to test. What happens to the web layout?
Nothing carries over. Slicer selections made on the mobile canvas do not carry over to the web layout, and the published report uses the selections defined in the web layout. Tooltips are disabled on the canvas (they work in the app), and metric visuals are not interactive there.
Why: design both layouts together
- Build the desktop and mobile layouts of each page together. Duplicating a page duplicates both layouts, so use a finished page as a template.
- Auto-create places visible and hidden visuals, so bookmarks that change visibility still work in the generated layout.
- Tile and date slicers can be made responsive, so they can shrink to a compact icon on the phone.
- Fewer visuals also means faster loading.
The phone page now holds a card with today's orders, a KPI, one bar chart of reps and a tile slicer for the region. Vikram opens it on his phone, thumbs through it, and grins. “I can read it in a van.”
Exam lens
- View, Mobile layout. Auto-create or drag from Page visuals. Shows in the mobile apps, upright.
- 323 points maximum width. Nine points minimum font. Top-to-bottom flow.
- Auto-create struggles with vertical navigation bars and background images.
Worry 3. “Every rep wants a slightly different chart”
Vikram scrolls the feedback from the pilot. “Rekha wants the bar chart by product, not by region. Imran wants a line, not columns. If I send these to you I will be sending you requests until Christmas.”
Personalize visuals lets readers explore a visual in Reading view, without edit permission. They can adjust it and save it as a bookmark.
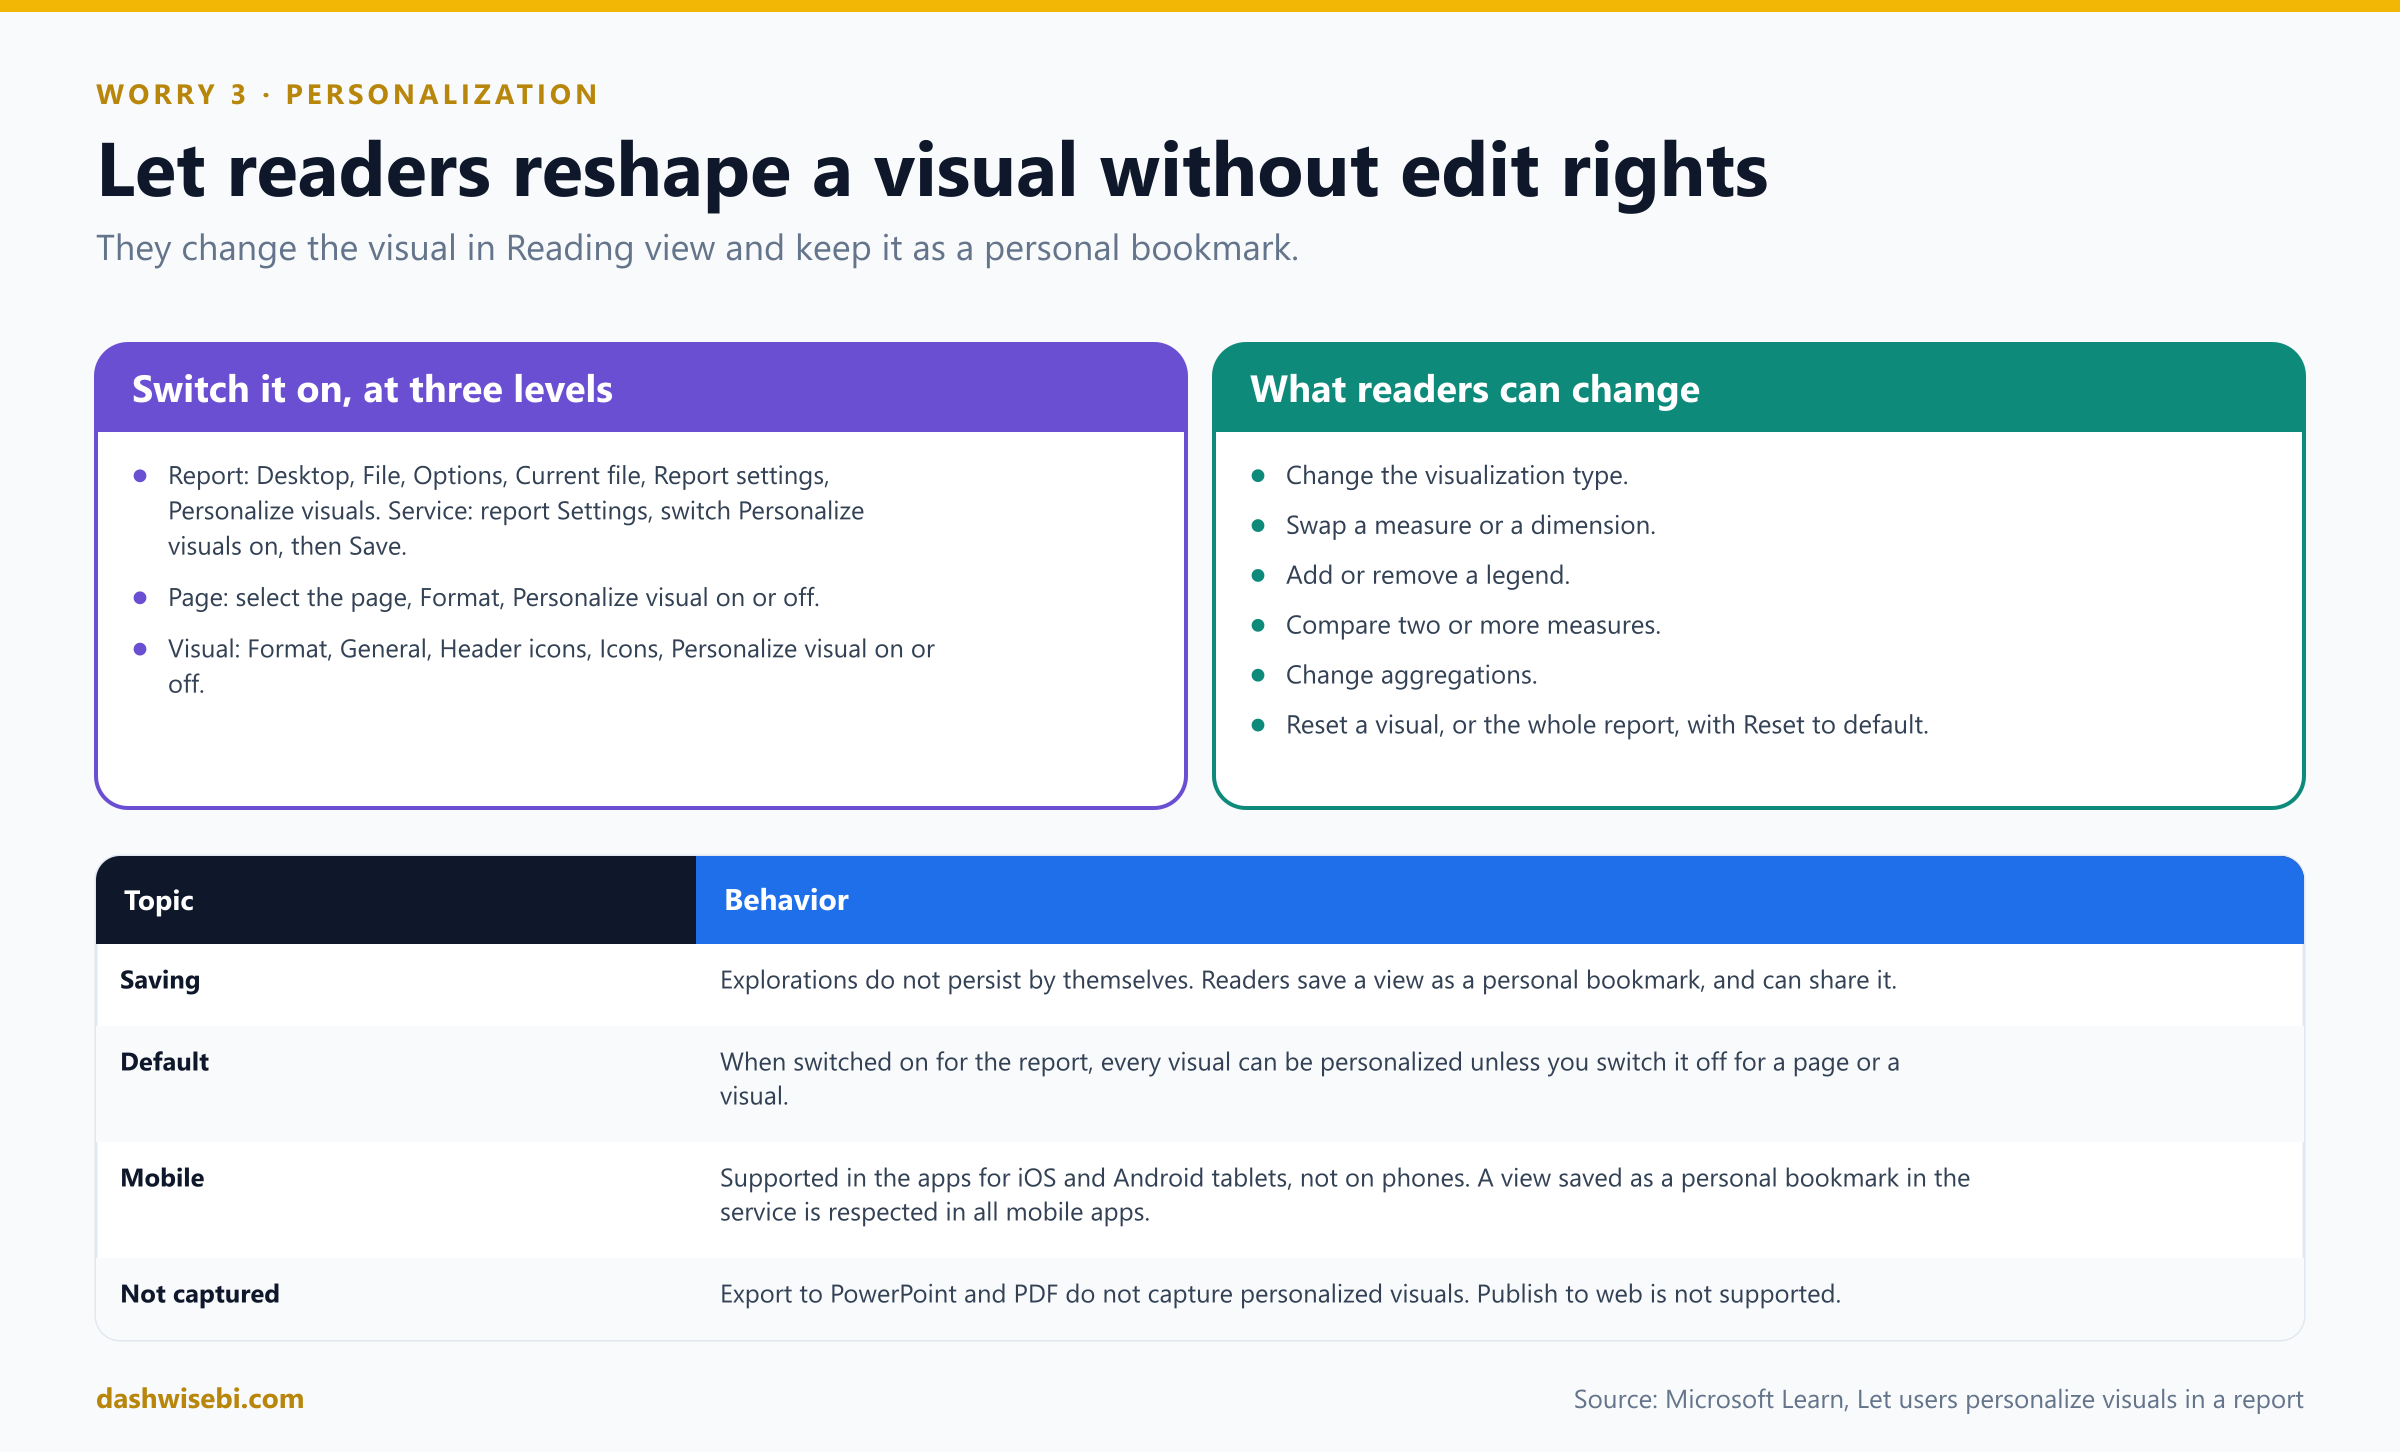
Pause and decide. How do you turn the feature on?
In Desktop: File, Options and settings, Options, Current file, Report settings, then select Personalize visuals. In the service open the report's Settings, switch Personalize visuals on and Save. It also works in embedded reports.
Pause and decide. With the feature on for the report, Anika does not want it on the page with the executive KPIs. How?
You can switch it on or off per page and per visual. For a page, select the page tab, open Format, and set Personalize visual to Off. For a visual, select it and go to Format, General, Header icons, Icons, and set Personalize visual to Off.
Pause and decide. Name five things readers can change in a personalized visual.
Change the visualization type, swap a measure or dimension, add or remove a legend, compare two or more measures, and change aggregations. They can also reset a visual or the whole report with Reset to default.
Pause and decide. Rekha personalizes her bar chart, closes the report, and comes back the next day. Is her version still there?
Not automatically. User explorations do not persist by themselves. She must save the view as a personal bookmark. Personal bookmarks can also be shared.
Pause and decide. Where is personalization not supported or not captured?
It is not supported for Publish to web. Export to PowerPoint and PDF do not capture personalized visuals. The mobile apps for iOS and Android tablets support it but the apps for phones do not. A change saved in a personal bookmark in the service is respected in all mobile apps.
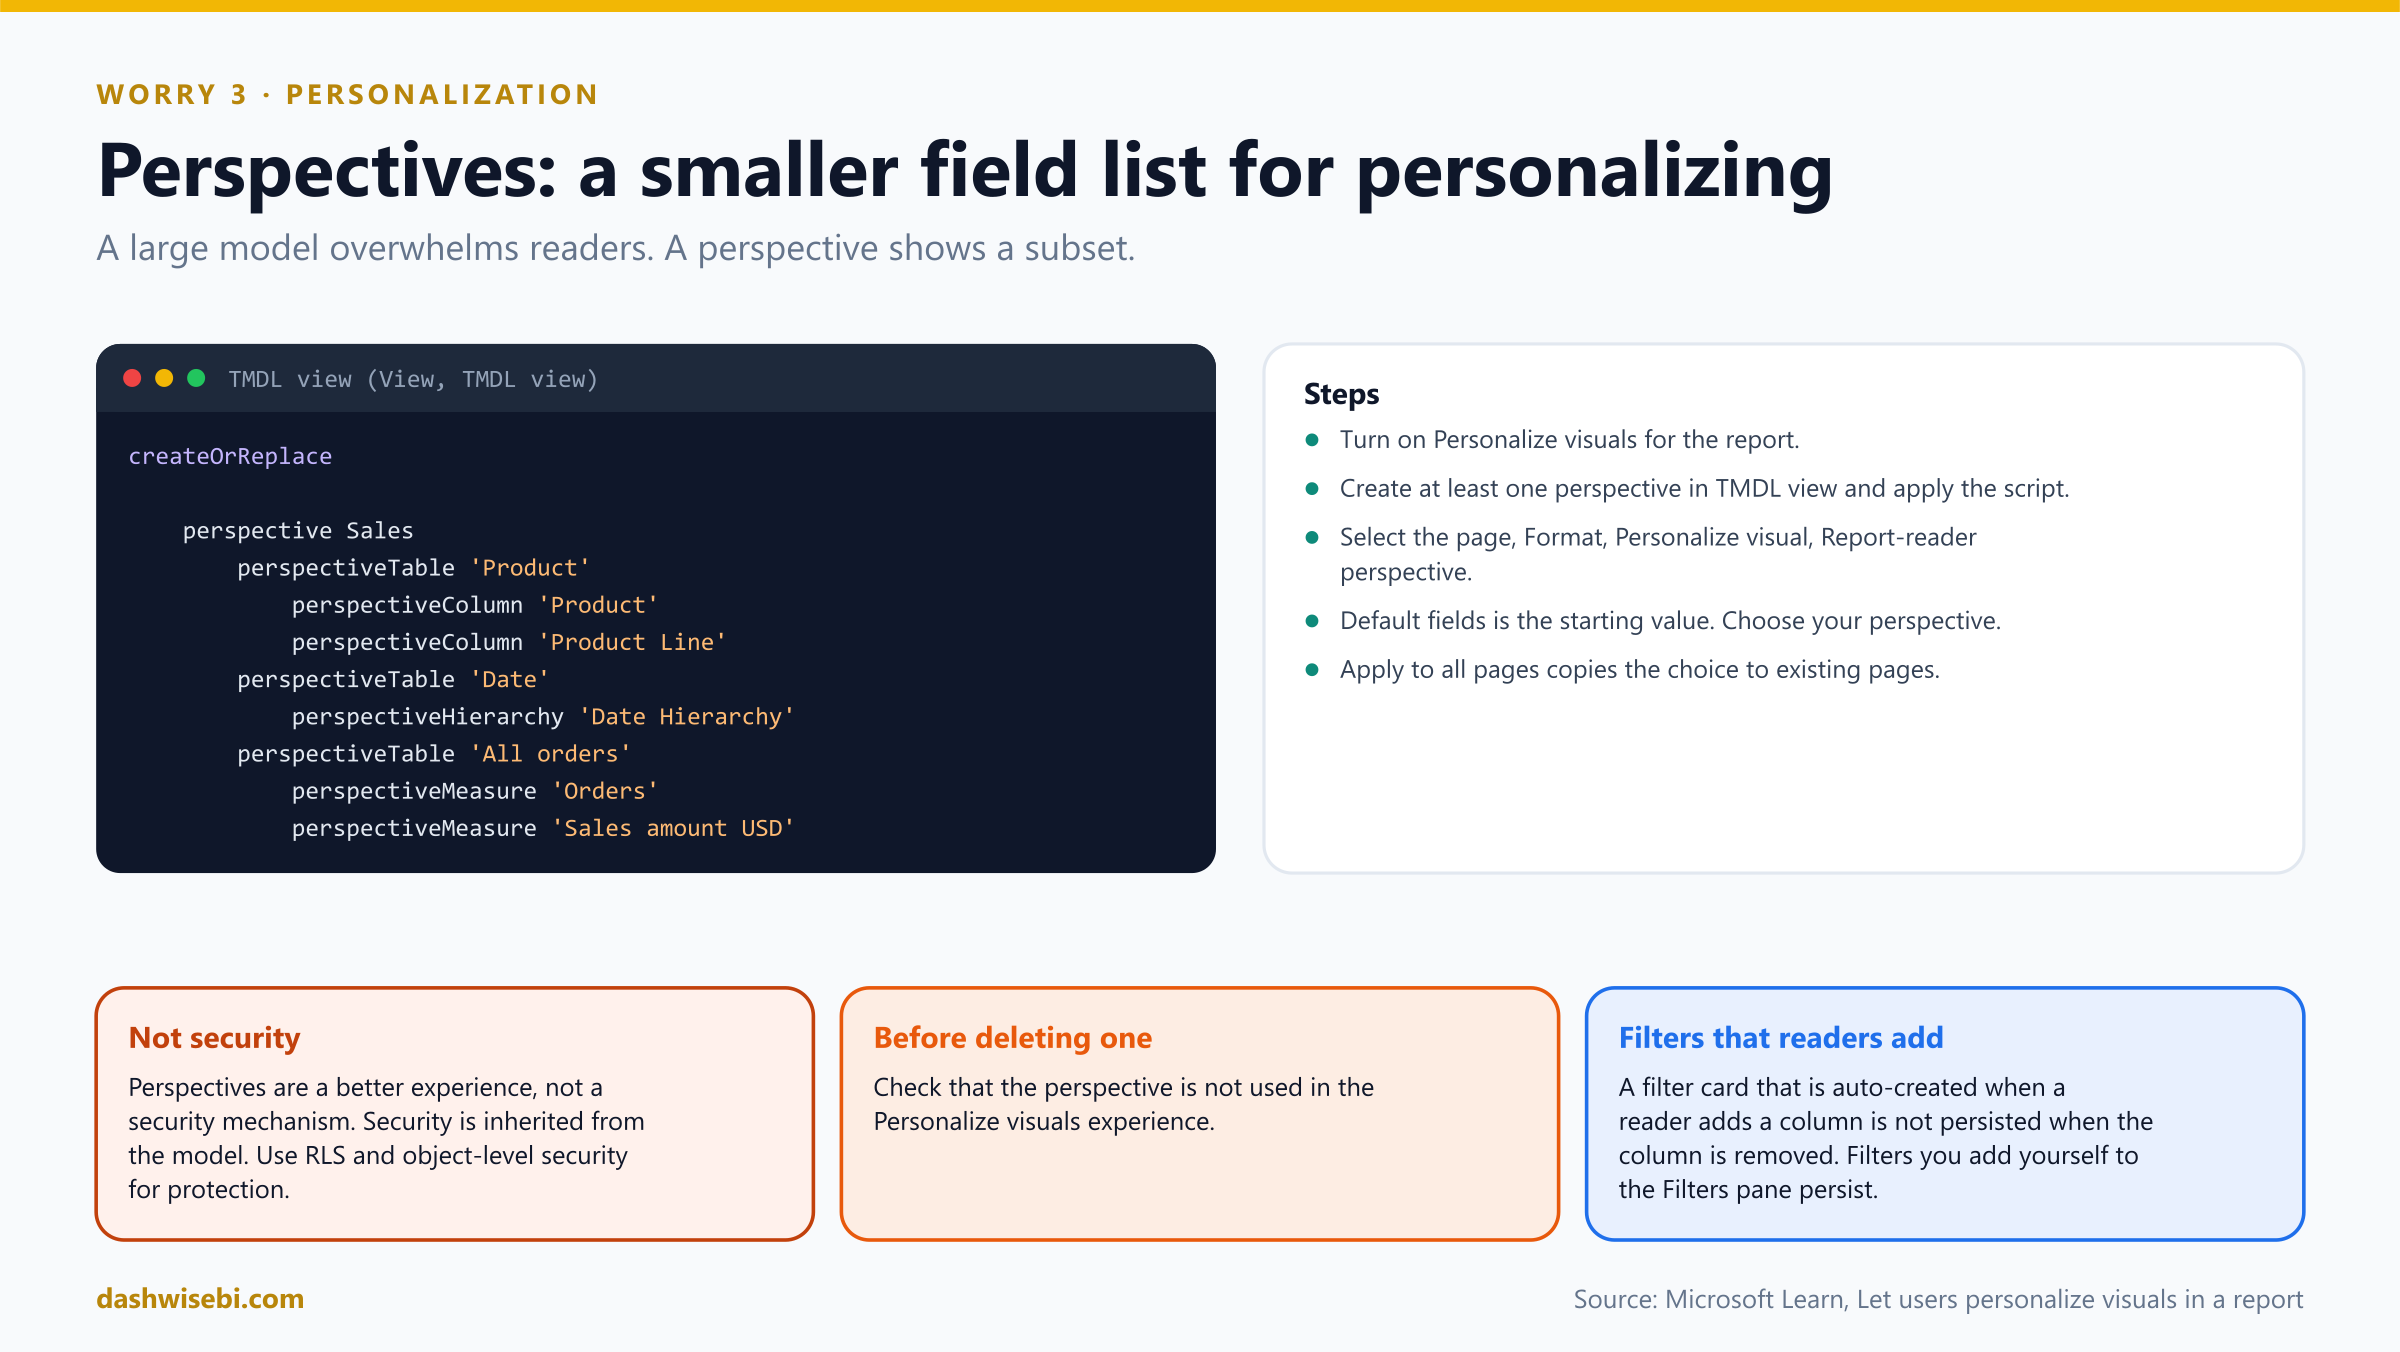
Pause and decide. The model has 200 fields and readers get lost in the field list. What can Anika do?
Create a perspective: a subset of the model with the tables, columns, hierarchies and measures you want readers to use. Create it in TMDL view (View, TMDL view), apply the script, then select the page and in Format, Personalize visual, set the Report-reader perspective (the default is Default fields). Apply to all pages copies the choice to all existing pages.
Pause and decide. The compliance team asks whether the perspective hides the salary column from reps. Does it?
No. Perspectives are for a better experience, not a security mechanism. All security is inherited from the underlying model, so use RLS and object-level security. Before deleting a perspective, check that it is not used in the personalization experience.
Why: it complements what you built
- It replaces a stream of small change requests with a self-service option, without giving anyone edit permission on the report.
- It is different from editing the report (which needs edit permission) and from bookmarks that you author (Episode 8).
- When a reader adds a column, a filter card is created automatically. Selections on that auto-created filter are not persisted if the column is removed. Filters that you, the author, add explicitly persist.
Rekha swaps the bar chart's axis to product, saves a personal bookmark called “My products”, and never sends Anika an email about it.
Exam lens
- Report settings, Personalize visuals. Per page and per visual toggles. Readers do not need edit permission.
- Not persistent: save a personal bookmark. Not in Publish to web. Not on phones.
- Perspectives (TMDL view) shorten the field list. They are not security.
Worry 4. “Three reps use screen readers or high contrast”
Vikram lowers his voice. “Three of our reps rely on assistive technology. HR told me the report must work for them. I do not know what that means for a chart.”
Accessibility means designing reports that people with disabilities can use effectively, including keyboard navigation, screen readers, high contrast and alternative text. Power BI gives you some of this for free, and you must do the rest.
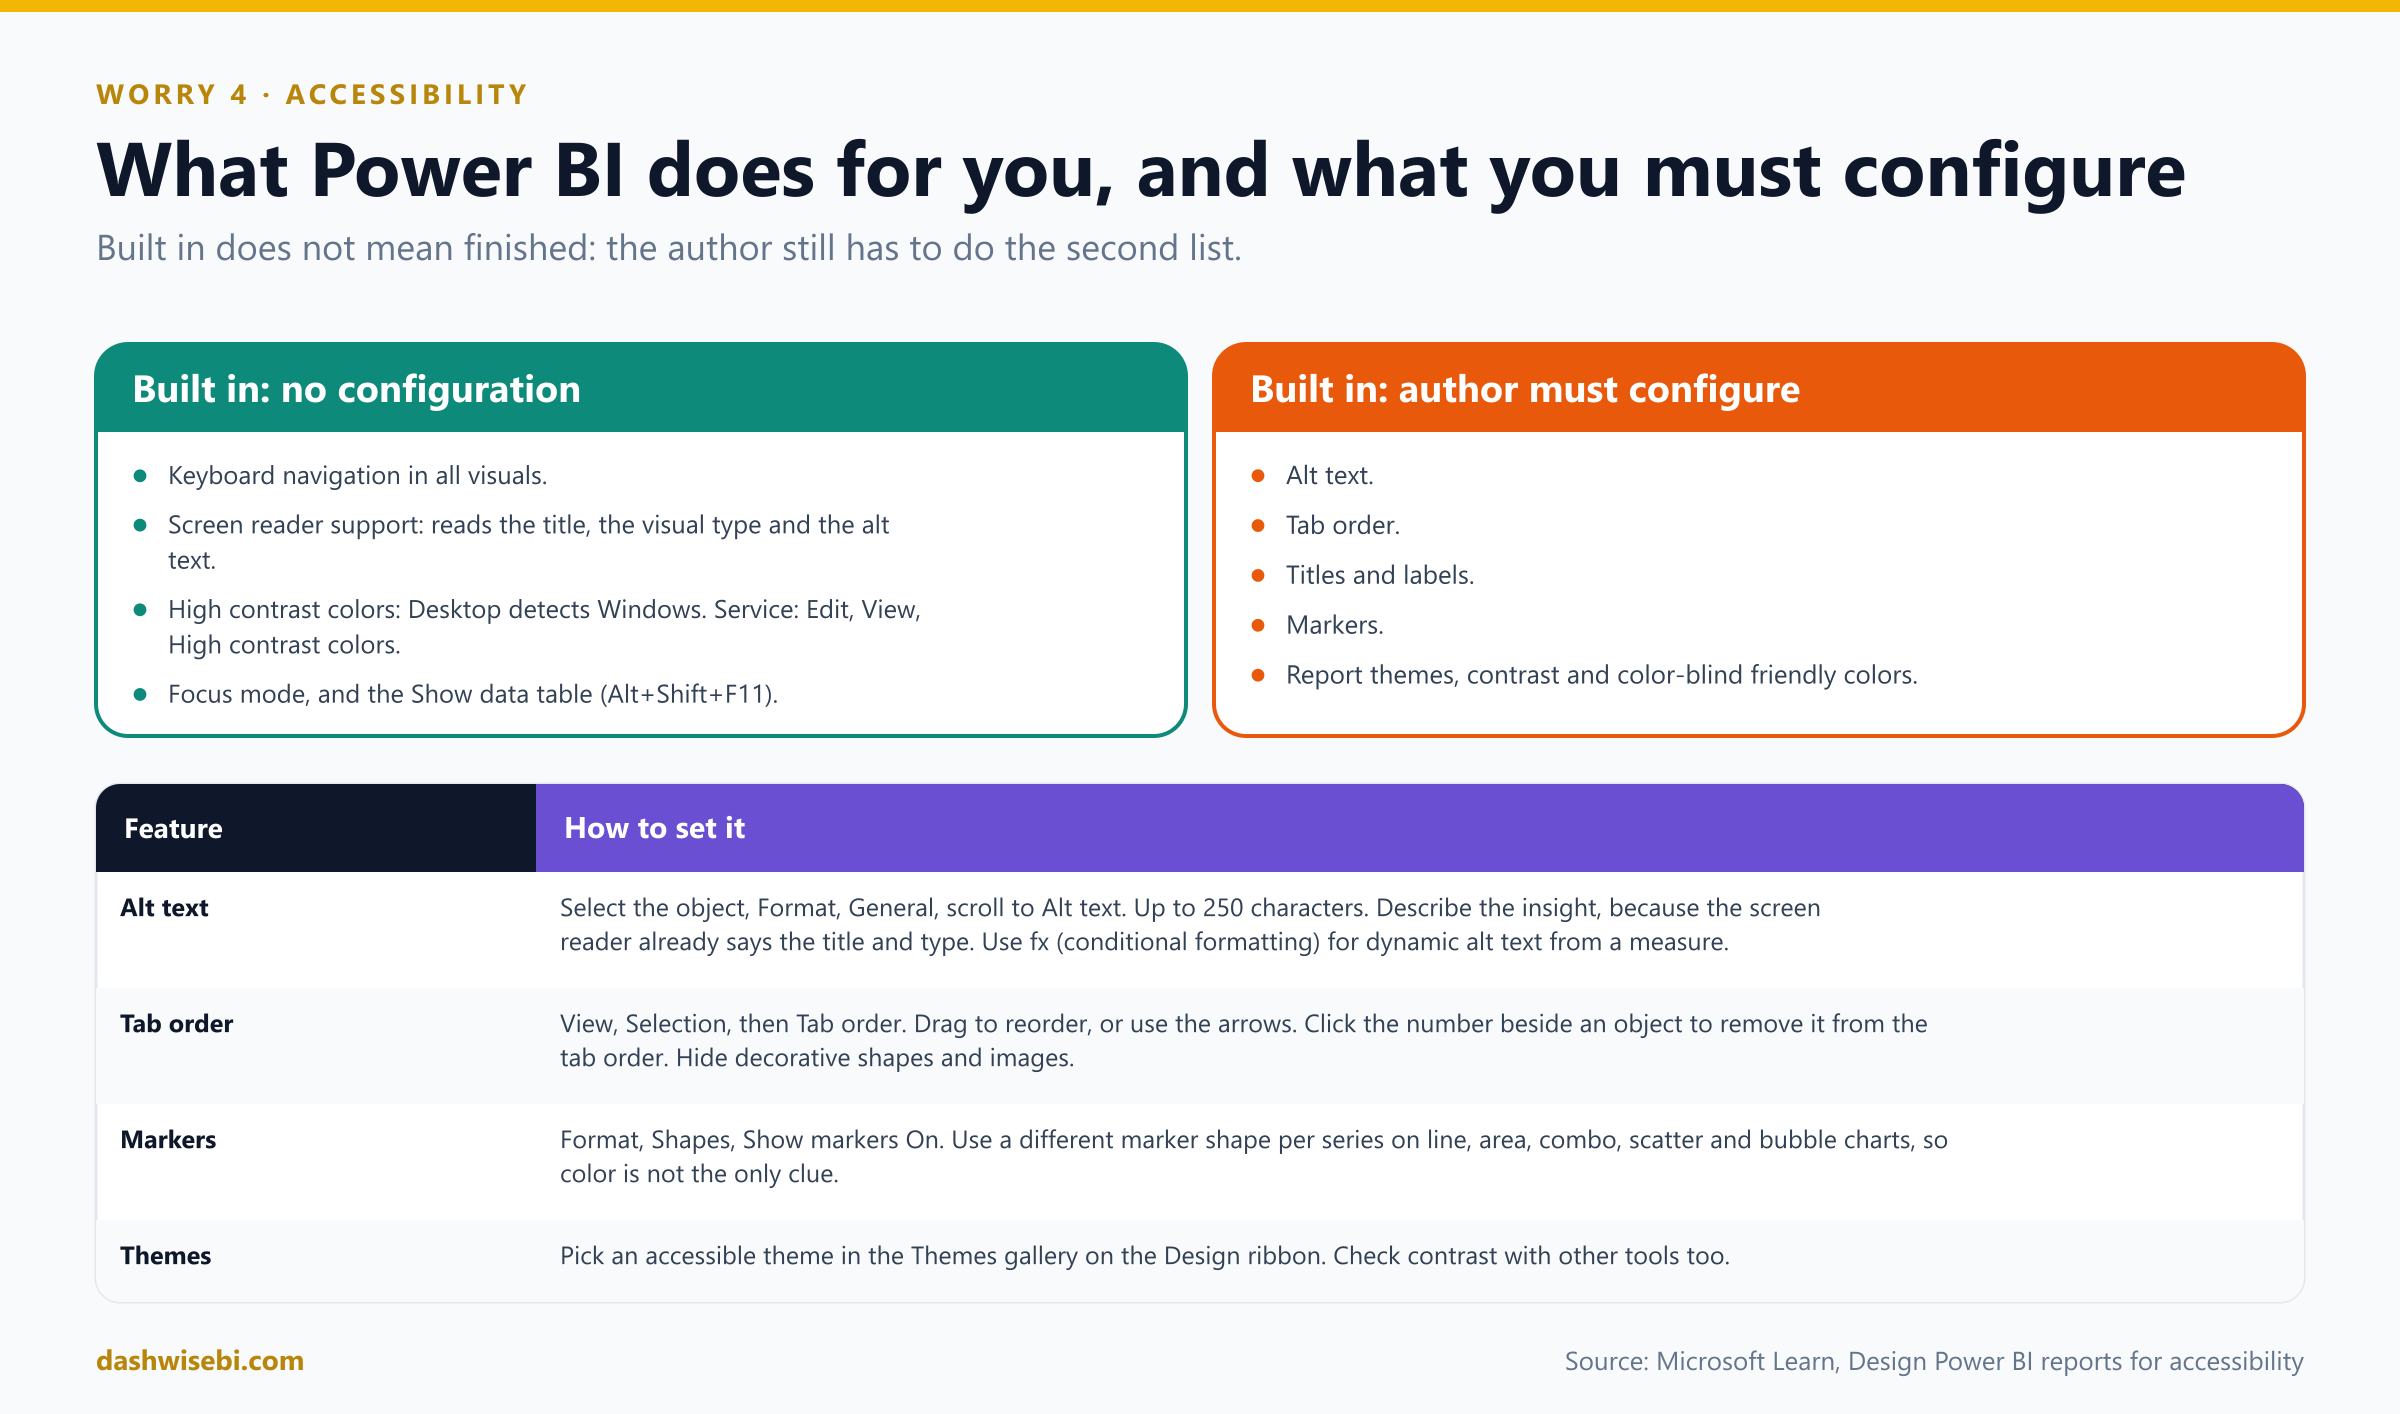
Pause and decide. Which of these are built in with no author configuration: alt text, keyboard navigation, tab order, high contrast colors, the Show data table?
Keyboard navigation, screen reader compatibility, high contrast colors, focus mode and the Show data table (Alt+Shift+F11) need no configuration. Alt text and tab order (and titles and labels, markers and themes) need the author.
Pause and decide. Where do you add alt text, and what should it say?
Select the object, open Format, General and scroll to Alt text. The limit is 250 characters. A screen reader already reads the title and the visual type, so describe what the visual shows and the insight, for example “Net user satisfaction by product color, broken down by product class”. Because data changes, use the fx conditional formatting icon to build dynamic alt text from a measure.
Pause and decide. Anika's page has a decorative logo and a background shape. What should happen to them for keyboard users?
Remove them from the tab order. Open View, Selection, switch to Tab order, and click the number next to the object to hide it from the order. The same pane lets you drag or use arrows to set the order so it matches how people read the page.
Pause and decide. A line chart shows Sales in green and Returns in red. Why is this a problem, and what is the fix?
Color is the only thing that distinguishes the series, and green and red are a combination that is hard to tell apart. The fix: turn on markers (Format, Shapes, Show markers) and use a different marker shape for each line, using Customize series. This applies to line, area, combo, scatter and bubble charts. Do not turn on every label and marker either: if your eyes go to the labels first, switch them off.
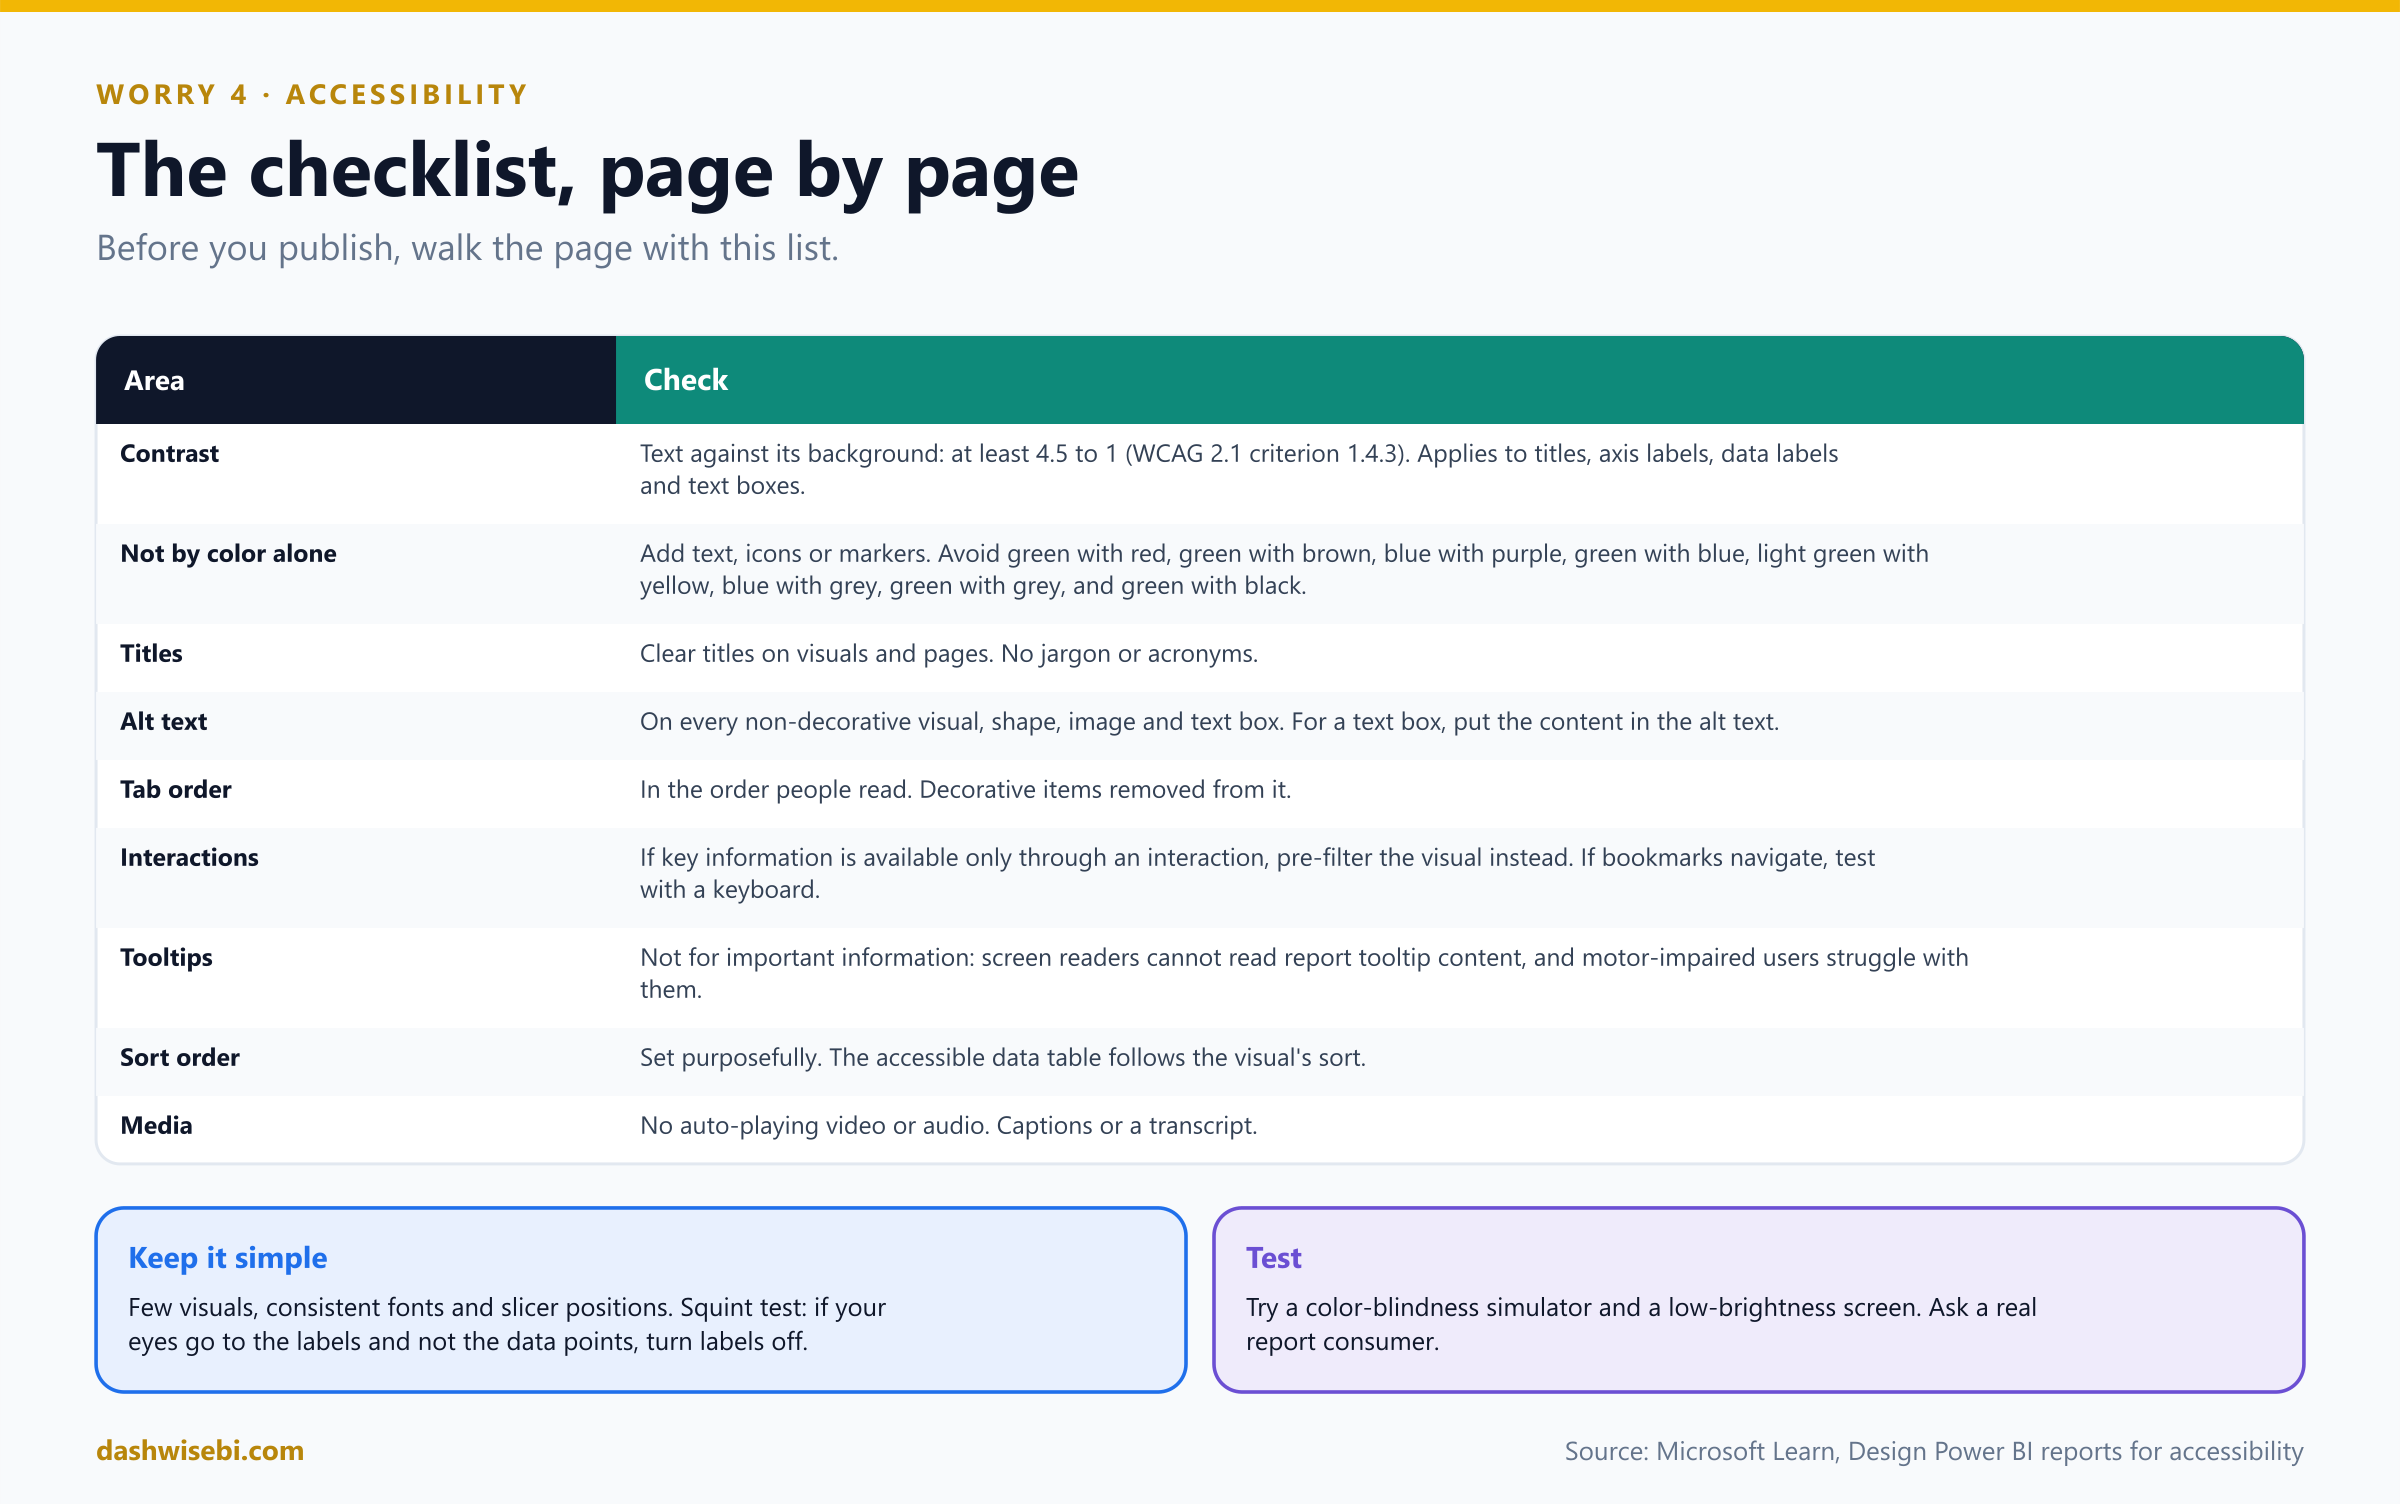
Pause and decide. What contrast ratio should text have against its background?
At least 4.5 to 1 (WCAG 2.1 success criterion 1.4.3). That applies to titles, axis labels, data labels and text in text boxes.
Pause and decide. Which color pairs should you avoid on the same chart or page?
Green and red, green and brown, blue and purple, green and blue, light green and yellow, blue and grey, green and grey, and green and black. A monochrome palette or fewer colors helps. You can also choose an accessible built-in theme from the Themes gallery on the Design ribbon.
Pause and decide. Anika puts the region manager's name in a tooltip page. Is that a good idea?
No. Do not use tooltips for important information. Screen readers cannot read the content of report tooltips, and users with motor problems or without a mouse have trouble reaching them. Use tooltips for ancillary information.
Pause and decide. A key conclusion appears only after a reader clicks a bar to cross-filter. Is that a problem?
Yes. If key information is available only through an interaction, rearrange the visuals so they are pre-filtered and the conclusion is obvious. If you use bookmarks for navigation, try the report with a keyboard only.
Why: accessibility is mostly good design
- Titles. Clear titles for visuals and pages. No acronyms like “CY Totals”. Write “Current Year Sales Amount USD Totals”.
- Sort order. The accessible Show data table shows data in the order you set. Set it on purpose (Episode 8).
- Media. No video or audio that plays automatically. Provide captions or a transcript. If you use the Play axis custom visual, do not let it auto play.
- High contrast. Desktop detects the Windows high contrast theme and applies it. In the service, in Edit mode choose View, High contrast colors.
- Keep it simple and consistent. Few visuals, the same fonts, and slicers in the same place on every page. Test by dimming the screen, with a color-blindness simulator, and by asking a real user.
- When you export to PowerPoint, items without alt text get the default text “No alt text provided”.
One of the three reps, Meena, opens the page with a screen reader. It reads the title of each chart, then Anika's alt text, then moves through the visuals in reading order, and skips the logo. Meena says one word: “Finally.”
Exam lens
- Alt text (Format, General, 250 characters, fx for dynamic). Tab order (View, Selection). Markers. Contrast 4.5:1.
- Built in: keyboard, screen reader, high contrast, focus mode, Show data table.
- Do not use color alone. Do not put key information in tooltips.
Worry 5. “Dispatch needs the numbers live, not nightly”
The last line on Vikram's list. “Dispatch watches the trucks. If a truck breaks down at 2 p.m., they must see it at 2:01, not tomorrow.”
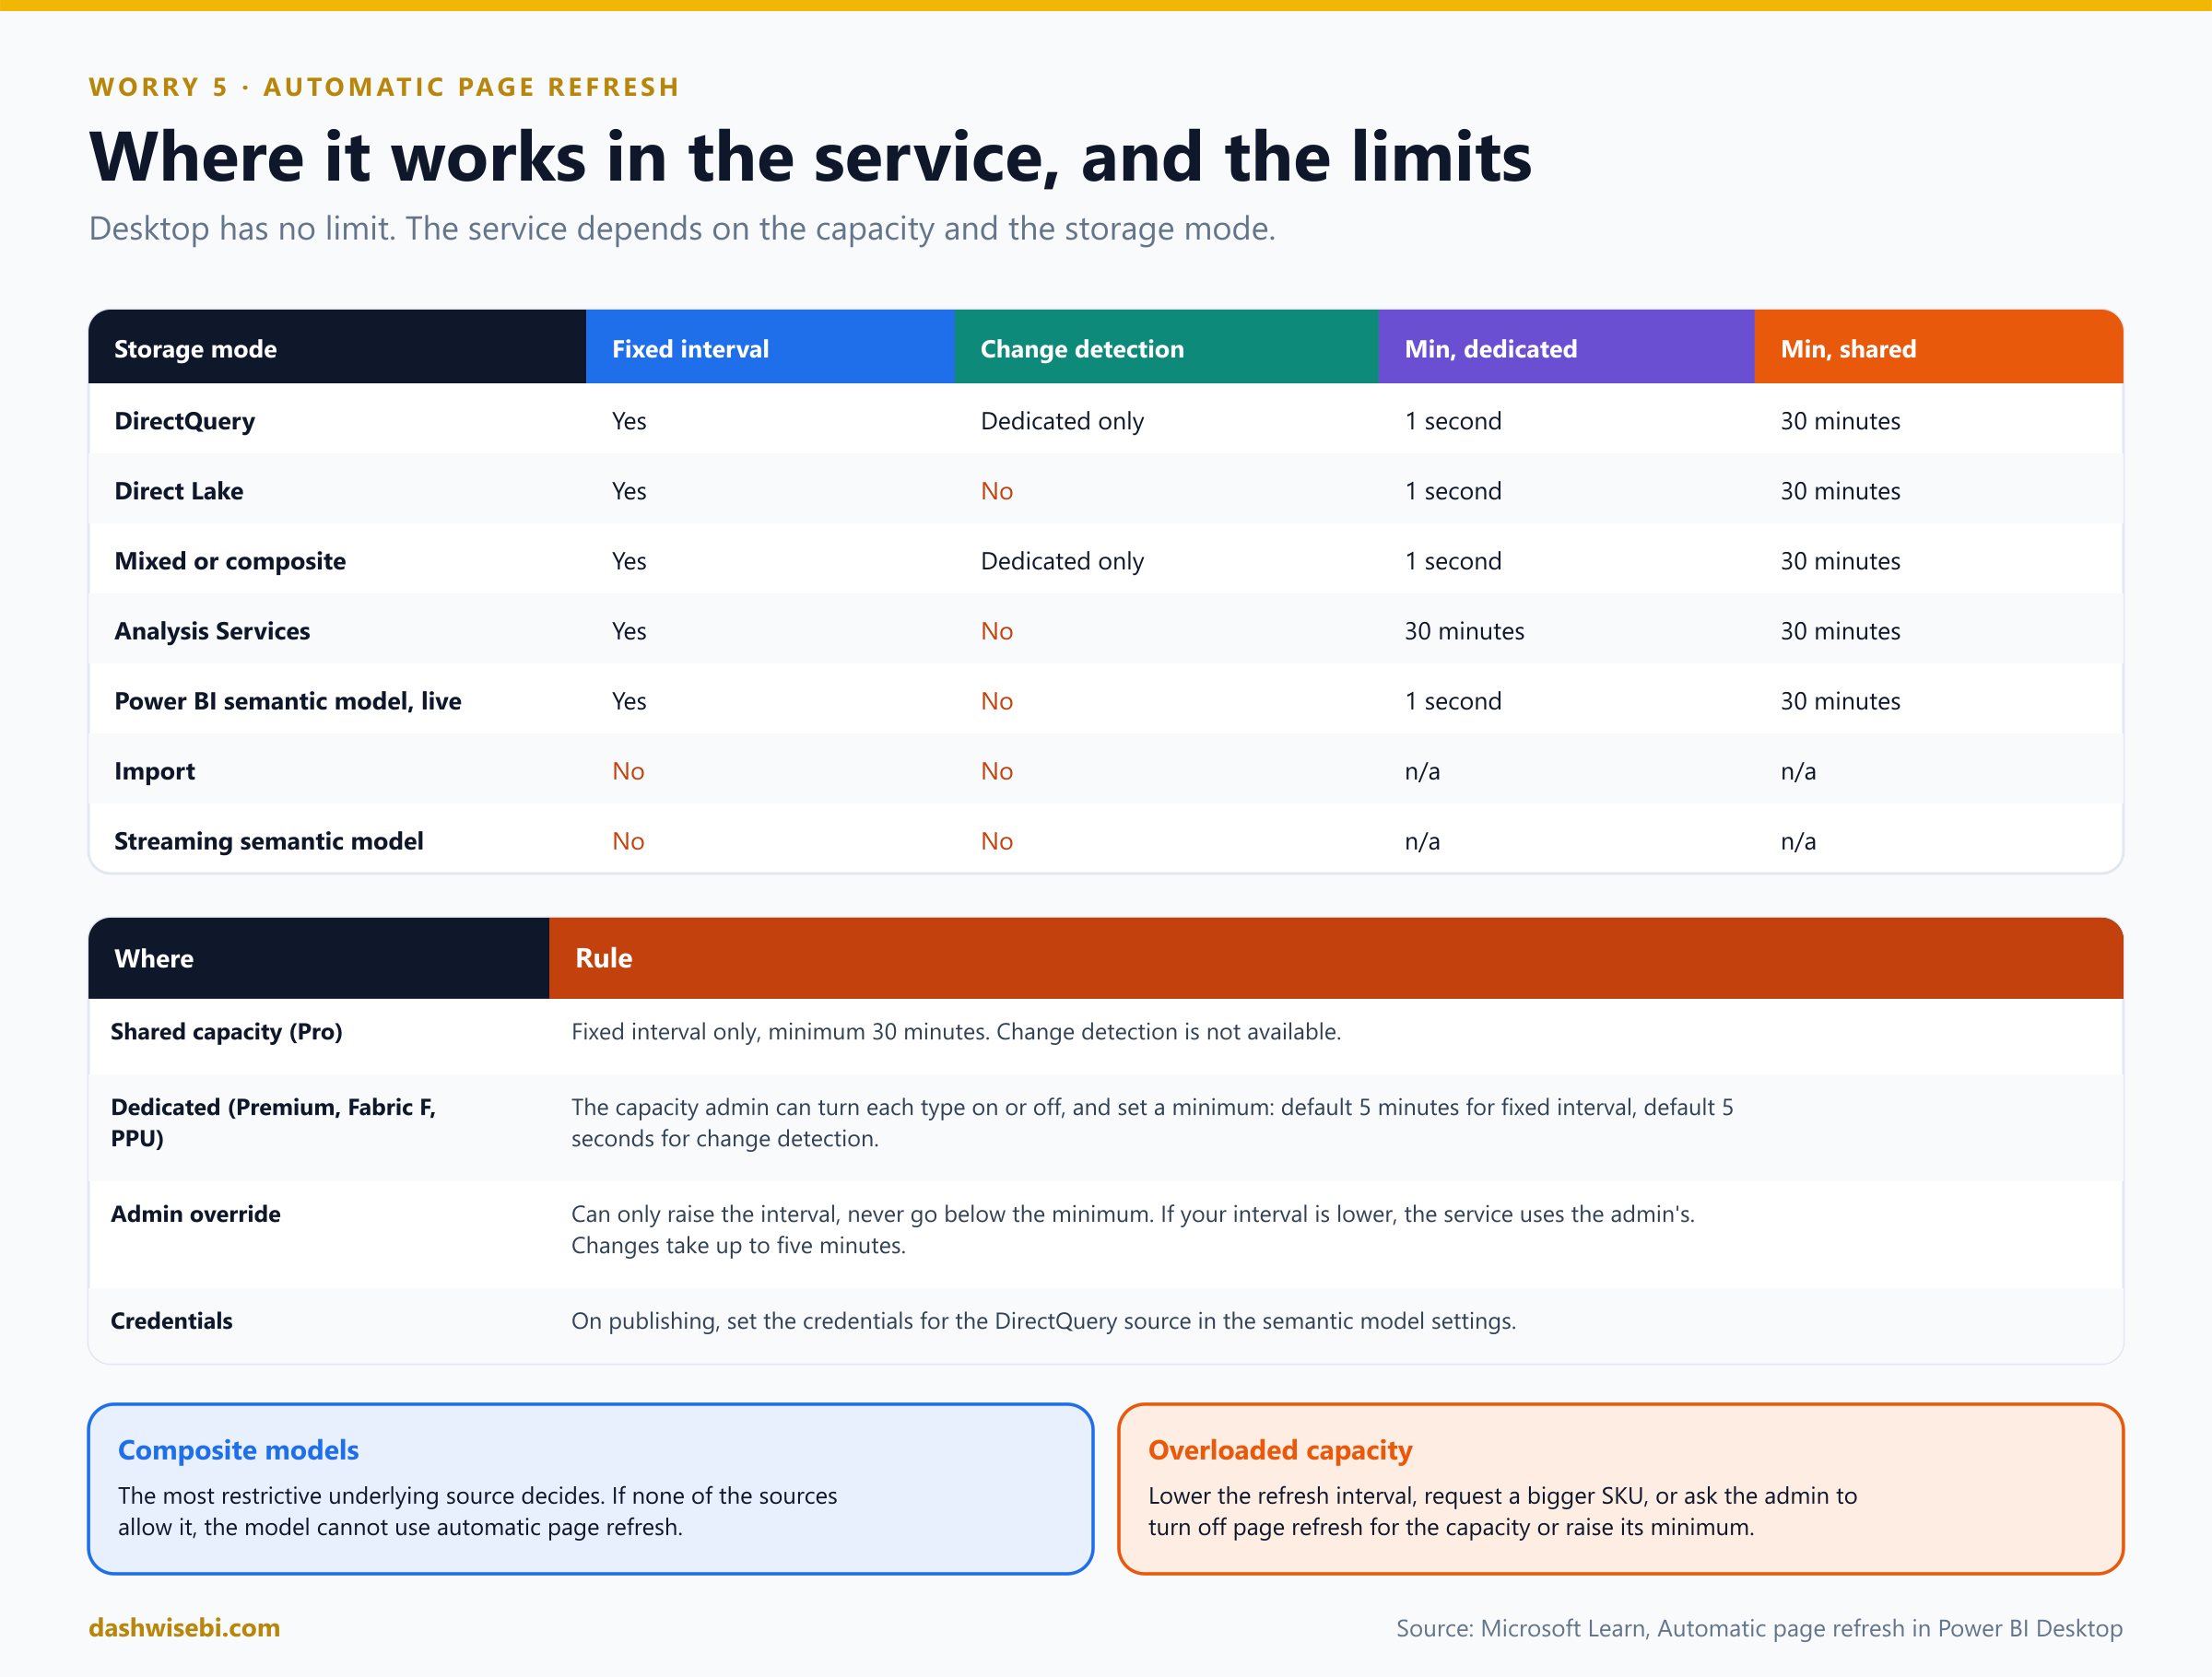
Automatic page refresh (APR) makes the open report page query for new data at a set cadence. It is for DirectQuery sources. You configure it per page, in Format, Page refresh.
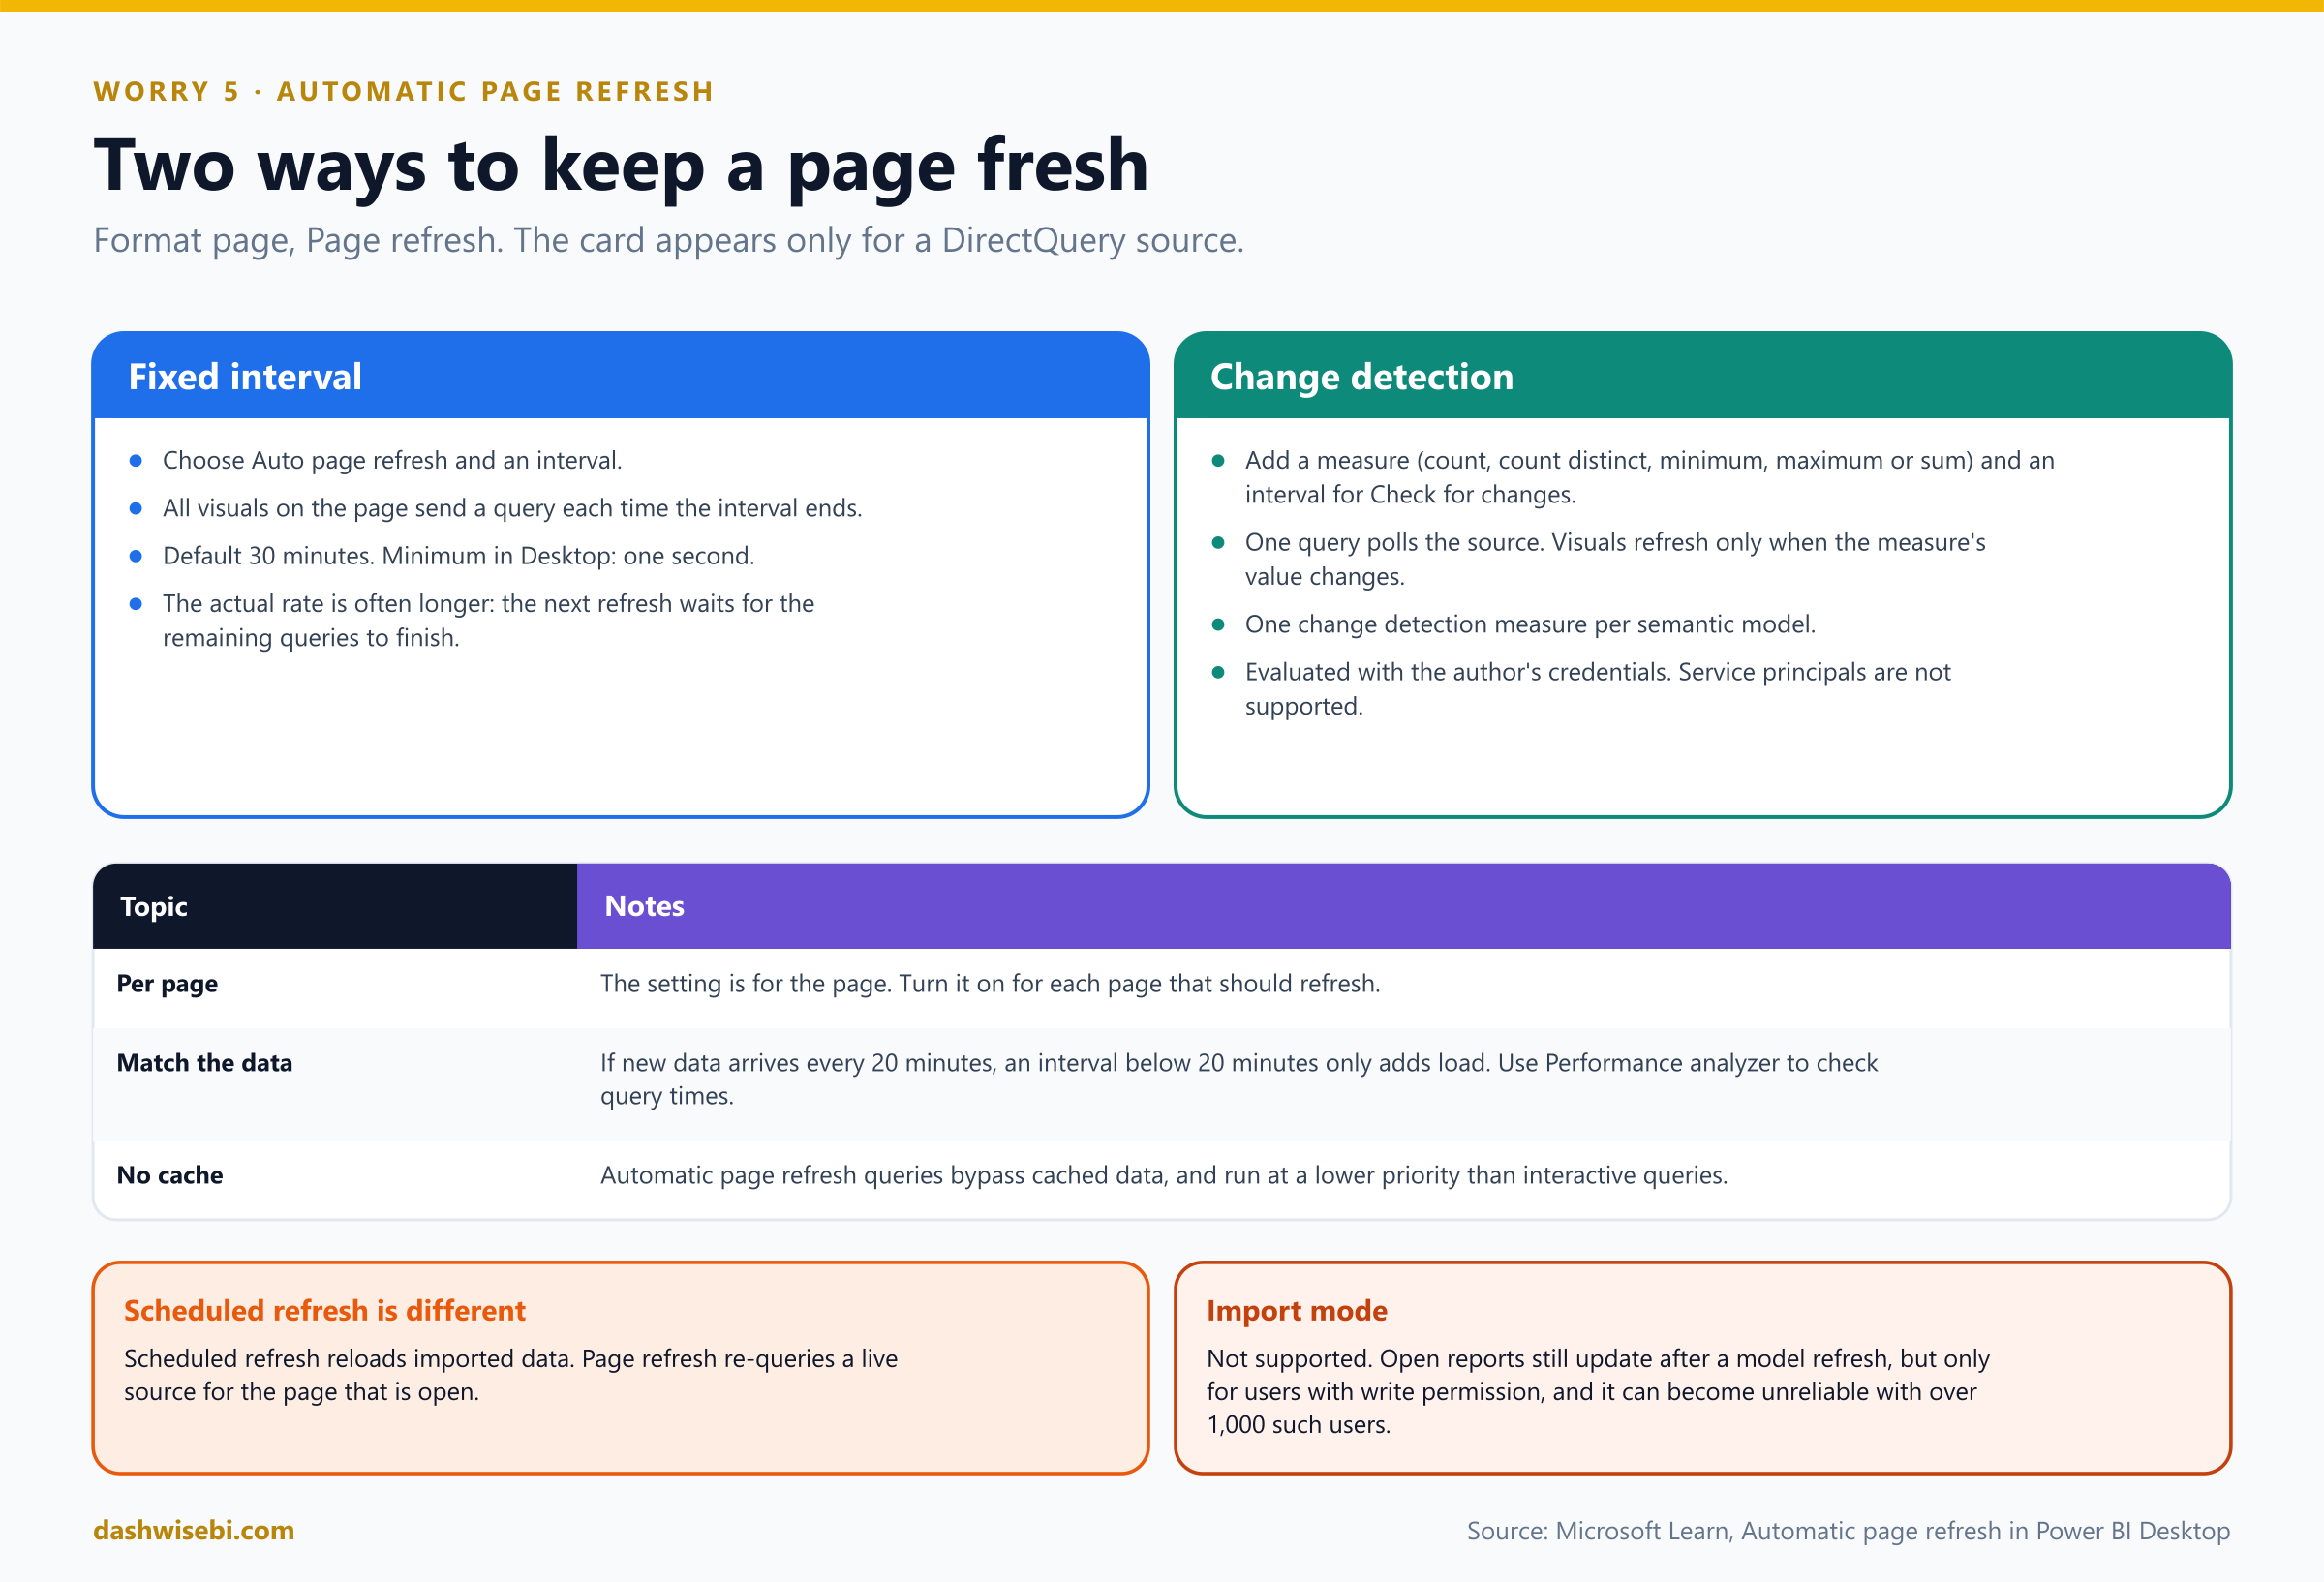
Pause and decide. Anika opens the Format pane for the page and cannot find Page refresh. What is the most likely reason?
The model uses Import mode. The Page refresh card only appears when the report is connected to a DirectQuery source (or some live connection scenarios). Import does not support automatic page refresh. To use it, change the connection to DirectQuery.
Pause and decide. What are the two refresh types?
Fixed interval: every visual on the page sends an update query at a constant interval. Change detection: Power BI polls the source with a measure, and refreshes the visuals only when the value of that measure changes.
Pause and decide. Set up change detection. What do you create?
Choose Change detection as the type, then Add change detection (also on the Modeling tab). Pick an existing measure, or create one with a calculation: count, count distinct, minimum, maximum or sum. For example, count distinct truck IDs. Then set how often Power BI should check for changes. There can be only one change detection measure per model.
Pause and decide. A fixed interval of one second is set, but each query takes about five seconds. How often does the page refresh?
About every five seconds. Power BI sends the next refresh queries only after all the remaining refresh queries are complete. All automatic page refresh queries also run at a lower priority than interactive queries and bypass the cache.
Pause and decide. Anika publishes a report with a one-second interval to a Pro workspace on shared capacity. What happens?
Fixed interval refresh is allowed, but the minimum is 30 minutes. Change detection is not available on shared capacity. Desktop itself has no restriction (as often as every second).
Pause and decide. The workspace is on a Premium capacity, but the report refreshes only every 5 minutes. Why?
The capacity admin sets a minimum refresh interval for fixed interval (the default is five minutes). If your interval is lower, the service overrides it with the admin's minimum. For change detection the admin sets a minimum execution interval (the default on the Desktop page is five seconds). The admin can also turn each type off. An admin override can only raise the interval, never go below the minimum. Changes take up to five minutes to reach reports.
Pause and decide. When you publish, what must you set so the page can query the source?
The credentials for the DirectQuery source in the semantic model settings. A change detection measure is evaluated with the author's credentials, and service principals are not supported for it.
Pause and decide. The dispatch model is a composite model with two DirectQuery sources, one of them on a 1-hour minimum. What interval applies?
The most restrictive underlying source decides, so one hour. If none of the underlying sources allow automatic refresh, the composite model cannot use it.
Why: freshness has a cost
- Match the interval to the data. If new data arrives every 20 minutes, an interval shorter than 20 minutes just adds load. If it arrives every second, one second is right, if the source can cope.
- Change detection is easier on the source. One query polls for changes, whatever the number of viewers, and all visuals refresh only when something changed.
- Use Performance analyzer (Episode 4) to check that each visual's query returns within the interval. Learn's example: 5 visuals times 10 users is about 50 queries per refresh with fixed interval.
- It is different from scheduled refresh, which reloads imported data. For imported models, an open report page also updates after a model refresh, but only for users with write permission, and that can become unreliable when there are over 1,000 of them.
- If the capacity is overloaded: lower the interval, request a larger SKU, or ask the admin to turn off page refresh or raise the minimum.
- Direct Lake models support fixed interval but not change detection.
Anika sets change detection on a truck-count measure, with a check every five seconds, on a Premium workspace. At 2:00 a truck breaks down. At 2:01 dispatch sees the red tile. Vikram folds his list in four and puts it in his pocket.
Exam lens
- Format, Page refresh, per page. Only for DirectQuery (and some live connections). Not Import.
- Fixed interval (default 30 minutes, minimum one second in Desktop) versus change detection (a measure, one per model, Premium only).
- Shared capacity: 30 minutes, no change detection. Dedicated: admin minimum (the default for fixed interval is 5 minutes).
Monday: ten quick calls
The report goes live. At the Monday stand-up Vikram asks ten questions. Answer in your head first, then open each one.
Pause and decide. 1. Where do you limit what readers export from the report?
Report settings, Export data. The admin setting still wins.
Pause and decide. 2. Which export format cannot carry a sensitivity label?
.csv.
Pause and decide. 3. How do you give a page a phone layout, and where does it appear?
View, Mobile layout. It appears in the mobile apps when the phone is upright.
Pause and decide. 4. What is the maximum mobile canvas width and the minimum font size?
323 points, and nine points.
Pause and decide. 5. Which setting lets readers swap a measure without edit permission?
Personalize visuals. They save the view as a personal bookmark.
Pause and decide. 6. Does a perspective protect sensitive columns?
No. It is not a security mechanism.
Pause and decide. 7. Where do you add alt text, and how long can it be?
Format, General, Alt text. 250 characters.
Pause and decide. 8. How do you stop a screen reader announcing a decorative image?
Remove it from the tab order in the Selection pane.
Pause and decide. 9. Which refresh type is not available on shared capacity?
Change detection.
Pause and decide. 10. Automatic page refresh is missing from the Format pane. What do you check?
Whether the model uses Import mode.
The cheat sheet
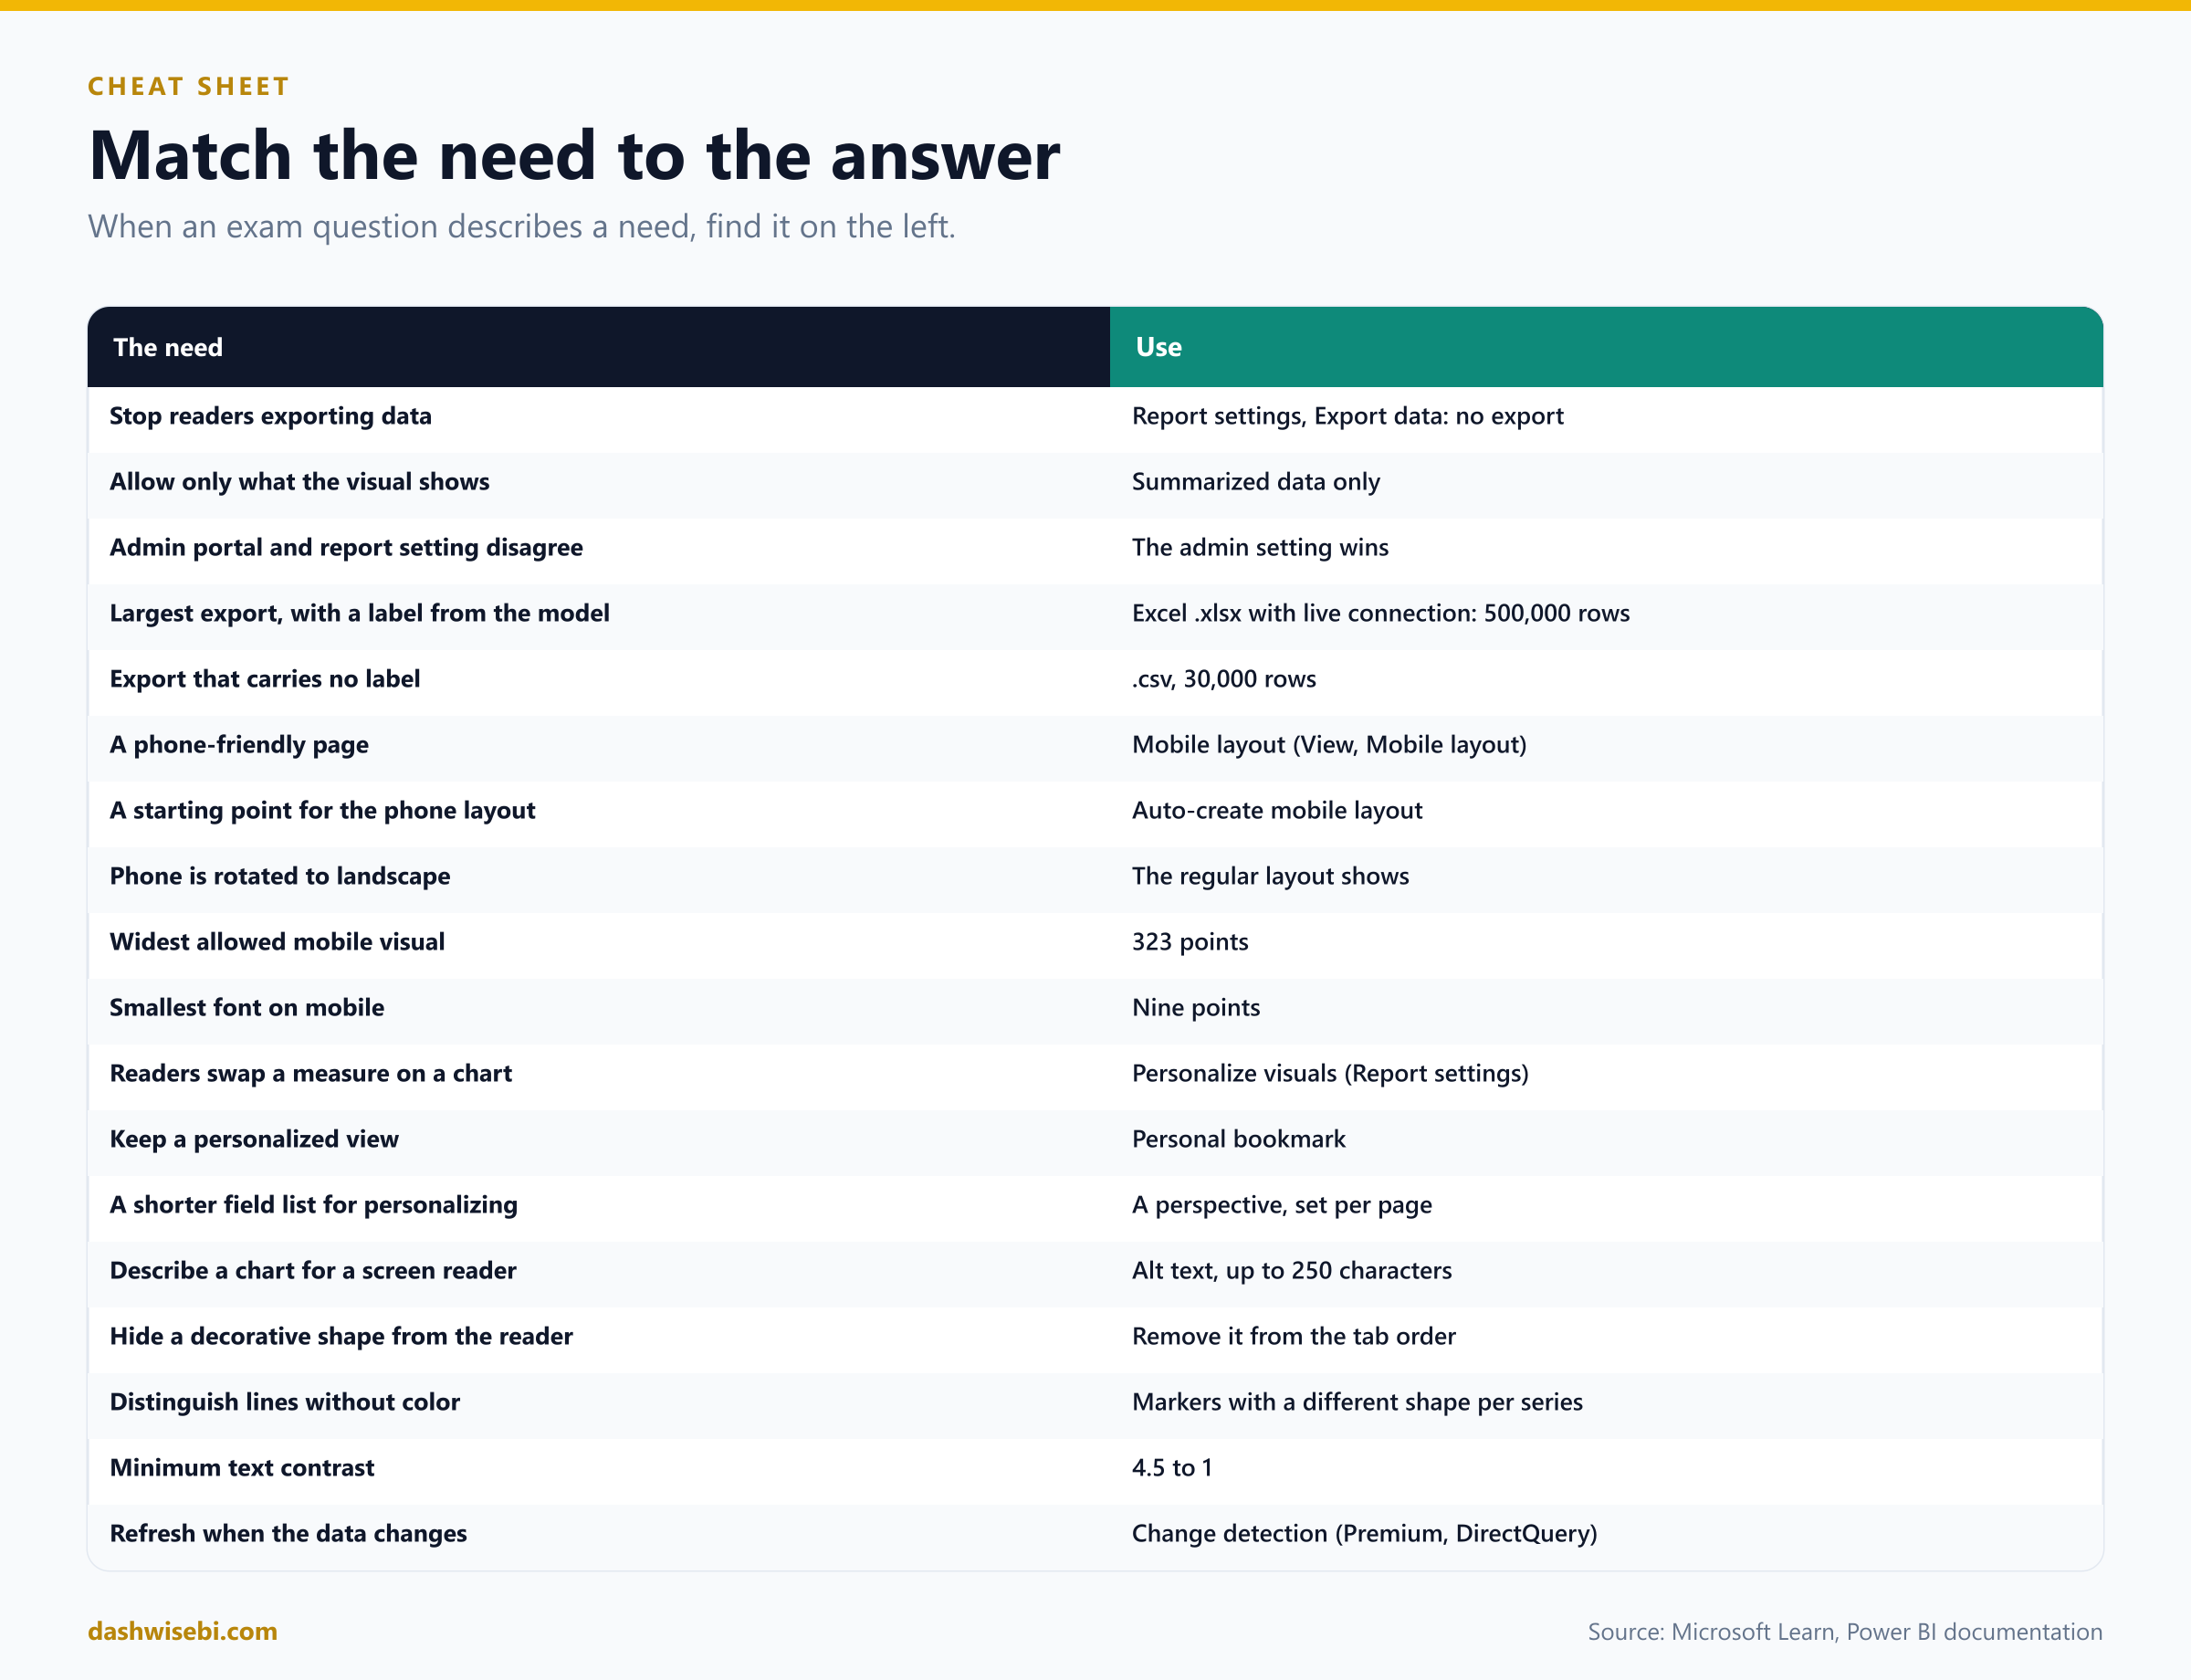
Myth or fact?
- “The report setting beats the admin portal on export.” Myth. The admin setting wins.
- “A .csv export keeps the sensitivity label.” Myth.
- “The mobile layout shows in a phone's web browser.” Myth. Only in the mobile apps.
- “Publishing a mobile layout needs a separate file.” Myth. It goes with the main report.
- “Personalized visuals persist automatically.” Myth. Save a personal bookmark.
- “Perspectives hide data from users.” Myth.
- “Power BI describes my charts to a screen reader automatically.” Myth. It reads the title and type. You add the alt text.
- “Tooltips are a good place for key facts.” Myth.
- “Automatic page refresh works with Import.” Myth.
- “The admin can set a refresh interval below the minimum.” Myth. An override can only raise it.
Where to go next
- Open a report, switch Export data to summarized only, and try exporting underlying data in the service.
- Build a phone layout with auto-create, then fix it by hand. Check font sizes and widths.
- Turn on Personalize visuals, change a chart in Reading view, and save a personal bookmark.
- Run through the accessibility checklist on one of your pages: alt text, tab order, markers, contrast.
- Connect to a DirectQuery source, add a change detection measure and watch it in Performance analyzer.
- Read the sources behind this post: PL-300 study guide, Export data from a Power BI visualization, Change settings for Power BI reports, Mobile-optimized Power BI reports overview, Mobile layout view, Best practices for mobile-optimized reports, Let users personalize visuals, Design Power BI reports for accessibility, Create accessible reports in Power BI Desktop and Automatic page refresh in Power BI Desktop.
Keep reading
PL-300 Episode 8: Interactivity & Navigation
PL-300 as a usability test: sorting, interactions, sync slicers, tooltips, drillthrough, navigation, the Selection pane and bookmarks.
PL-300 Episode 7: Secure & Govern Power BI
PL-300 as an audit week: workspace roles, sharing, semantic model access, row-level security, RLS group membership and sensitivity labels.