DP-700 Episode 9: Resolving Errors II & Optimization I

PowerBI consultant ·
Welcome to Episode 9 of our DP-700 series. In Episode 8 we learned where to look when something breaks and how to fix pipeline, dataflow and notebook errors. This episode continues with more error types and then begins the optimization topics. These are the five topics from the session outline:
- Identify and resolve Eventstream errors
- Identify and resolve T-SQL errors
- Identify and resolve OneLake shortcut errors
- Optimize a Lakehouse table
- Optimize a pipeline
The first three are about diagnosis: read the signal, name the cause, apply the fix. The last two are about tuning: measure first, then change one setting at a time.
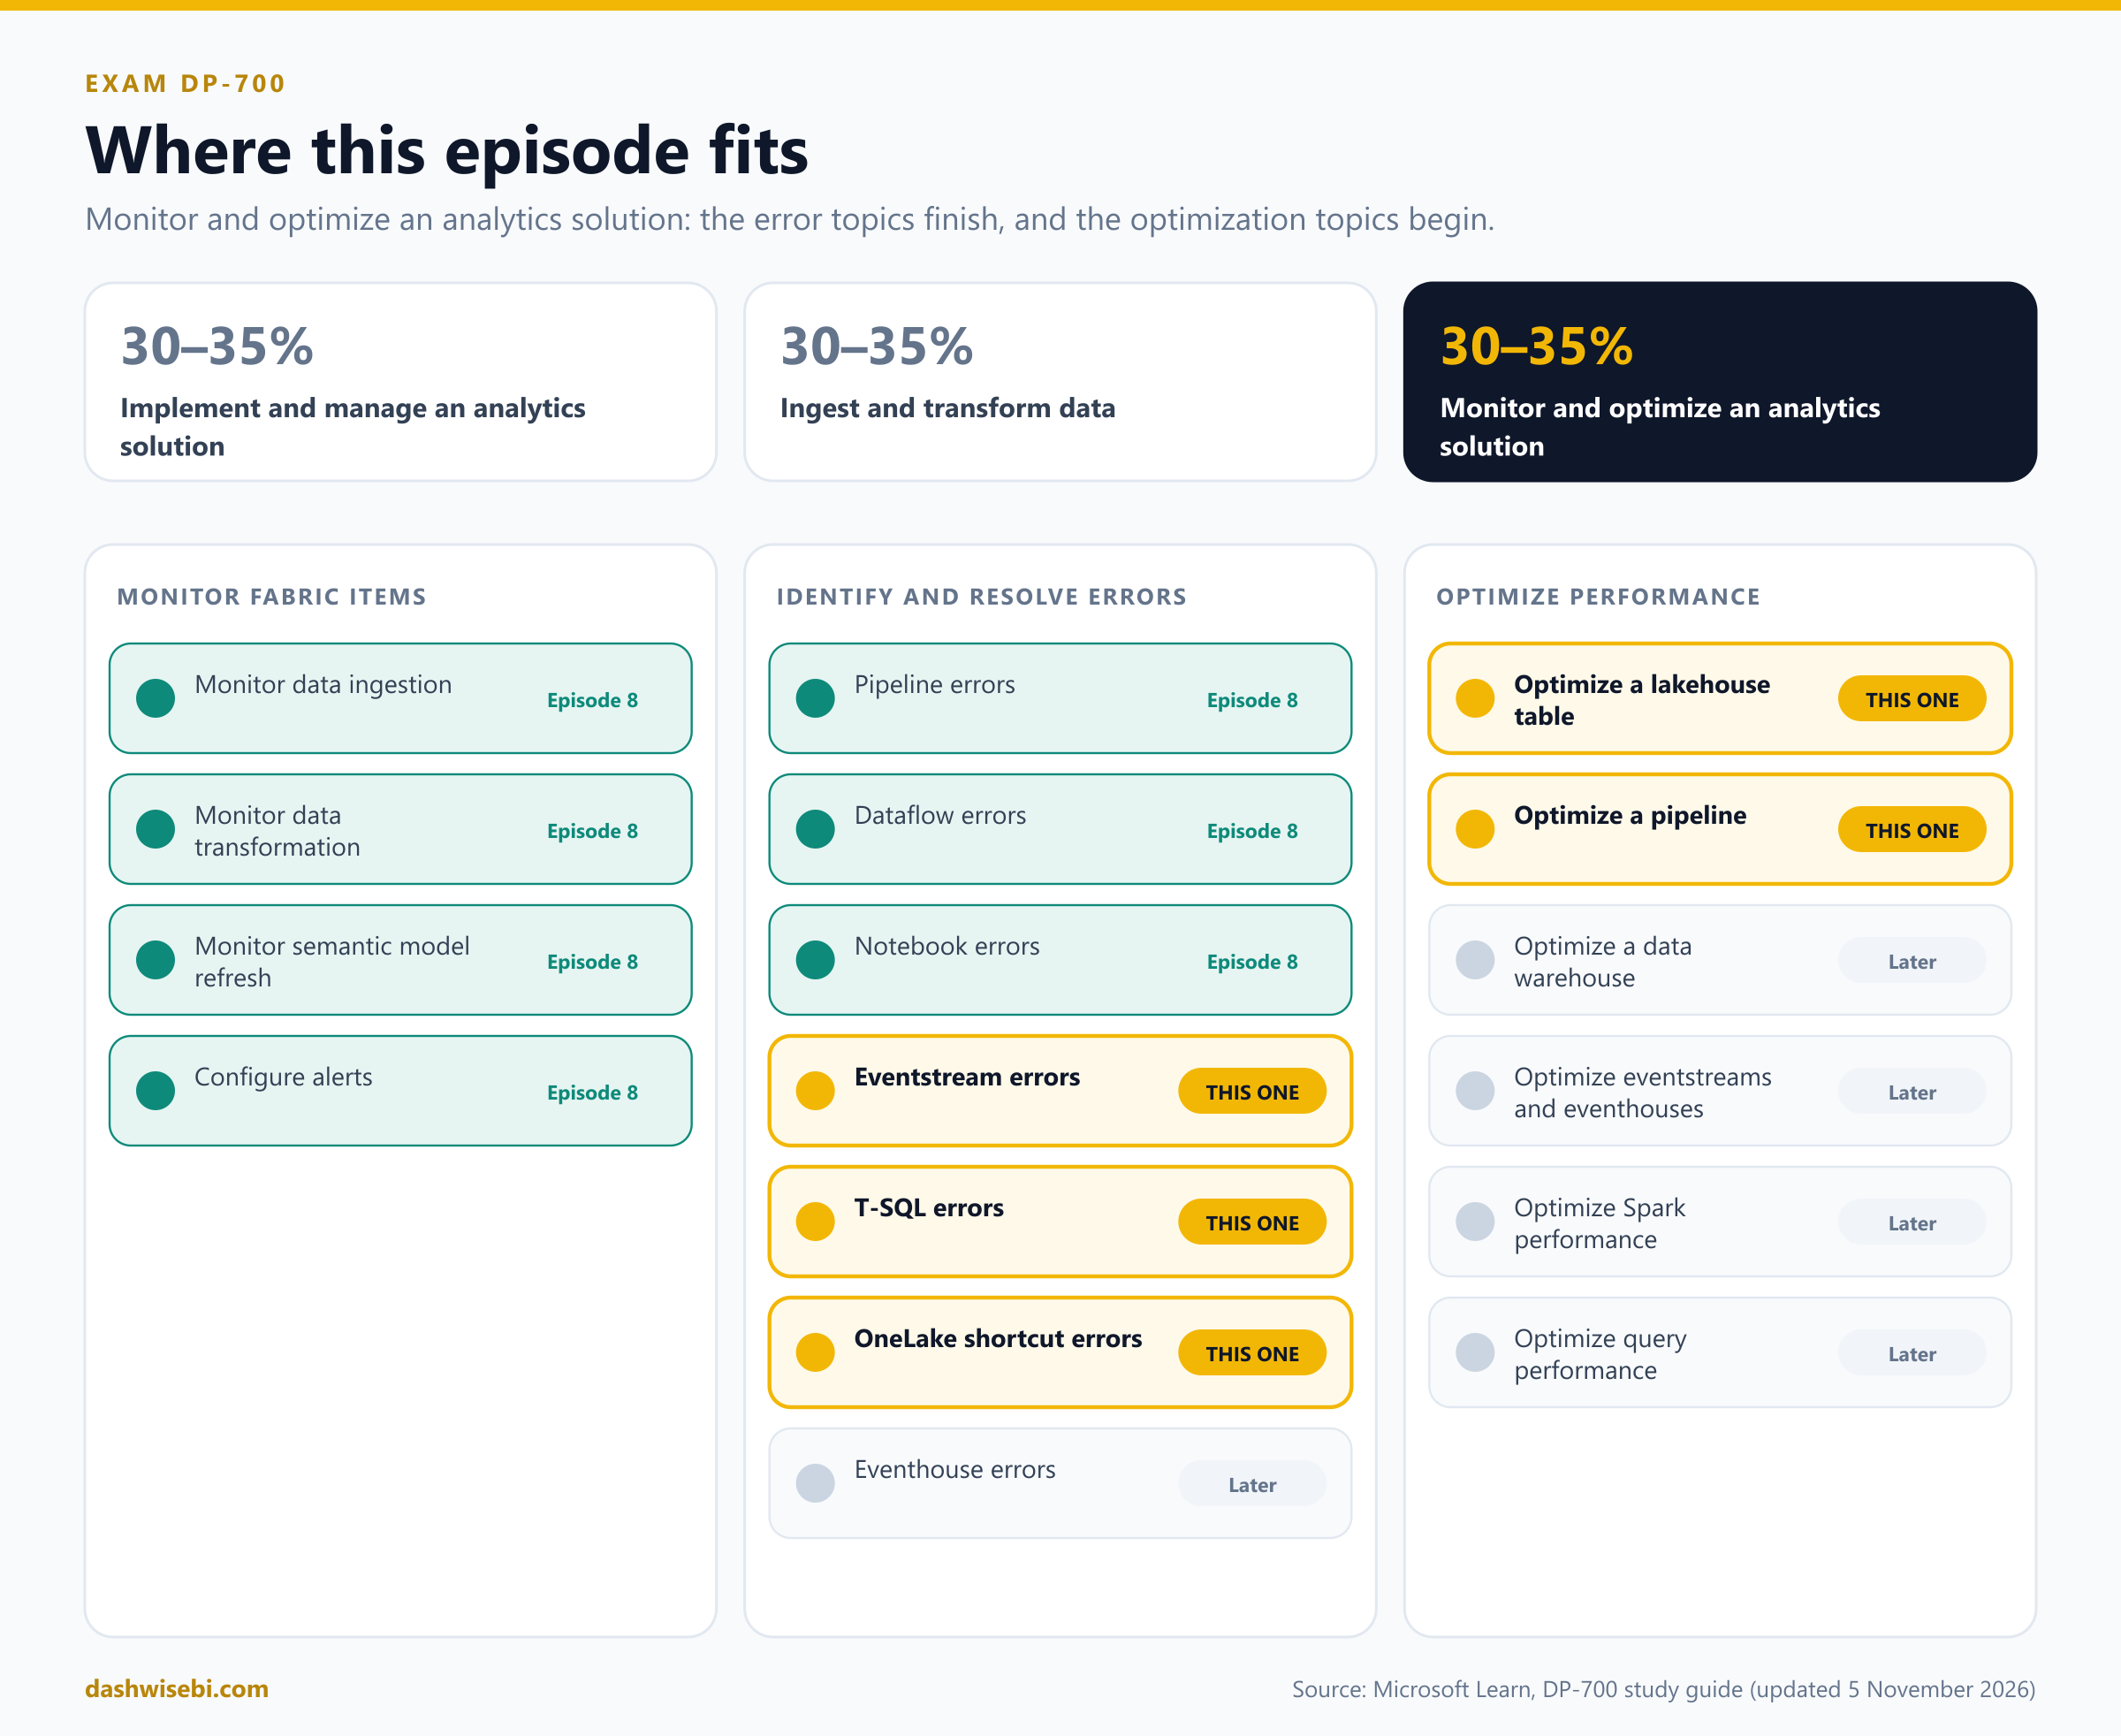
A note on wording. The study guide Microsoft updated on 5 November 2026 lists eventhouse, eventstream and T-SQL errors in the group Identify and resolve errors, and your session outline adds OneLake shortcut errors. We cover shortcuts here because they were in your outline. Eventhouse errors fit best next to the optimization of eventstreams and eventhouses, so they come in a later episode.
1. Identify and resolve Eventstream errors
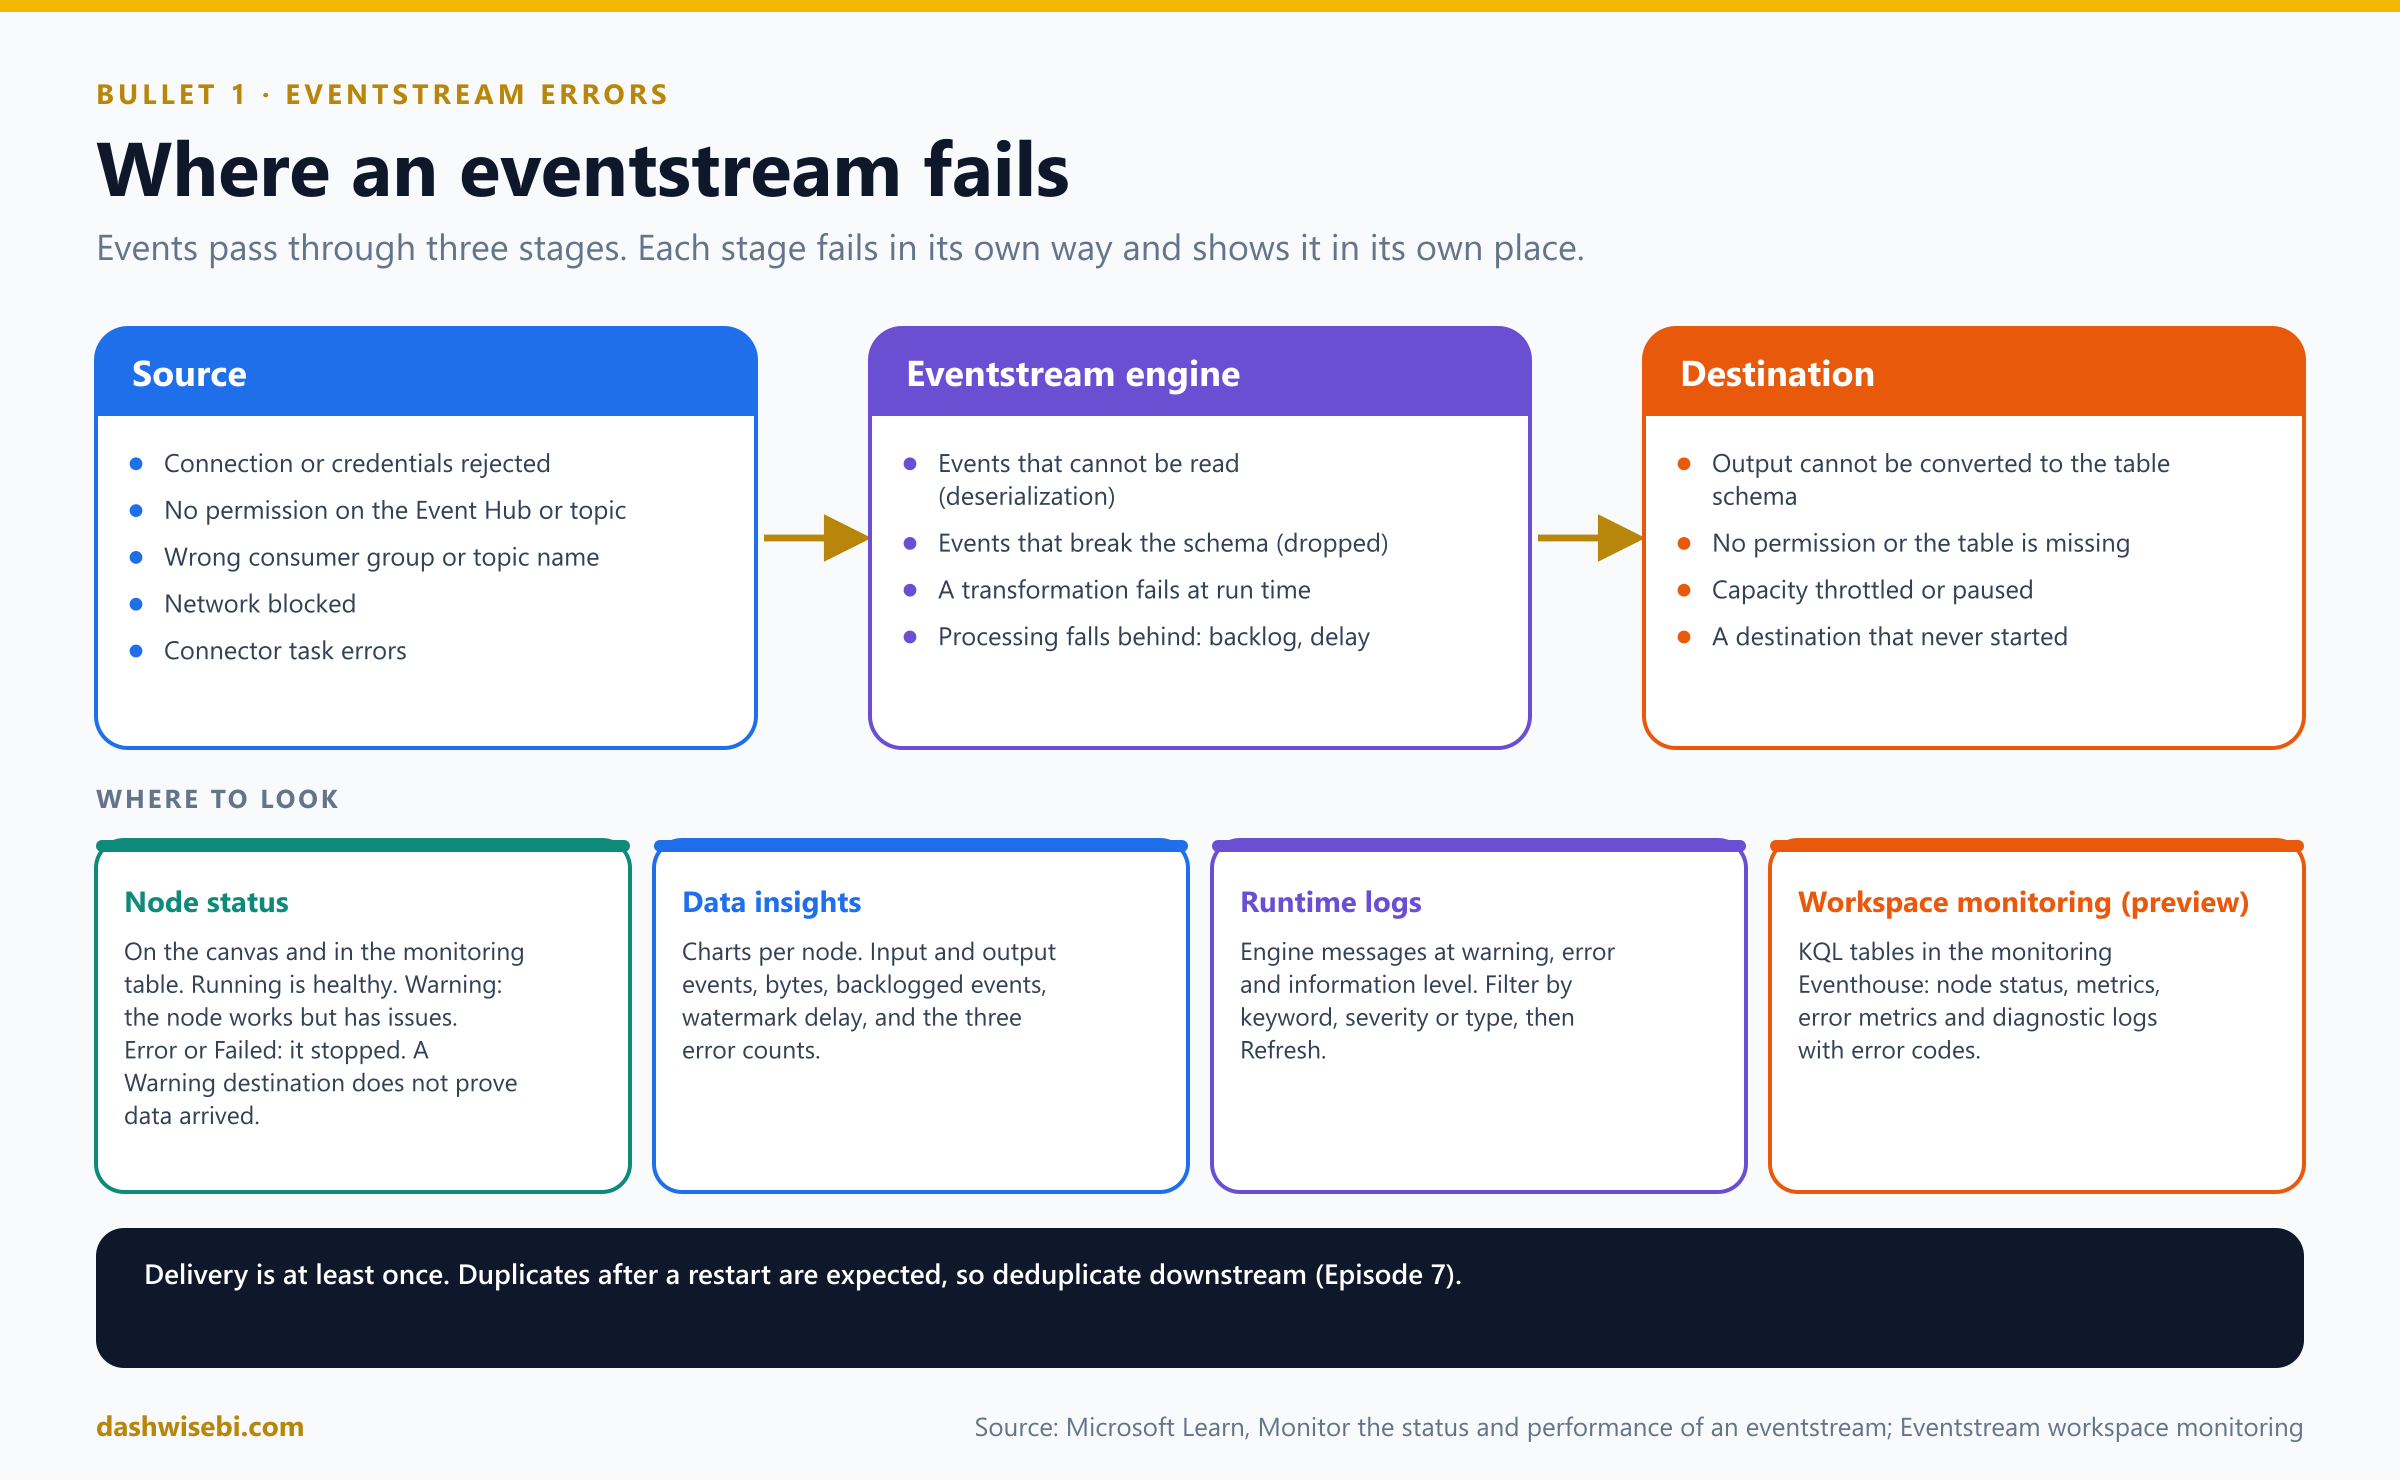
An eventstream takes events from a source, optionally transforms them, and delivers them to one or more destinations such as an Eventhouse or a lakehouse. Because the data is in motion, problems often do not look like errors. They look like missing events, late events or a node with a yellow warning. The skill is knowing which stage the problem is in.
Where to look
- Node status. Each node on the canvas has a status. Running is healthy. Warning means the node works but has issues, and traffic still flows. Error (or Failed in the monitoring tables) means the node is paused or stopped by errors. The statuses in the monitoring table are Unknown, Creating, Running, Paused, Failed, Warning and Deleting. A destination in Warning does not prove that data was ingested.
- Data insights tab. Select a node and open Data insights at the bottom of the editor. For the eventstream itself you see incoming and outgoing messages and bytes. For Event Hubs, IoT Hub, lakehouse, eventhouse, derived stream and Activator nodes you see input events, input event bytes, output events, backlogged input events, runtime errors, data conversion errors, deserialization errors and watermark delay.
- Runtime logs tab. The detailed messages of the eventstream engine, at three severity levels: warning, error and information. Filter by keyword, severity or type, and select Refresh for the latest.
- Streaming connector sources (Kafka, Kinesis, MQTT, change data capture sources, HTTP and others) have their own metrics: connector errors logged, connector processing errors, connector processing failures and connector events skipped.
- Workspace monitoring (preview) keeps the history in KQL tables, so you can query it and alert on it (see below).
What the metrics mean
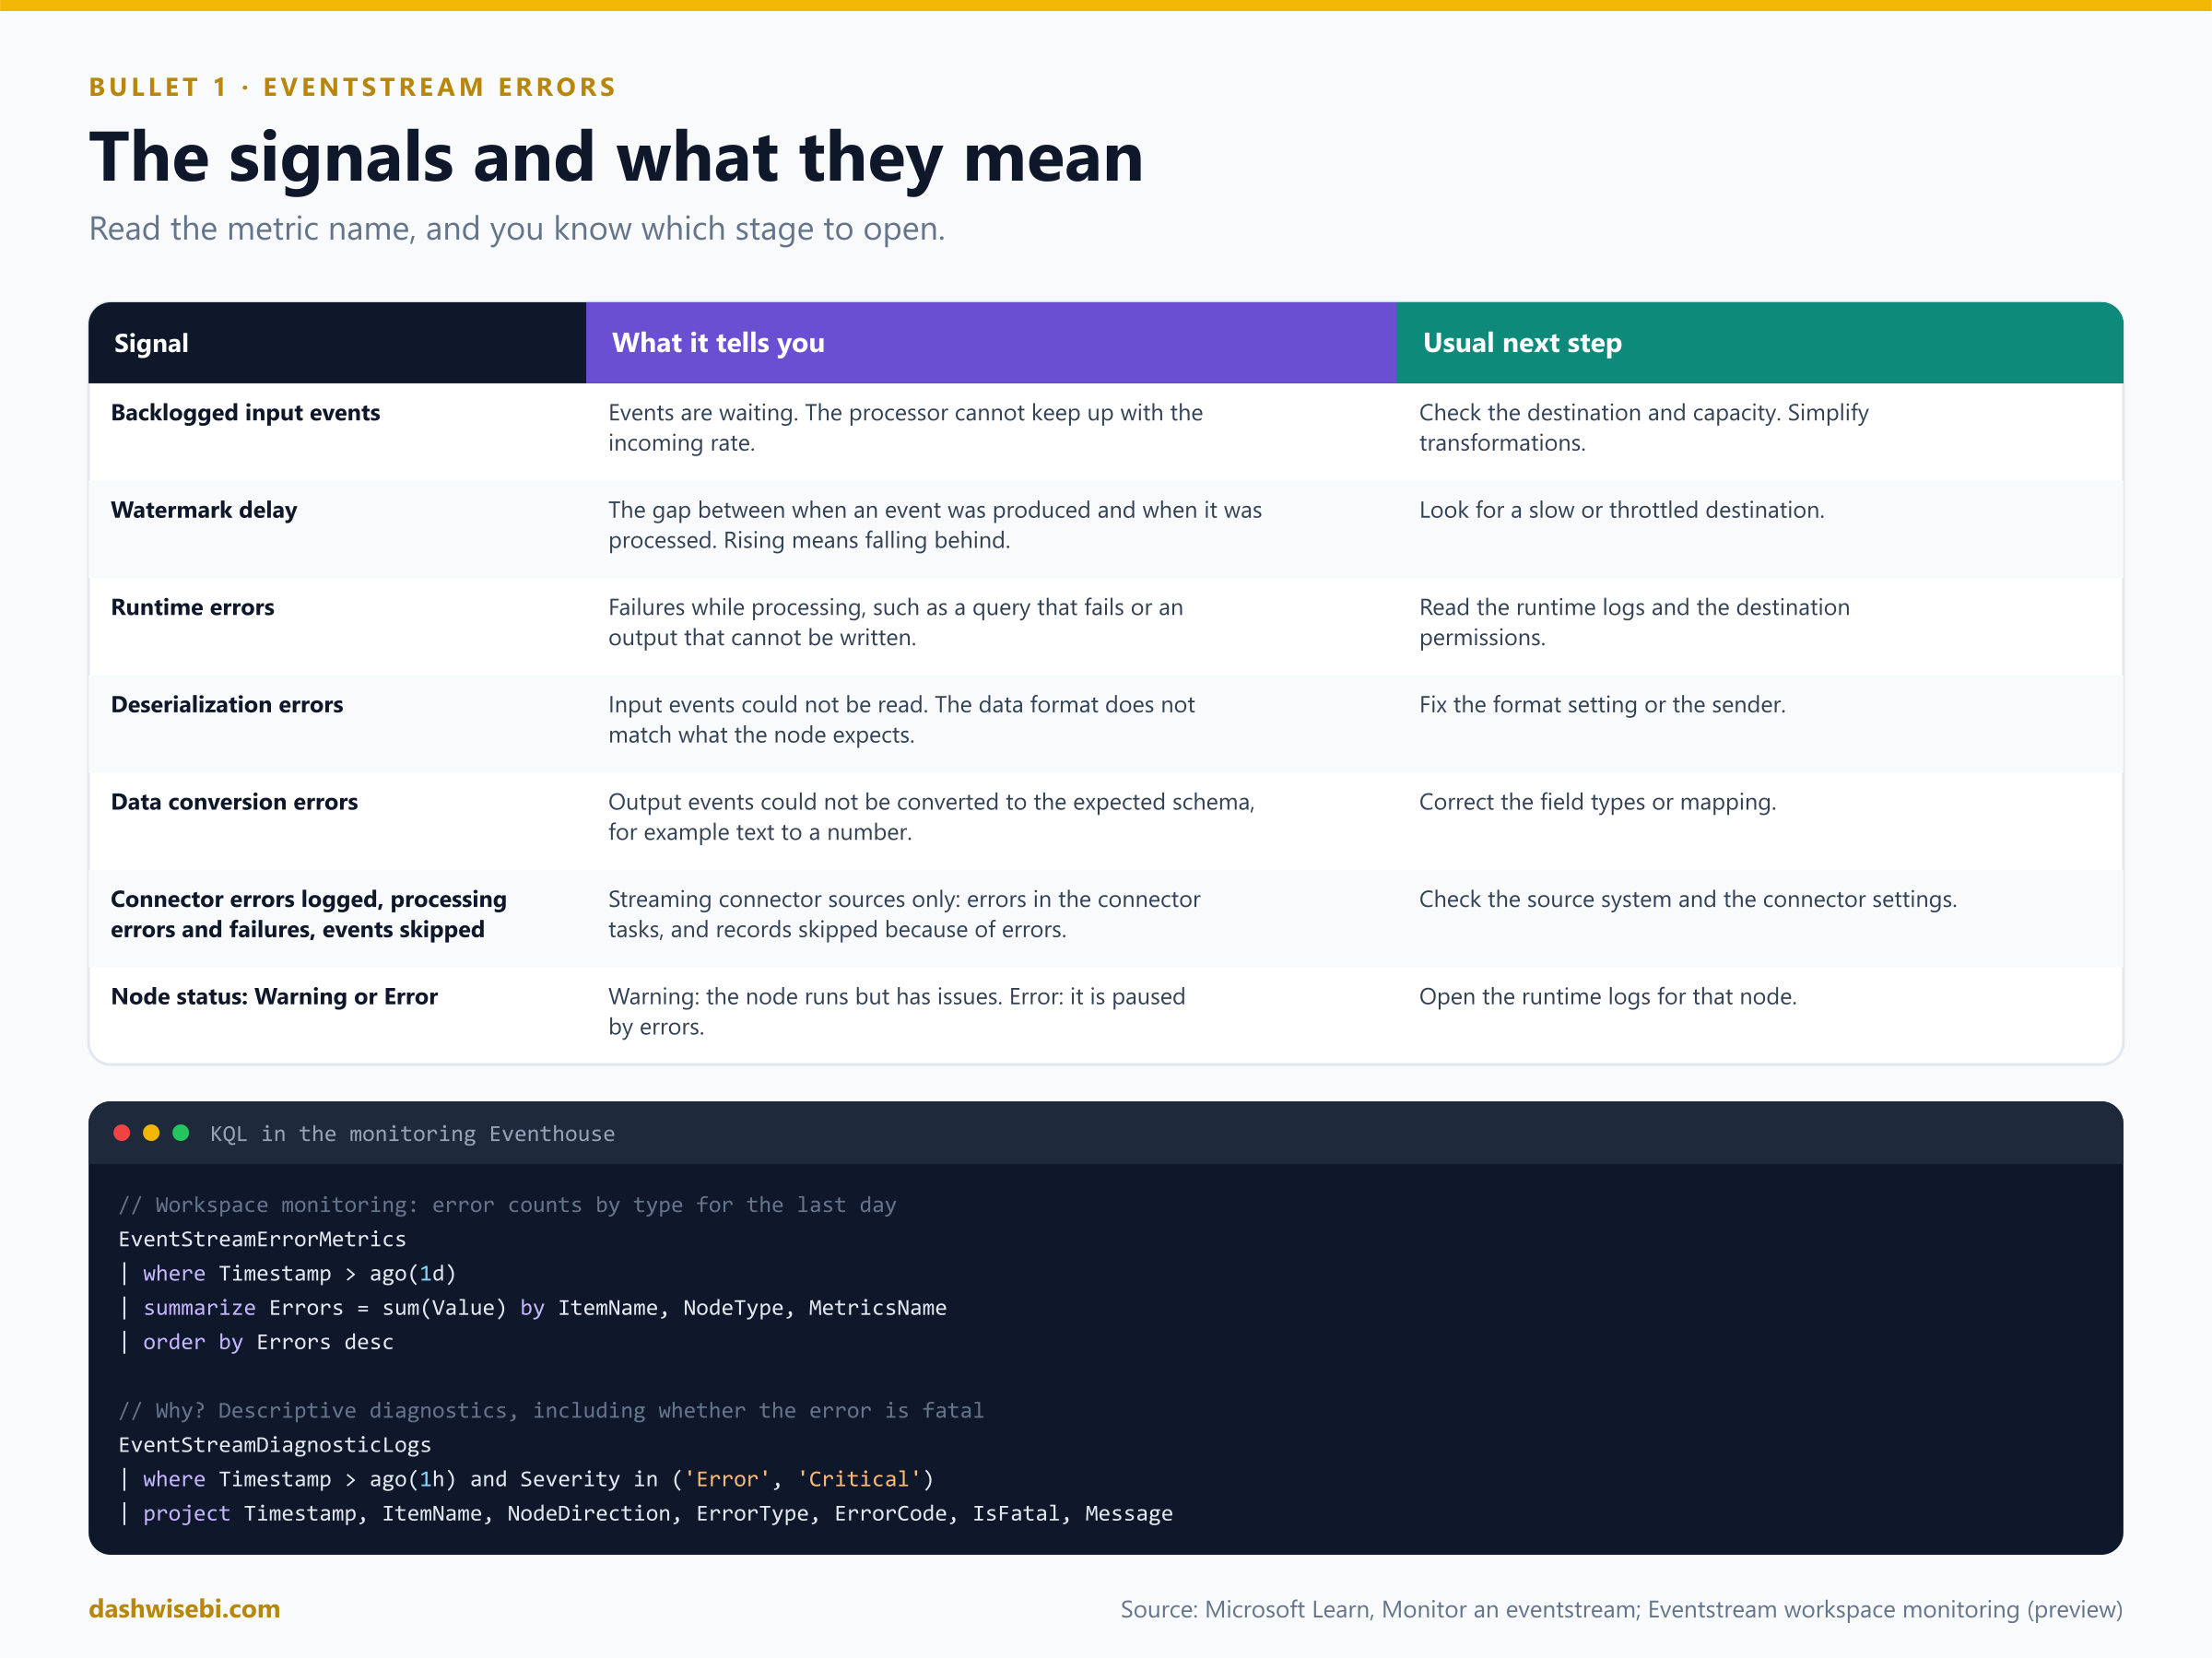
- Backlogged input events and watermark delay tell you the stream is falling behind. Watermark delay is the wall-clock time minus the largest watermark: how long ago the newest processed event was produced. A rising number means processing cannot keep up with the input.
- Deserialization errors mean events could not be read at all: the data format does not match what the node expects.
- Data conversion errors mean an output event could not be converted to the destination's expected schema, for example a text value that cannot become a number.
- Runtime errors are failures during processing, such as a query that fails or an output that cannot be written.
Workspace monitoring tables
Eventstream workspace monitoring (preview) needs a Power BI Premium or Fabric capacity, the tenant setting that lets workspace admins turn on monitoring, and the Admin role in the workspace. It is not enough to enable monitoring for the workspace: you must also turn on Log Eventstream activity for each eventstream. Four tables then appear in the monitoring database:
EventStreamNodeStatus: whether each node is running, paused or failed. Emitted about every six hours.EventStreamMetrics: message counts, bytes, watermark delay and backlog. Every minute.EventStreamErrorMetrics: error counts by type (Runtime Errors, Deserialization Errors, Data Conversion Errors). Every minute.EventStreamDiagnosticLogs: descriptive messages with a severity (Info, Warning, Error or Critical), anErrorTypesuch asDataErrororQueryRuntimeError, anErrorCode, andIsFatal, which says whether the error stops the processing job. These logs can be throttled or combined, so the number of rows does not equal the number of errors.
// How many errors of each type, per node, in the last day?
EventStreamErrorMetrics
| where Timestamp > ago(1d)
| summarize Errors = sum(Value) by ItemName, NodeType, MetricsName
| order by Errors desc

// Why? Descriptive diagnostics, including whether the error is fatal
EventStreamDiagnosticLogs
| where Timestamp > ago(1h) and Severity in ('Error', 'Critical')
| project Timestamp, ItemName, NodeDirection, ErrorType, ErrorCode, IsFatal, Message
Common problems and fixes
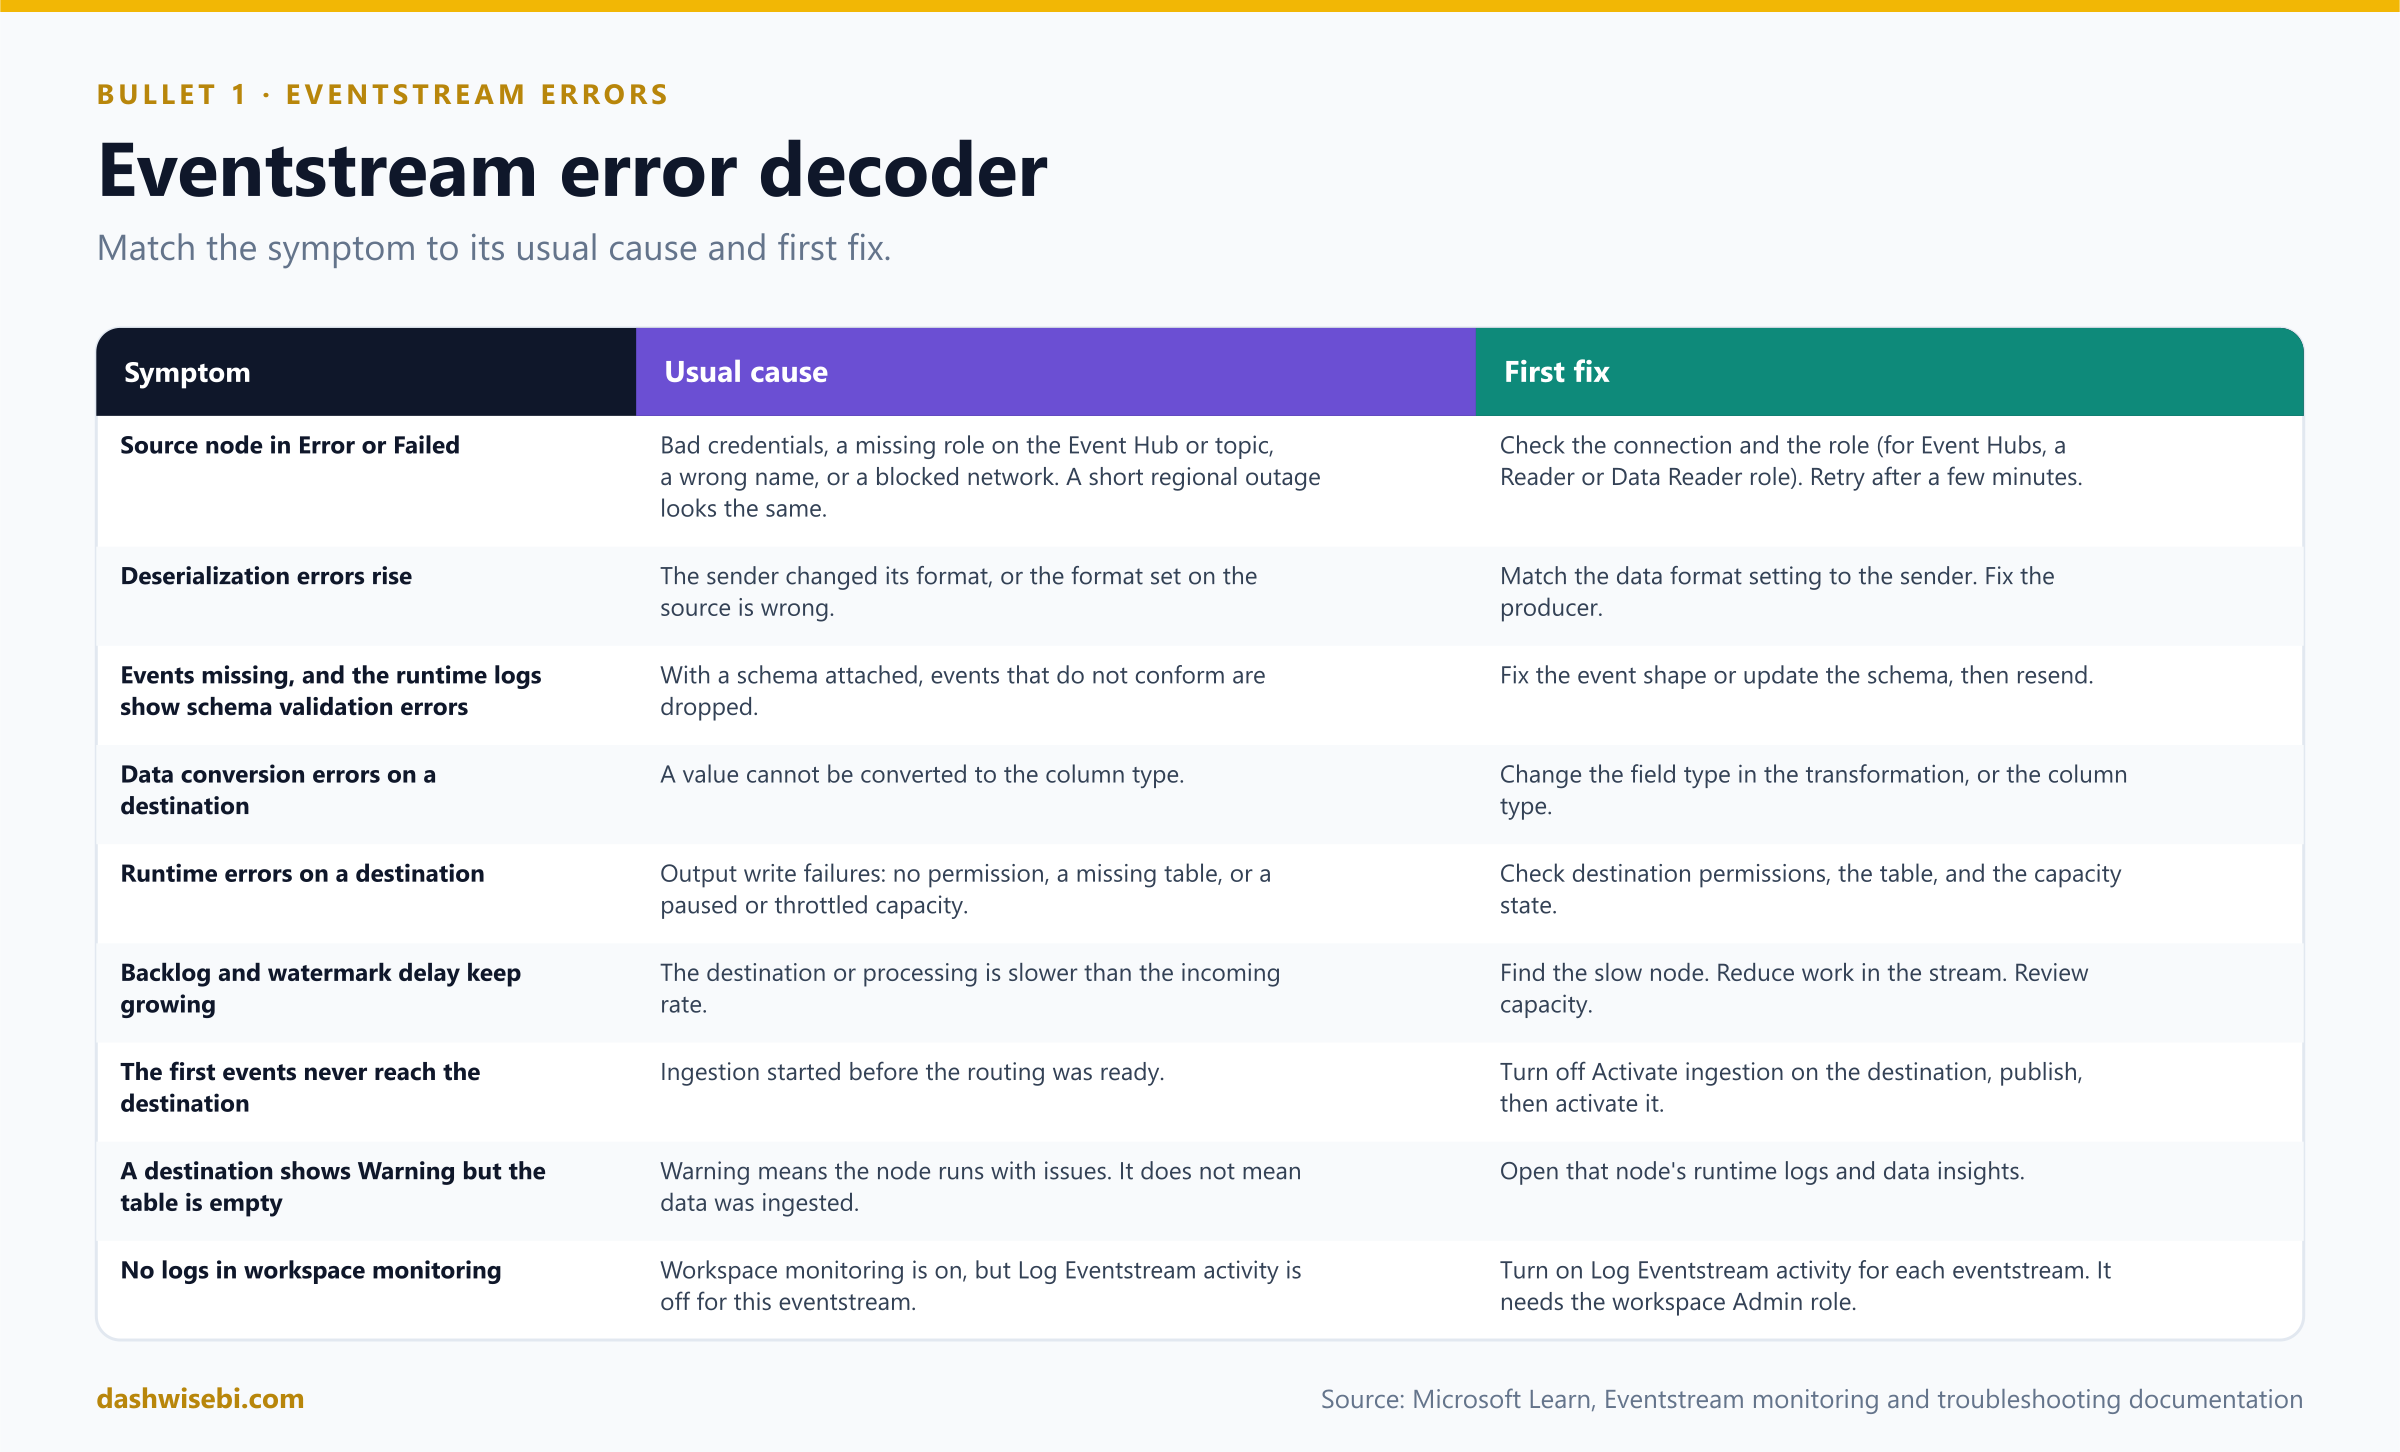
- A source node is in Error. Check the connection and credentials, the role on the source (for an Event Hub, a Reader or Data Reader role), the names, and the network. A short regional outage looks the same, so retry after a few minutes before you change anything.
- Deserialization errors. Match the data format setting on the source to what the sender really sends. If the producer changed its format, fix the producer.
- Schema validation drops. When you attach a schema, events that do not conform are dropped, and the validation errors appear in the runtime logs. Missing events plus validation messages mean the event shape and the schema disagree.
- Data conversion errors. Correct the field type in the transformation (for example with Manage fields) or the destination column type.
- Runtime errors on a destination. Typical causes are missing permissions, a table that does not exist, or a paused or throttled capacity.
- Growing backlog. Find the slow node, usually a slow or throttled destination, reduce work in the stream, and check capacity.
- The first events never arrive. Ingestion can start before routing to the destination is ready, so the earliest data may not reach it. For Eventhouse and lakehouse destinations, clear Activate ingestion when you configure the destination, publish, and then activate it.
- Activator destination. If Activator gets an exception from the eventstream, open the eventstream and check the connection and errors. Its error codes include
EventHubNotFound(the eventstream is missing),UnauthorizedAccess(lost permission) andIncorrectDataFormat(an unrecognized format). - Duplicates. Delivery is at least once. A restart can deliver an event twice, so deduplicate downstream, as in Episode 7.
2. Identify and resolve T-SQL errors
T-SQL errors in Fabric come from four places: concurrency in the Warehouse (conflicts and blocking), ingestion statements such as COPY INTO, the SQL analytics endpoint (read-only, metadata sync), and features that are not supported. Start by asking which of them you are in.
Locks, snapshot isolation and write-write conflicts
The Warehouse supports ACID transactions with BEGIN TRAN, COMMIT and ROLLBACK, and it enforces snapshot isolation on every transaction. If you change the isolation level with T-SQL, the change is ignored. Each transaction sees a consistent snapshot of the data as it was when it began, so readers and writers do not block each other. But the Warehouse uses table-level locking, even when a statement touches one row:
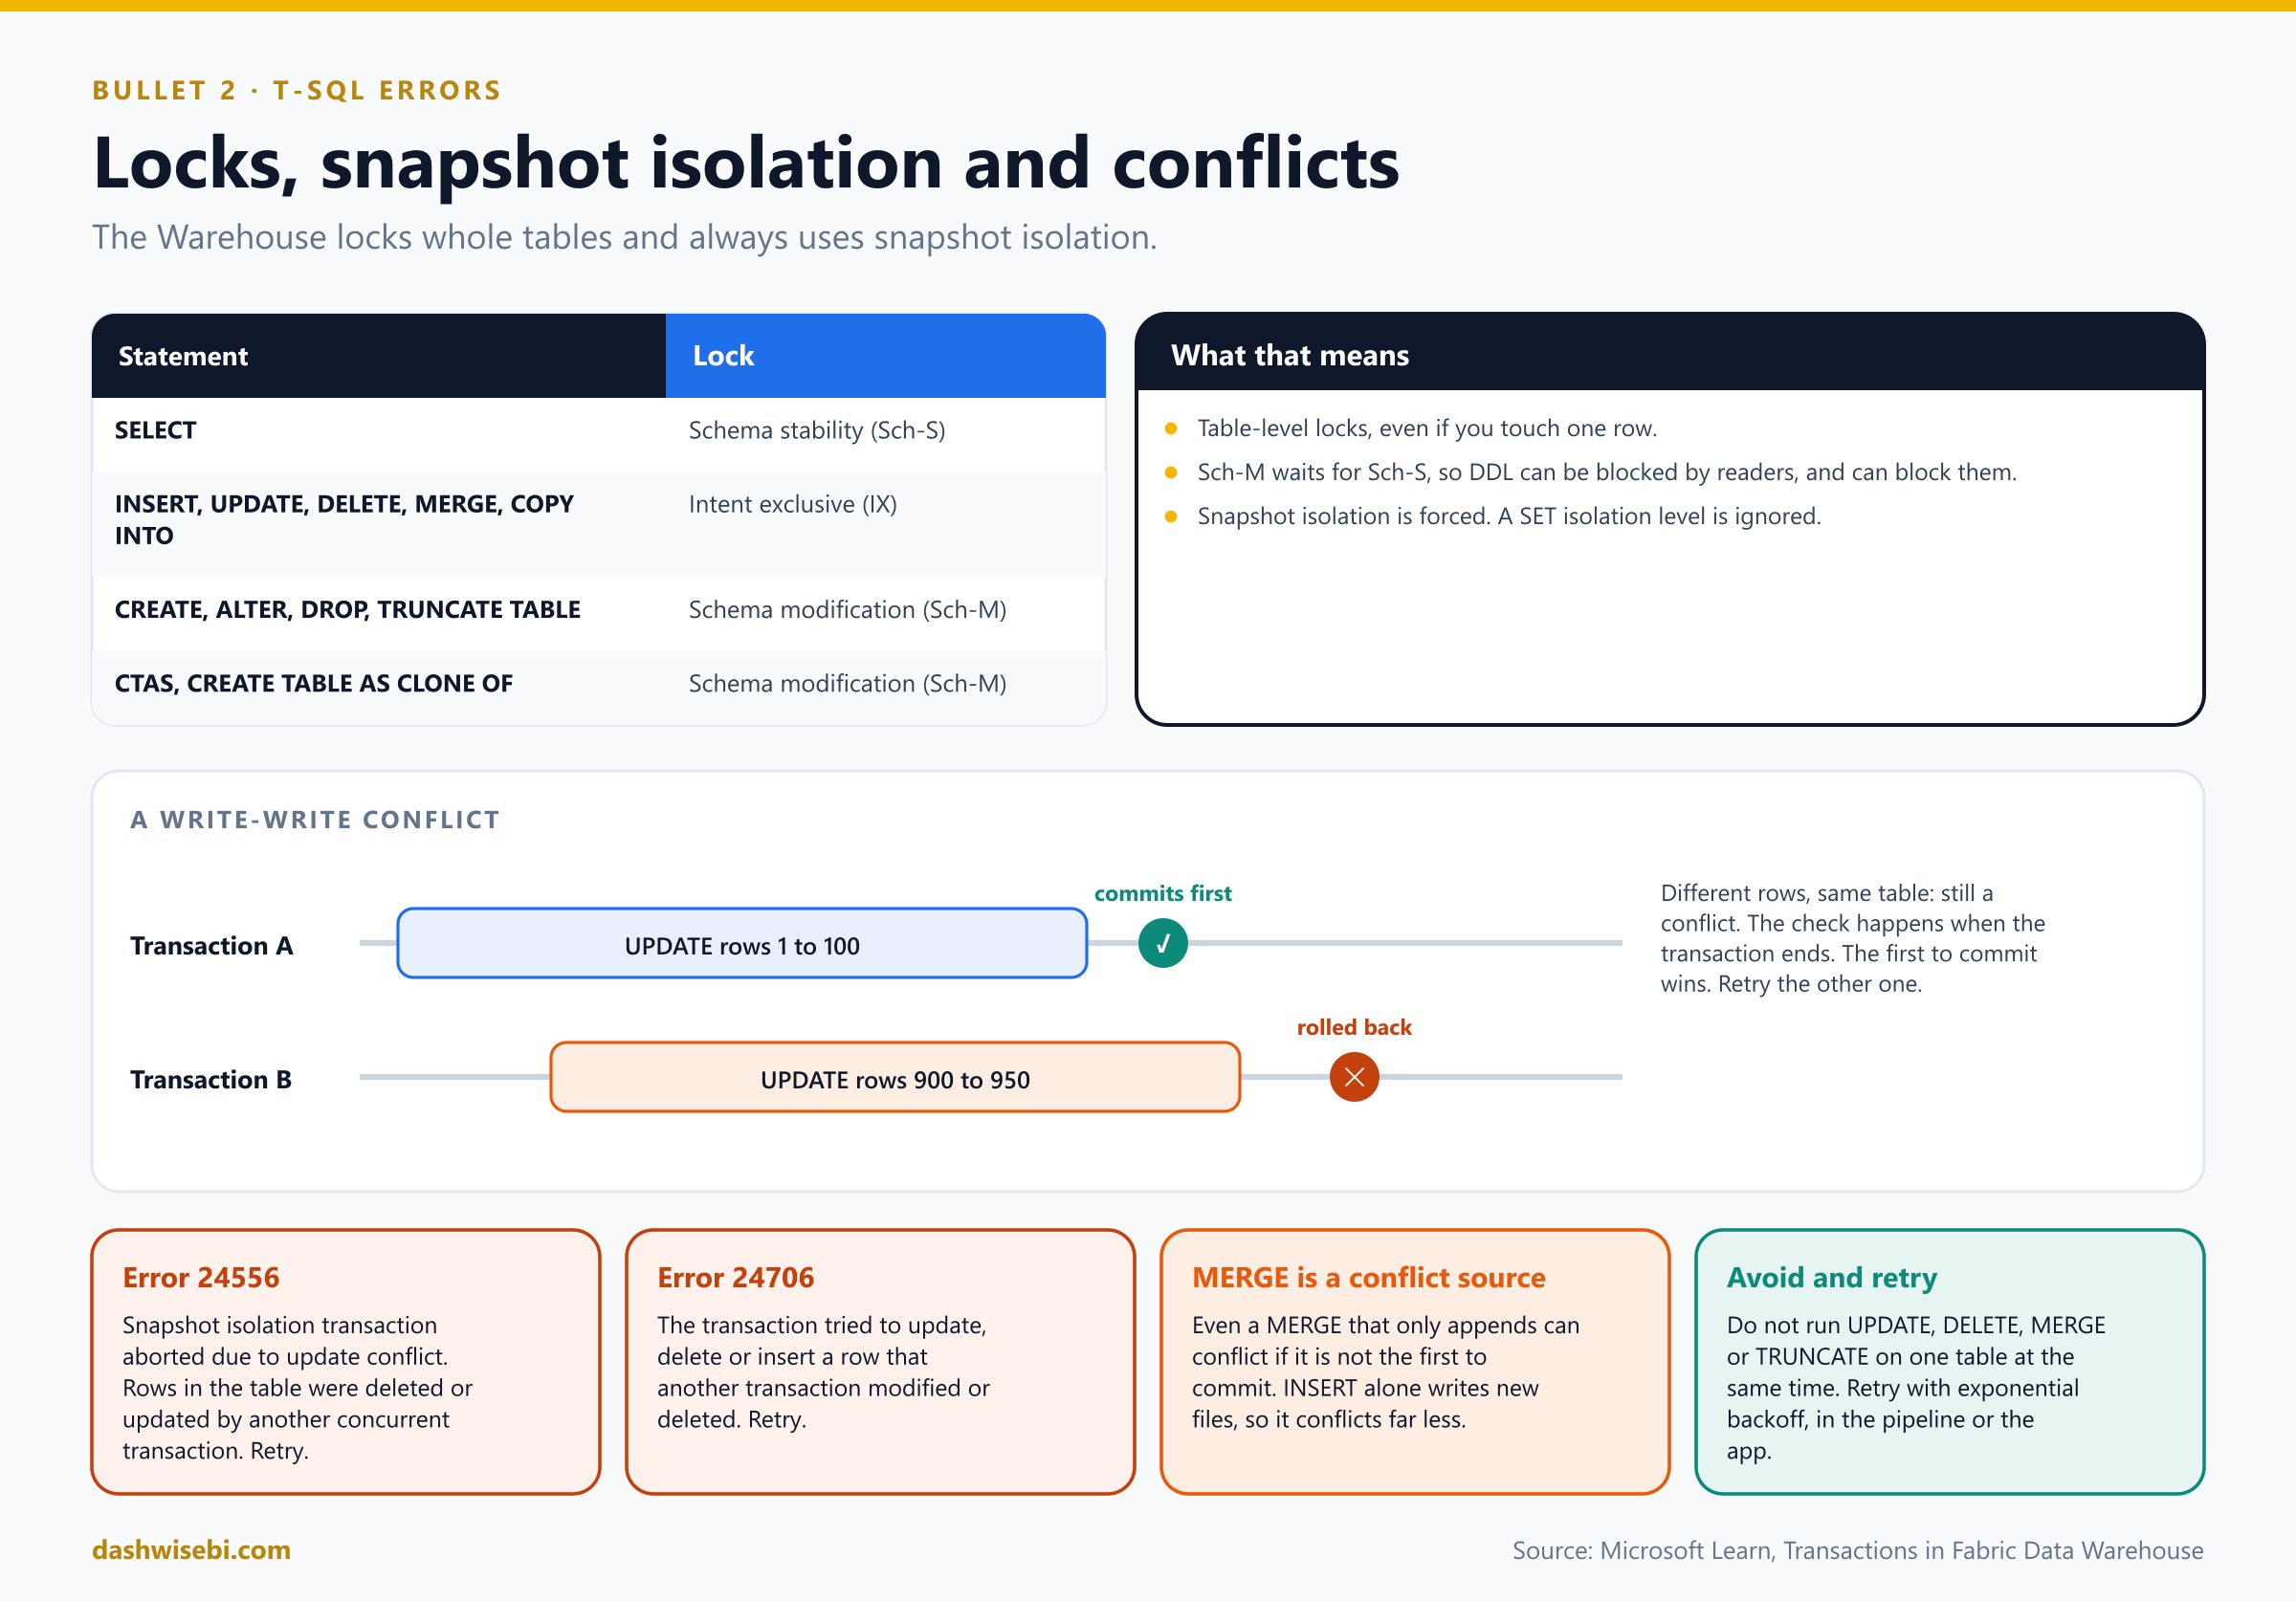
SELECTtakes a schema-stability lock (Sch-S).INSERT,UPDATE,DELETE,MERGEandCOPY INTOtake an intent-exclusive lock (IX).CREATE,ALTER,DROPandTRUNCATE TABLE,CTASandCREATE TABLE AS CLONE OFtake a schema-modification lock (Sch-M), which waits for everySch-Slock to clear and blocks everything on the table while it is held. DDL inside a transaction can also block queries on system views such assys.tables.
A write-write conflict happens when two transactions try to UPDATE, DELETE, MERGE or TRUNCATE the same table. Because locking is at table level, two transactions that change different rows of the same table can still conflict. The conflict is checked when a transaction ends: the first to commit succeeds and the others are rolled back with one of these errors:
- Error 24556: Snapshot isolation transaction aborted due to update conflict. Rows in the table were deleted or updated by another concurrent transaction. Retry the transaction.
- Error 24706: Snapshot isolation transaction aborted due to update conflict. You cannot use snapshot isolation to update, delete or insert a row that another transaction modified or deleted. Retry the transaction.
When you see one of them, at least one transaction succeeded, and the others failed. Retry the failed ones. Further points:
- A
MERGEthat only appends rows can still conflict if it is not the first to commit, even when it affects different rows from the other statements. INSERTalways writes new Parquet files, so it conflicts much less often (the exception is DDL, which changes the schema).- Conflicts can also come from background compaction, but the Warehouse's data compaction preemption normally prevents that.
- Avoid and retry. Do not run
UPDATE,DELETEorMERGEon one table from several jobs at once. Add retry logic with a delay and exponential backoff in pipelines, stored procedures and applications, so a burst of retries does not make things worse.
BEGIN TRY
    BEGIN TRAN;
    UPDATE dbo.Orders SET Status = 'Shipped'
    WHERE  OrderId IN (SELECT OrderId FROM dbo.ShipmentsToday);
    COMMIT TRAN;
END TRY
BEGIN CATCH
    IF @@TRANCOUNT > 0 ROLLBACK TRAN;
    THROW;   -- surface 24556 or 24706, so the caller (a pipeline) can retry after a delay
END CATCH;
Transaction limits
Distributed transactions (BEGIN DISTRIBUTED TRANSACTION), save points, named transactions and marked transactions are not supported. Transactions can span warehouses in the same workspace, and can read from a lakehouse SQL analytics endpoint. If you roll back a transaction after a large INSERT followed by a SELECT, automatic statistics can still reflect the uncommitted rows, so update statistics on the columns involved.
Blocked queries
A query that "hangs" is often waiting on a lock. The dynamic management views (DMVs) find the cause, and the Viewer workspace role is the minimum to query them.
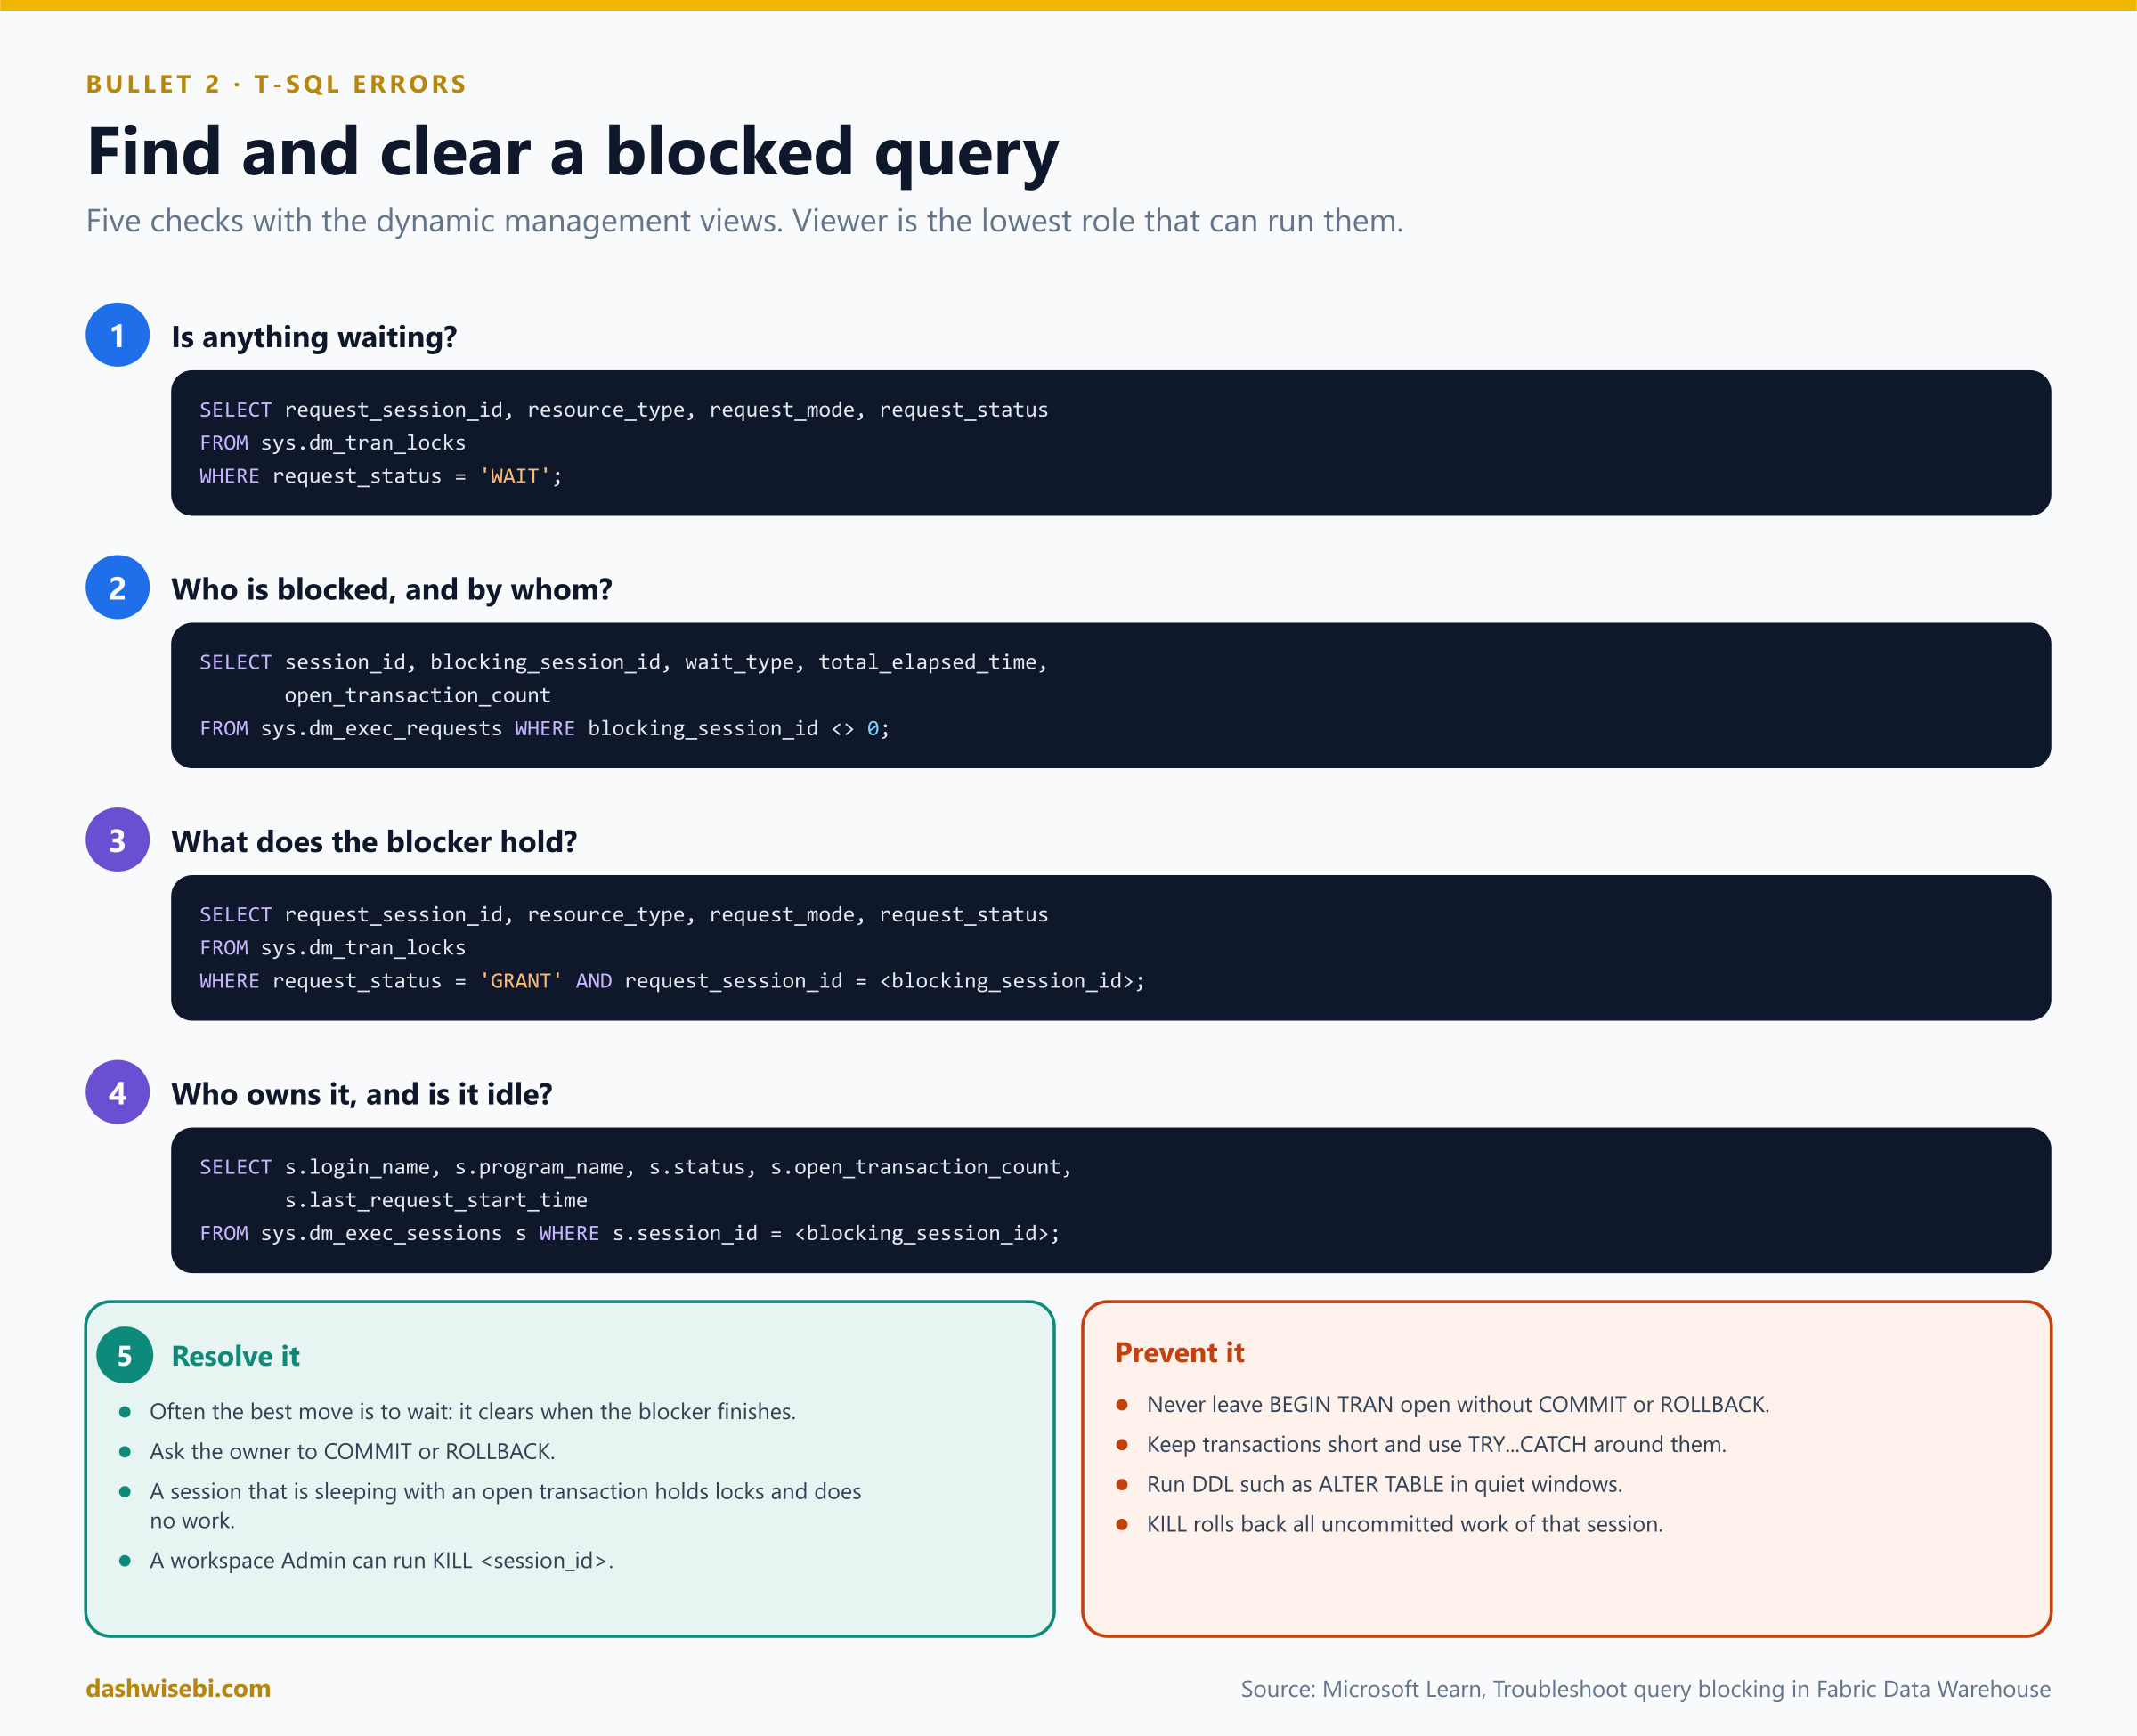
- Is anything waiting? Query
sys.dm_tran_lockswhererequest_status = 'WAIT'. - Who is blocked and by whom? Query
sys.dm_exec_requestswhereblocking_session_id <> 0. Noteopen_transaction_countandtotal_elapsed_time. - What does the blocker hold? Look at its granted locks in
sys.dm_tran_locks.Sch-MandXlocks are the usual culprits. - Who owns it, and is it idle?
sys.dm_exec_sessionsgives thelogin_name,program_name(for exampleDMS_useris the portal query editor) and status. A session that issleepingwith an open transaction holds locks and does no work. - Resolve. Often waiting is best. Otherwise ask the owner to
COMMITorROLLBACK. A workspace Admin can end it withKILL <session_id>, which rolls back all of that session's uncommitted work.
To prevent it: never leave BEGIN TRAN without a COMMIT or ROLLBACK, keep transactions short, use TRY...CATCH, and schedule DDL such as ALTER TABLE for quiet windows.
Ingestion errors with COPY INTO
Loading files with COPY INTO, BULK INSERT or OPENROWSET can fail because the values do not fit the table, required values are missing, or the options are wrong. A typical message is Msg 13812 Bulk load data conversion error (type mismatch or invalid character...), which names the row, column and file. To find out which rows are bad, let the load continue past a limited number of errors and write them to an error location:
COPY INTO dbo.TaxiTrips
FROM 'https://account.blob.core.windows.net/Files/yellow/'
WITH (
    FILE_TYPE = 'CSV',
    FIRSTROW  = 2,                 -- the header line is not data
    MAXERRORS = 10,                -- tolerate up to 10 bad rows
    ERRORFILE = 'https://account.blob.core.windows.net/Files/yellow/'
);

-- Read the diagnostics and the rejected rows
SELECT * FROM OPENROWSET(BULK 'https://account.blob.core.windows.net/Files/yellow/_rejectedrows/*/*/error.jsonl');
SELECT * FROM OPENROWSET(BULK 'https://account.blob.core.windows.net/Files/yellow/_rejectedrows/*/*/row.csv');- The load succeeds only if the number of rejected rows is lower than
MAXERRORS. - Rejected rows land under
_rejectedrows/<timestamp>/<statement_id>/.error.jsonlsays what failed, in which column and file;row.csv(orrows.jsonlfor JSONL input) keeps the original rows. ERRORFILEmust be under the same storage location you read from, and the identity needs permission to create folders and files there.- This works for CSV and JSONL loaded with T-SQL. It does not produce rejected-row files for pipelines, Parquet, or Delta Lake ingestion.
- Typical findings: the header read as data (
FIRSTROW = 2), aNULLin aNOT NULLcolumn, or a placeholder such asN/Ain a number column. - Fix the table (types, constraints) or the source files, then reload from an explicit path to the corrected file, not the original folder, so you do not load good rows twice.
SQL analytics endpoint errors
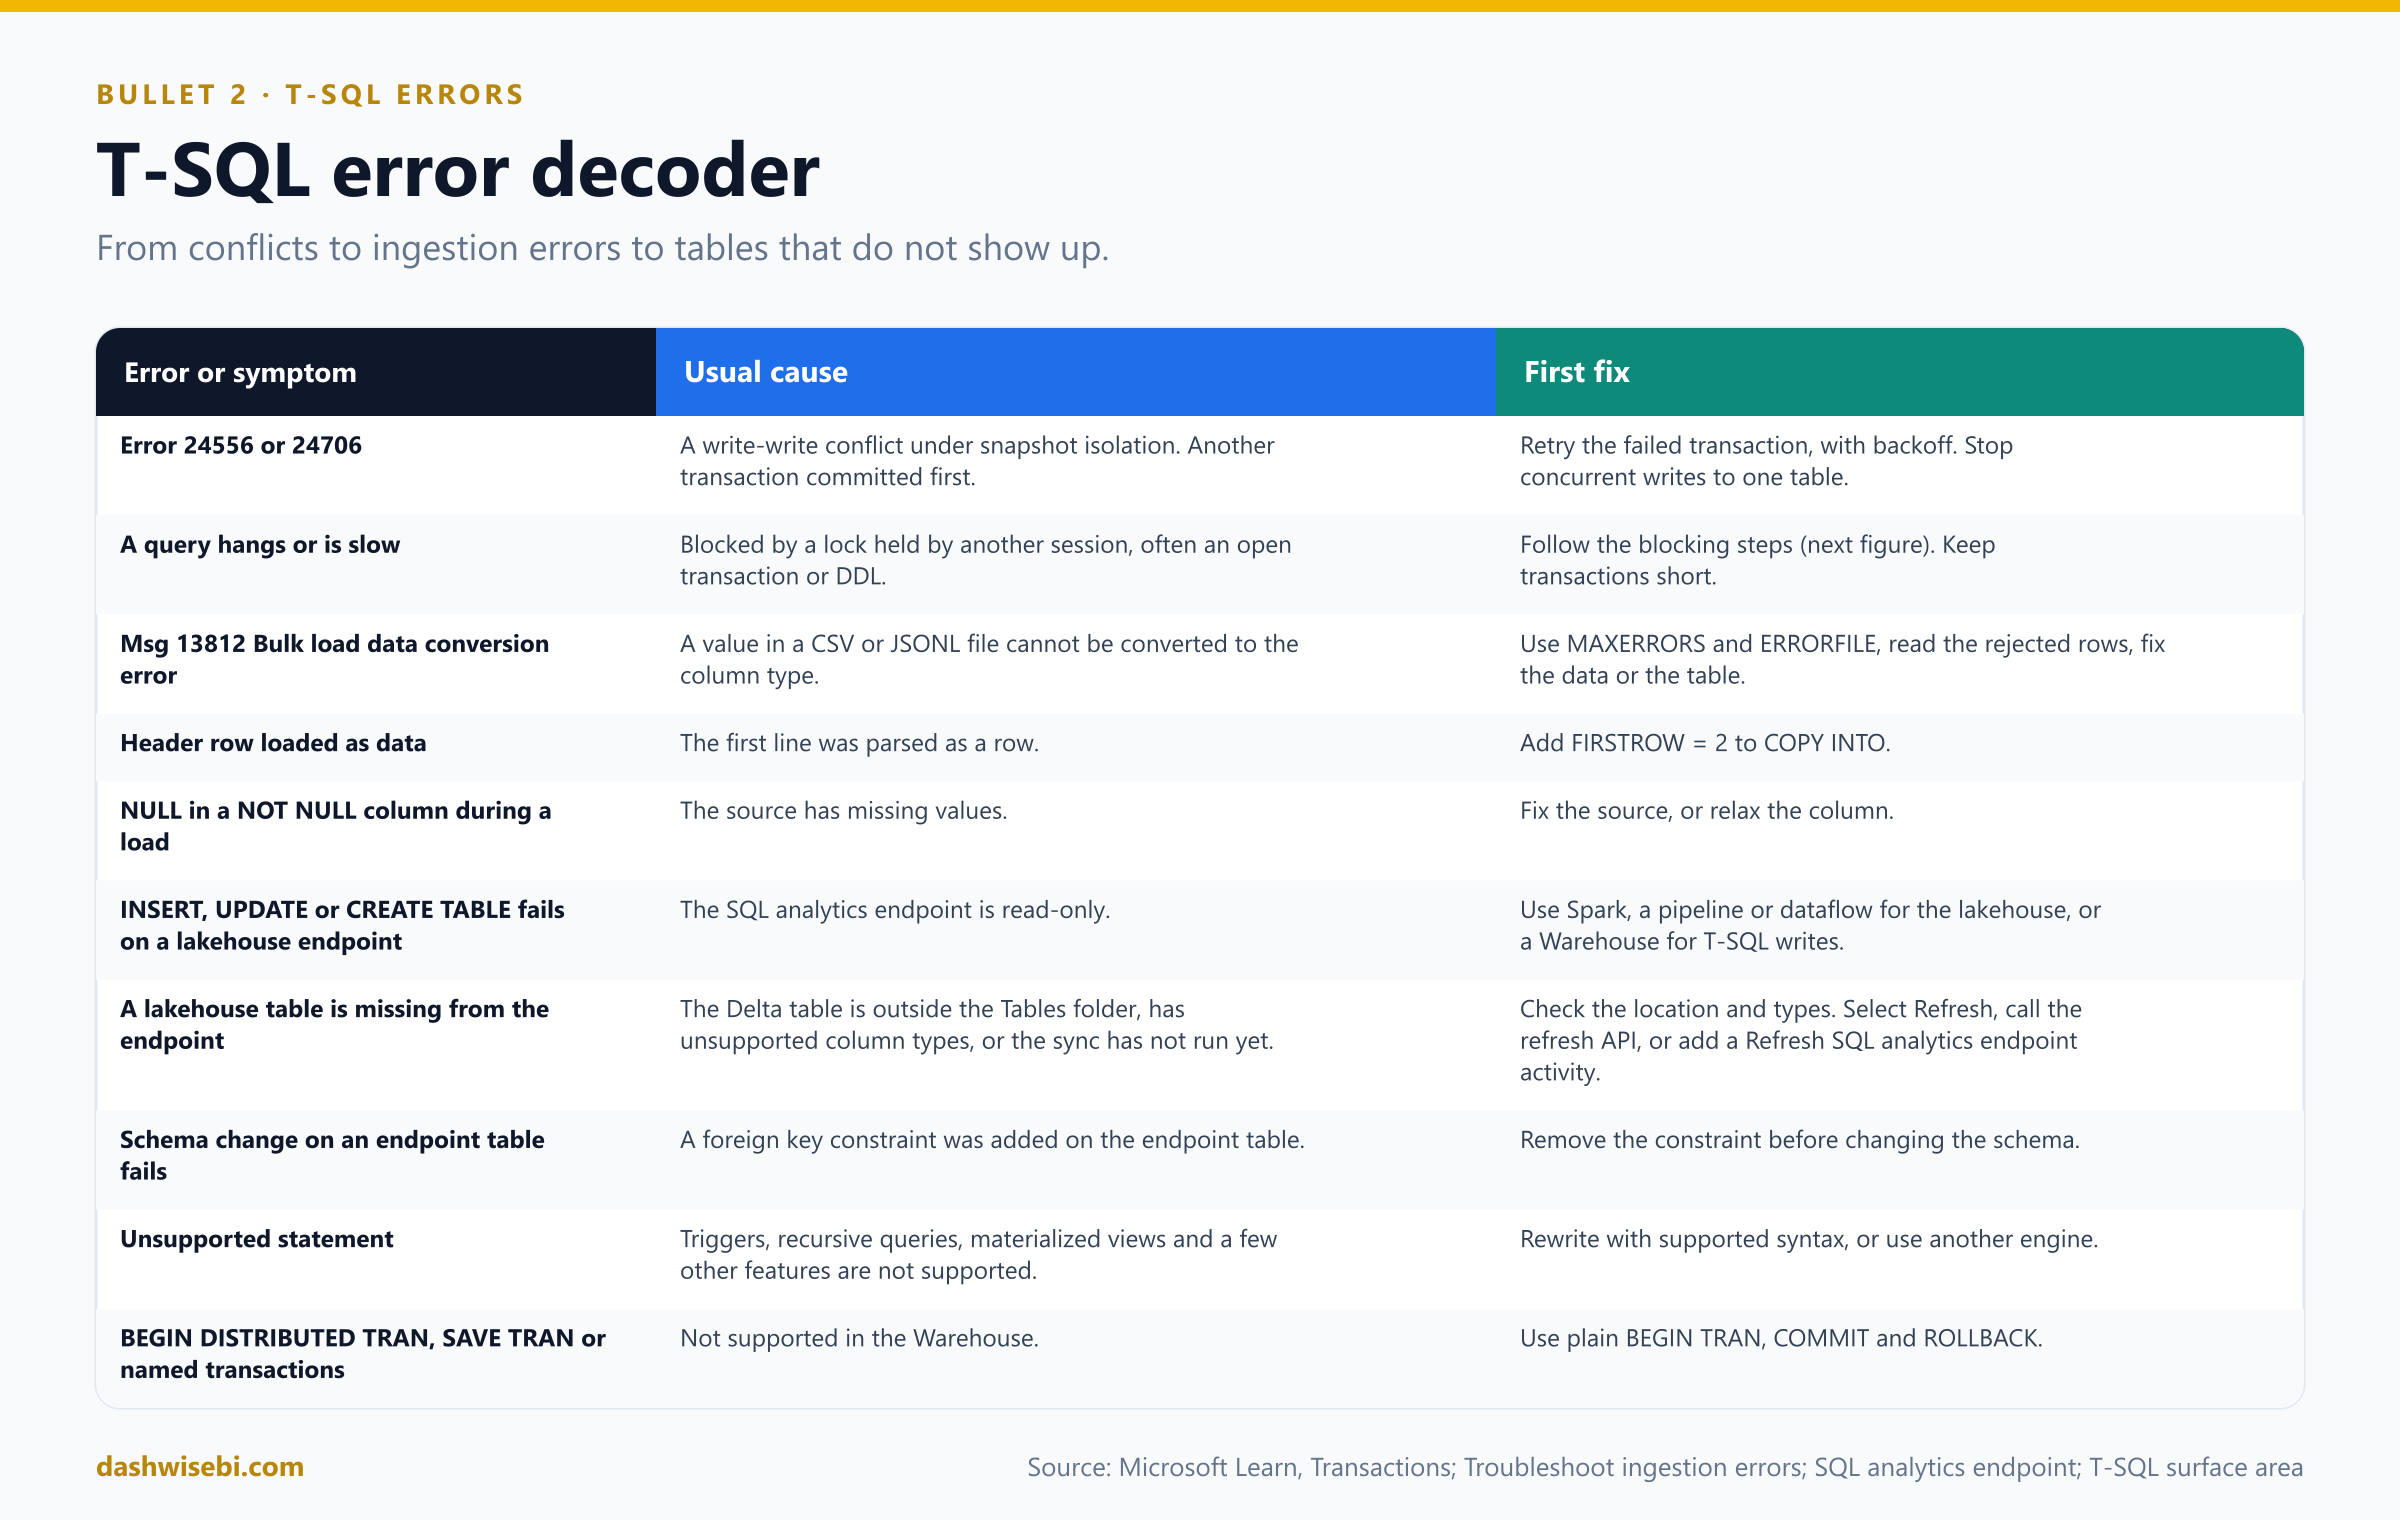
- It is read-only. You cannot insert, update, delete or create tables through the lakehouse SQL analytics endpoint. Change the data with Spark, a pipeline or a dataflow, or use a Warehouse. You can create views, functions and stored procedures on the endpoint.
- A table is missing. Only Delta tables under the lakehouse
Tablesfolder are discovered. A table that references data underFilesis not exposed. Some Spark column types have no T-SQL equivalent and may be missing. Schemas named like system schemas (sys,information_schema) or database roles do not sync. - The sync has not run. The endpoint detects new tables, new data and schema changes by reading the Delta logs, in the background. To force it, select Refresh in the endpoint's Explorer toolbar, call the Refresh SQL analytics endpoint metadata REST API, or add a Refresh SQL analytics endpoint activity to the end of a pipeline. Use the API for schema changes and whole-item refreshes. With the new metadata sync (preview), enabled in the workspace's warehouse settings, you can refresh one table with
EXEC sys.sp_dw_refresh_ext_table 'dbo.publicholidays', and checksys.dm_db_external_tables_log_status(columnslast_update_time_utc,latest_log_versionandis_blocked) to see when a table last synced. - Schema changes stop working. If you add a foreign key constraint between tables on the endpoint, you can no longer change their schema (for example, add columns).
- Delta column mapping by name is supported, by ID is not. varchar(max) columns need the new metadata sync, or the data is truncated at 8 KB.
- Limits. A workspace can hold up to 150 warehouse and SQL analytics endpoint items together.
Features that are not supported
As in Episode 7: triggers, recursive queries, materialized views, synonyms, CREATE USER and a few others. Primary key, unique and foreign key constraints must be NOT ENFORCED. If a statement is rejected, check the T-SQL surface area before you spend time debugging.
3. Identify and resolve OneLake shortcut errors
In Episode 6 you learned that a shortcut is a pointer, so most shortcut errors are about the pointer, not about data movement. The cause is almost always one of four things: you cannot create it, Fabric does not recognize it, the target changed, or the caller has no access. A fifth group appears only through the SQL analytics endpoint.
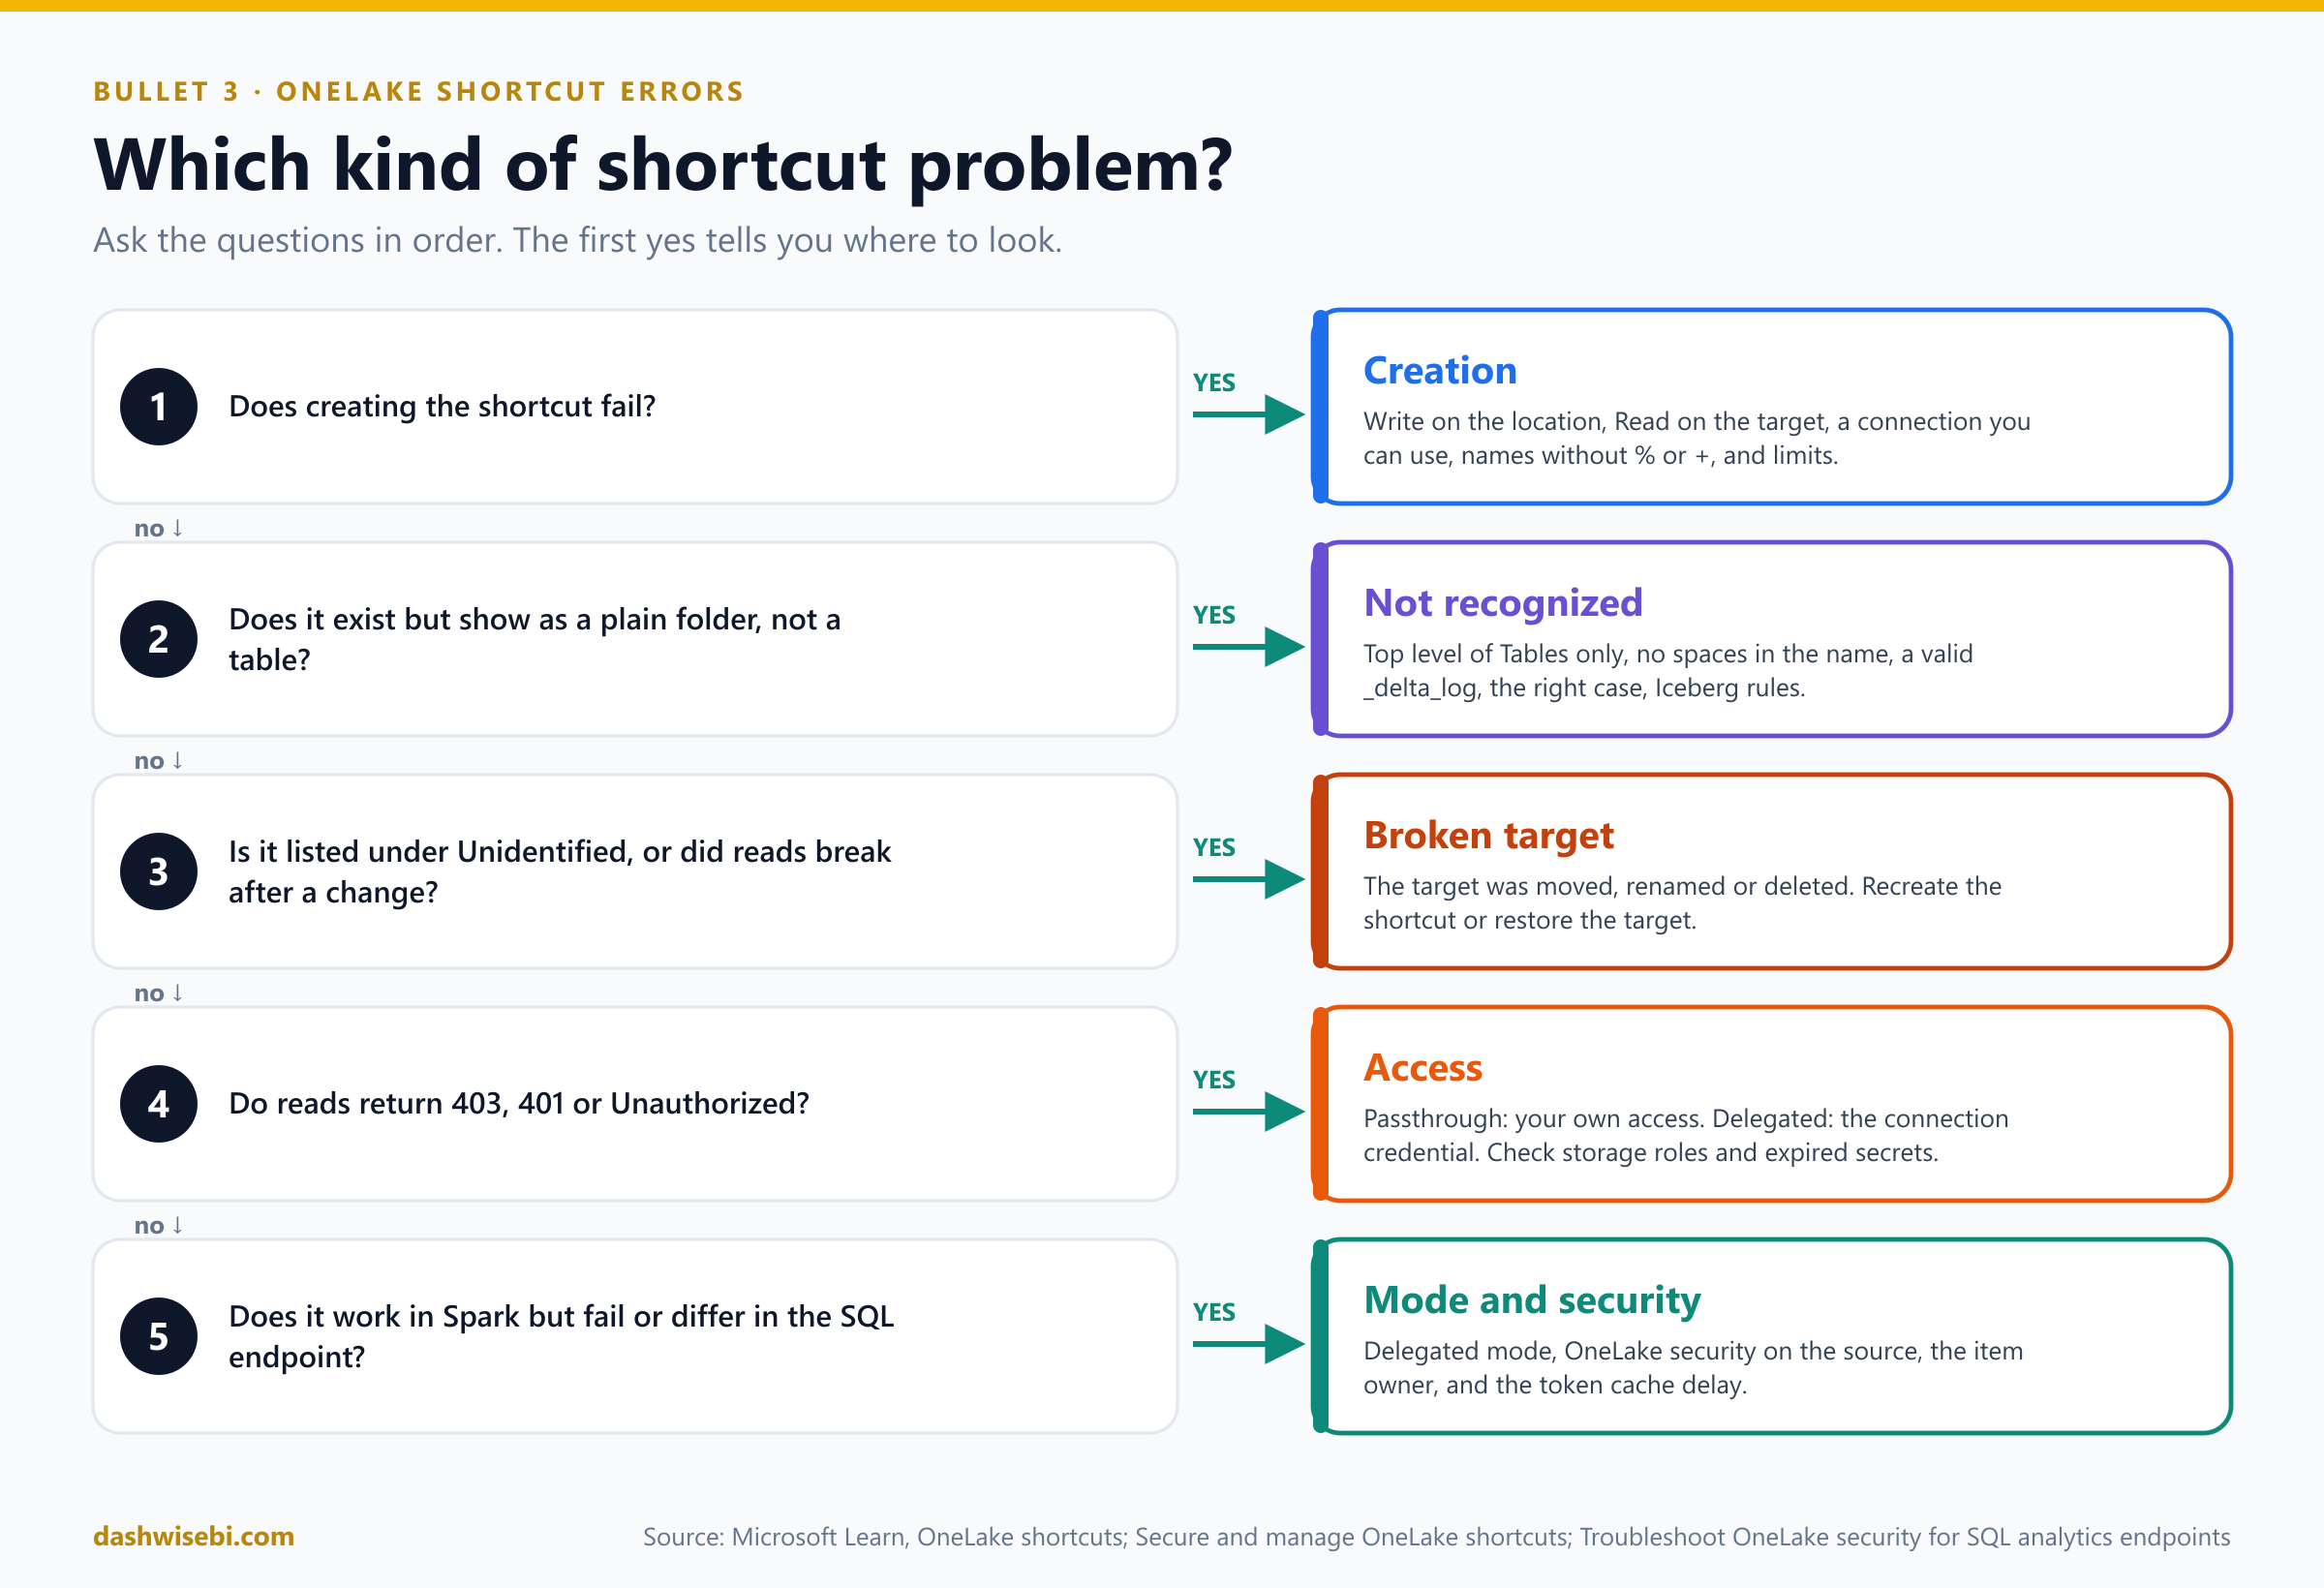
1. Creating a shortcut fails
- Permissions. You need Write permission on the item where the shortcut goes (or OneLake security ReadWrite), and Read access to the target (OneLake security Read, or ReadAll on items without it). For an external shortcut you also need permission on the connection: only people with permission on a connection can bind it to a shortcut.
- Names. Shortcut names, parent paths and target paths cannot contain
%or+, and non-Latin characters are not supported. - Limits. 10 shortcuts on one OneLake path, at most 5 shortcut-to-shortcut hops, 100 unique connections and 100,000 shortcuts per item. The portal creates up to 50 shortcuts at once.
- Schema shortcuts. You can create a schema shortcut only in a schema-enabled lakehouse.
2. The shortcut exists but is not a table
A shortcut in Tables becomes a table only if Fabric recognizes the target as a Delta (or Iceberg) table. Check:
- It is at the top level of
Tables. Shortcuts in subfolders of Tables are not supported. - Its name has no space. Delta does not allow spaces in table names.
- The target has a valid
_delta_logfolder. A missing, empty or damaged log means no table. If Delta files exist but are not registered, re-create the table reference. - The table name has the right case: Delta table names are case-sensitive.
- For Iceberg: the shortcut sits directly under
Tablesin a lakehouse without schemas, and its target path is the Iceberg table folder itself. - It may be in the right place but still show only under
Files. Use aFilesshortcut and read it by path, or move the shortcut toTablesonce the target is a valid table.
3. The target changed: Unidentified
If you move, rename or delete the target path, the shortcut can break, and it shows under the Unidentified section of the Lakehouse explorer until the target is fixed. Restore the target or re-create the shortcut. Deleting the shortcut never touches the target, but deleting a file inside a shortcut can delete it in the target (Episode 6).
4. Access errors: 403, 401, Unauthorized
Typical messages are 403 Forbidden, Access Denied, Authentication Failed, Unauthorized to access table files and User is not authorized. User requires at least ReadAll permission on the artifact. Work out which authentication model the shortcut uses.
- Passthrough (same-tenant OneLake): your own identity is used at the target, and the most restrictive of the two locations wins. Grant access at the target, or ask for item permissions: ReadData for SQL, ReadAll for Spark. They are different permissions.
- Delegated (all external shortcuts, cross-tenant, or by choice): the connection's credential is used. If it expired, was changed, or its creator left the organization, every shortcut on it fails. Open the lakehouse Settings, Shortcut connections. The Action required section lists broken connections, and Replace swaps in a new or existing connection for all shortcuts that use it.
- Storage roles. For ADLS targets the identity needs Storage Blob Data Reader (or Contributor to write). A service principal's secret may have expired.
- Stale tokens. Long-running operations can hit expired tokens. Rerun.
# Can Spark see the shortcut folder at all?
display(mssparkutils.fs.ls("Files/s3_sales"))

# Is the target a valid Delta table? A readable _delta_log means yes.
display(mssparkutils.fs.ls("Tables/dim_customer/_delta_log"))

# Read it. A 403 here is an access problem, not a path problem.
spark.read.format("delta").load("Tables/dim_customer").limit(5).show()
5. Different results in Spark and the SQL endpoint
The SQL analytics endpoint has two modes, and shortcuts behave differently in each.
- User identity mode passes the caller's identity to OneLake, and OneLake security rules apply. A user in a OneLake security role must have Fabric Read on the consumer lakehouse with the same object ID: nested group membership is not resolved, and mail-enabled security groups are not supported.
- Delegated identity mode uses the item owner's identity and does not honor OneLake security roles. That is why Spark (which enforces them) and SQL (which does not) can return different rows. If the shortcut's source table has row, column or object security defined in OneLake security, the shortcut is blocked in delegated mode, by design. Either switch to user identity mode, or remove the OneLake rules and re-create the filtering in SQL (RLS, CLS, masking).
- The owner matters. In delegated mode the item owner needs Read on both the source and the consumer, and the owner cannot be a service principal. Reassign ownership to a user or group.
- Changes can take time. OneLake security role changes reach the endpoint within about 5 minutes (the Metadata sync button or a page refresh speeds it up). In delegated mode the owner's storage token is cached, so a revoked permission at the producer can keep working for 30 to 60 minutes. Pausing and resuming the capacity, or switching modes, forces a refresh, but both drop existing SQL connections, and switching modes deletes SQL roles and inline objects such as functions, so script them first.
- A shortcut target is renamed. The database briefly enters single-user mode while it validates the new target. Queries can be blocked, or canceled, for up to 5 minutes. Avoid changing targets at peak times.
- Warehouse SQL security is not carried through. RLS, CLS and masking defined in a warehouse apply only in its SQL context. Reading the same data through a OneLake shortcut can show everything. Apply OneLake security at the source, or restrict who can use the shortcut.
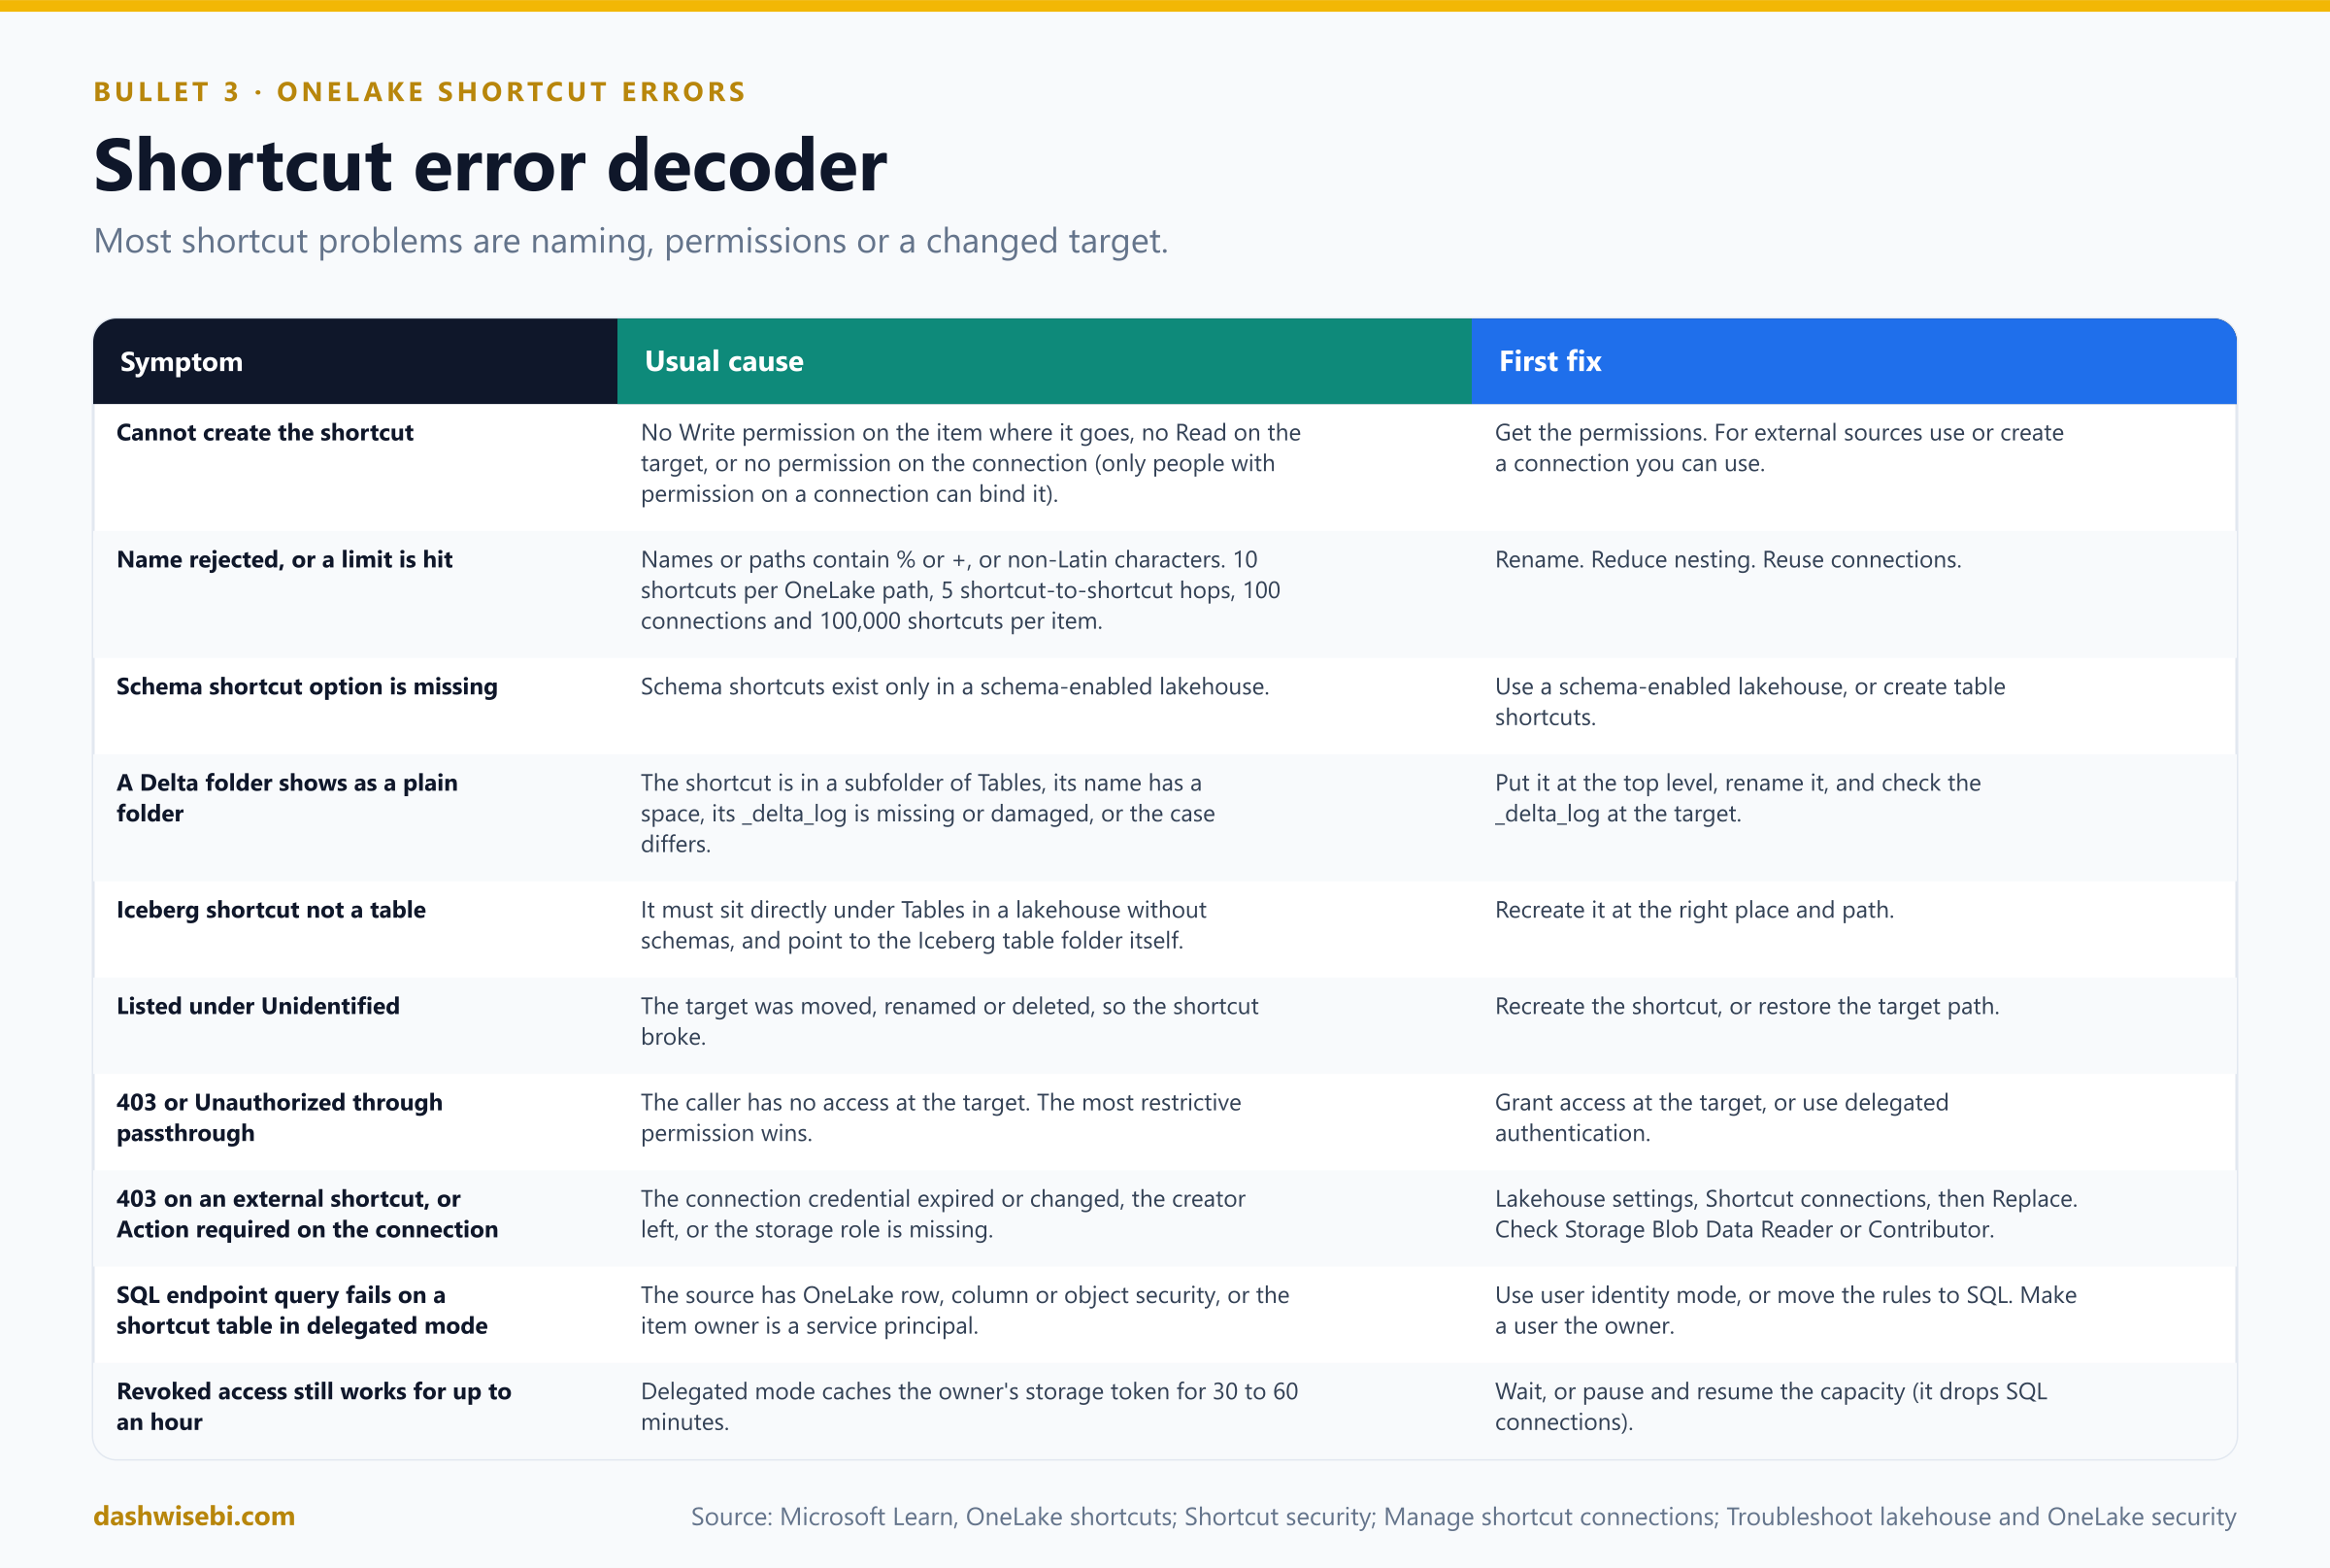
Quick reference
4. Optimize a Lakehouse table
A lakehouse stores tables as Delta Lake: Parquet files plus a transaction log. Over time, writes leave many small files, deleted rows pile up, and the layout stops matching how the data is read. Tuning means keeping files right-sized, laid out for the readers, and clean.
The small file problem
Each write adds files. Frequent small writes (streaming, micro-batches, many partitions) create many small files. That increases file-operation overhead, hurts compression and limits how well readers can parallelize. It affects Spark, the SQL analytics endpoint and Direct Lake. Even append-only tables that start fast can get slow without maintenance.
The toolbox
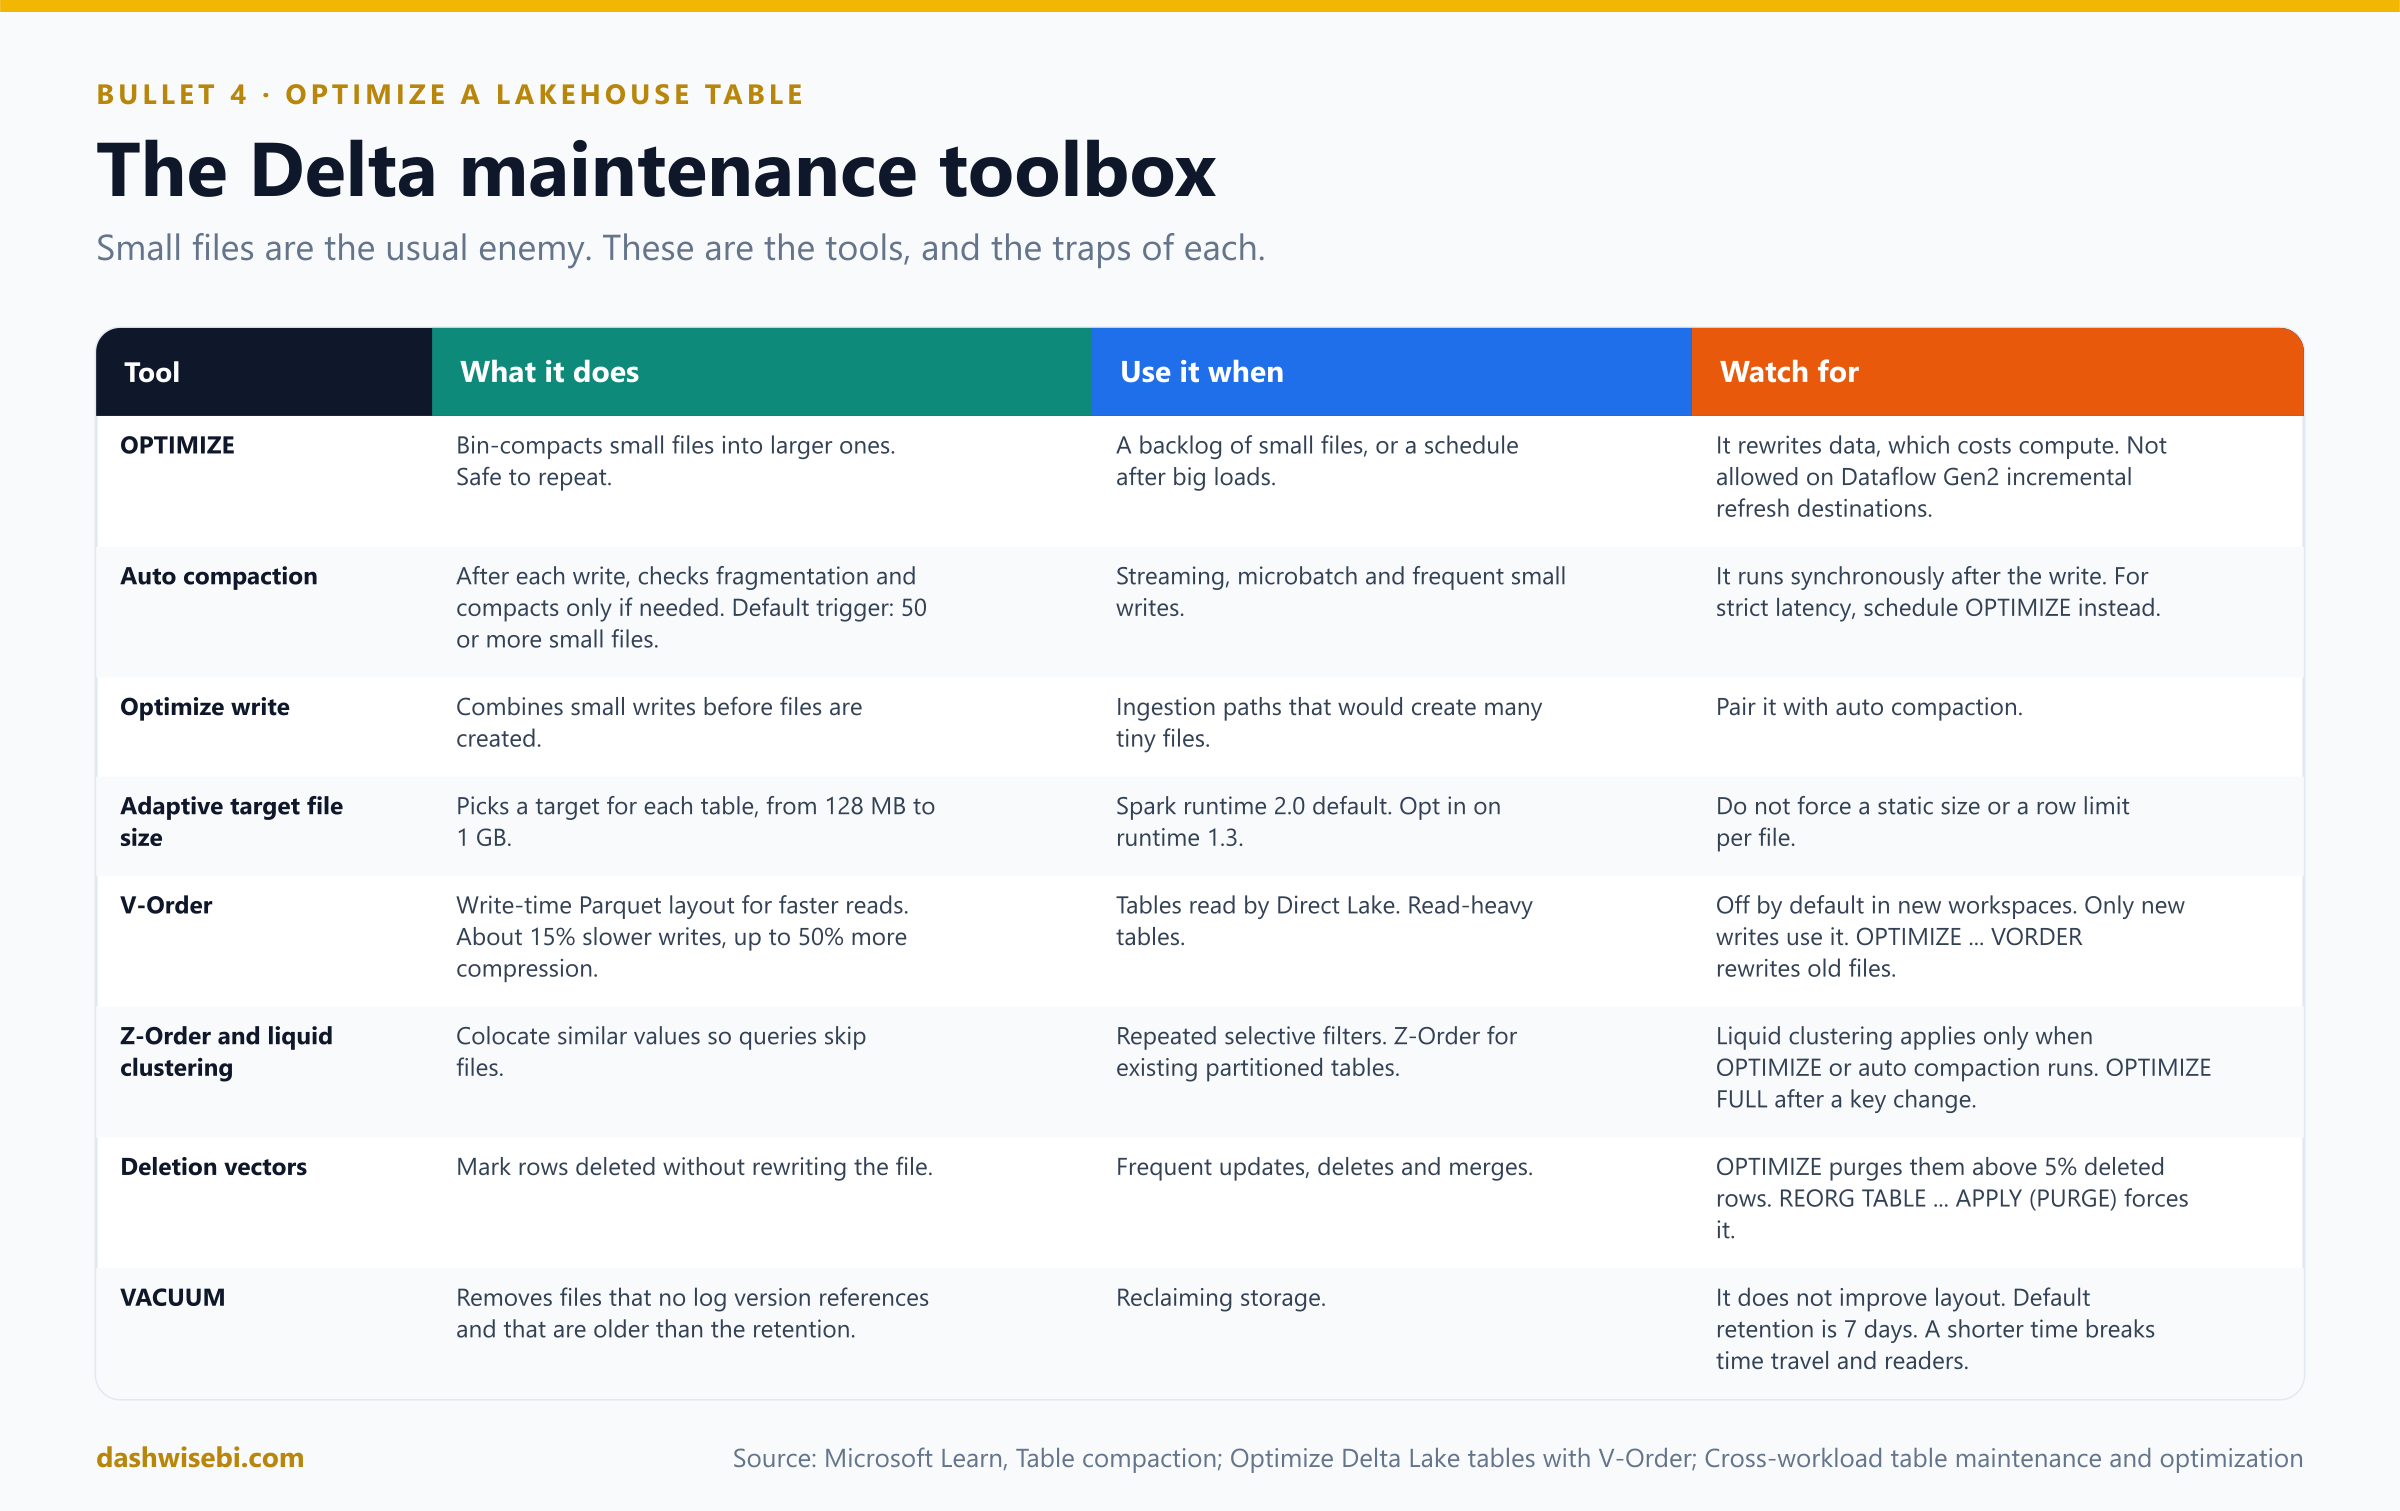
OPTIMIZEcompacts small files into larger ones (bin compaction). It is idempotent. The default minimum and maximum file size for it are both 1 GB. It rewrites data, so it costs compute. Dataflow Gen2 lakehouse destinations that use incremental refresh do not support it.- Auto compaction checks the table after every write and runs a synchronous
OPTIMIZEonly when needed. By default it triggers when at least 50 files are smaller than half of a 128 MB target. Microsoft recommends it as the default for most ingestion. Because it runs right after the write, a job with strict latency targets should scheduleOPTIMIZEseparately instead. - Optimize write combines small writes before files are created, which is usually cheaper than compacting afterwards. Use it with auto compaction for streaming and micro-batches.
- Adaptive target file size chooses a target for each table, from 128 MB to 1 GB. It is on by default in Spark runtime 2.0 and opt-in in 1.3. Do not force a static size or a row limit per file: row width varies, and a row limit makes too many small files for narrow tables.
- V-Order is a write-time layout of the Parquet files that makes reads faster across Fabric engines. It costs about 15% on write time and can give up to 50% more compression. It is off by default in new workspaces (
spark.sql.parquet.vorder.default = false) to favor ingestion. You can turn it on for a session, with the table propertydelta.parquet.vorder.enabled, or per write with the optionparquet.vorder.enabled. A resource profile such asreadHeavyForSparkorreadHeavyForPBIenables it too. It affects only new writes:OPTIMIZE ... VORDERrewrites existing files. - Z-Order (
OPTIMIZE ... ZORDER BY (cols)) colocates rows with similar values so queries can skip files. Use it when queries filter on two or more columns together, for example on an existing partitioned table. Liquid clustering is the more flexible replacement: you set the clustering columns on the table, but data is clustered only whenOPTIMIZE(or auto compaction) runs. Normal writes do not cluster. Changing the clustering columns needsOPTIMIZE FULLto recluster old files (Spark runtime 2.0). - Partitioning is not the default answer. Use it when a specific need justifies it, such as isolating concurrent writers that touch different partitions.
- Deletion vectors mark rows as deleted without rewriting the whole file, which makes updates, deletes and merges cheaper.
OPTIMIZEpurges a file's deletion vectors when more than 5% of its records are deleted.REORG TABLE ... APPLY (PURGE)forces a purge when you must (for example for compliance). VACUUMdeletes files that no table version references and that are older than the retention period. It reclaims storage but does not improve the active layout. The default retention is 7 days. Portal and API requests with a shorter period fail by default, because removing files too early breaks time travel and concurrent readers and writers.
-- One-time compaction of a table with a backlog of small files
OPTIMIZE silver_orders;

-- Compact, colocate data for selective filters, and apply V-Order in one pass
OPTIMIZE silver_orders ZORDER BY (CustomerKey, OrderDate) VORDER;

-- Keep it healthy afterwards: compact automatically after writes
ALTER TABLE silver_orders SET TBLPROPERTIES ('delta.autoOptimize.autoCompact' = 'true');

-- A gold table read by Direct Lake: V-Order for new writes, and rewrite the old files
ALTER TABLE gold_sales SET TBLPROPERTIES ('delta.parquet.vorder.enabled' = 'true');
OPTIMIZE gold_sales VORDER;

-- Liquid clustering: choose the columns, then let OPTIMIZE apply them
CREATE TABLE gold_sales_clustered (OrderDate DATE, CustomerKey INT, Amount DECIMAL(18,2))
USING DELTA CLUSTER BY (OrderDate, CustomerKey);

-- Remove old unreferenced files (default retention: 7 days)
VACUUM silver_orders;
Where to run maintenance
- Lakehouse explorer. Right-click a table under Tables and choose Maintenance. The Run maintenance commands dialog lets you turn on compaction (with an Apply V-order checkbox), VACUUM with a retention threshold, and the merge of deletion vector files. Select Run now. It works only on Delta tables, not Hive-format tables.
- Pipeline. The Lakehouse maintenance activity (preview) runs
OPTIMIZE(with optional V-Order) andVACUUMas part of a pipeline, after a load, and can be followed by a Refresh SQL analytics endpoint activity. - Notebook or REST API for code-first or scheduled runs.
- Track it. Look for activities with
TableMaintenancein the name in the Monitor hub, or the notification pane. Run maintenance after large ingests or when reads slow down and you see many small files. - If you must use a retention under 7 days, set
spark.databricks.delta.retentionDurationCheck.enabledtofalsein the Spark properties of the workspace's environment, and understand the time-travel risk first.
Tune for the consumer
The writer owns the layout, and the readers have preferences. One shared table is usually right.
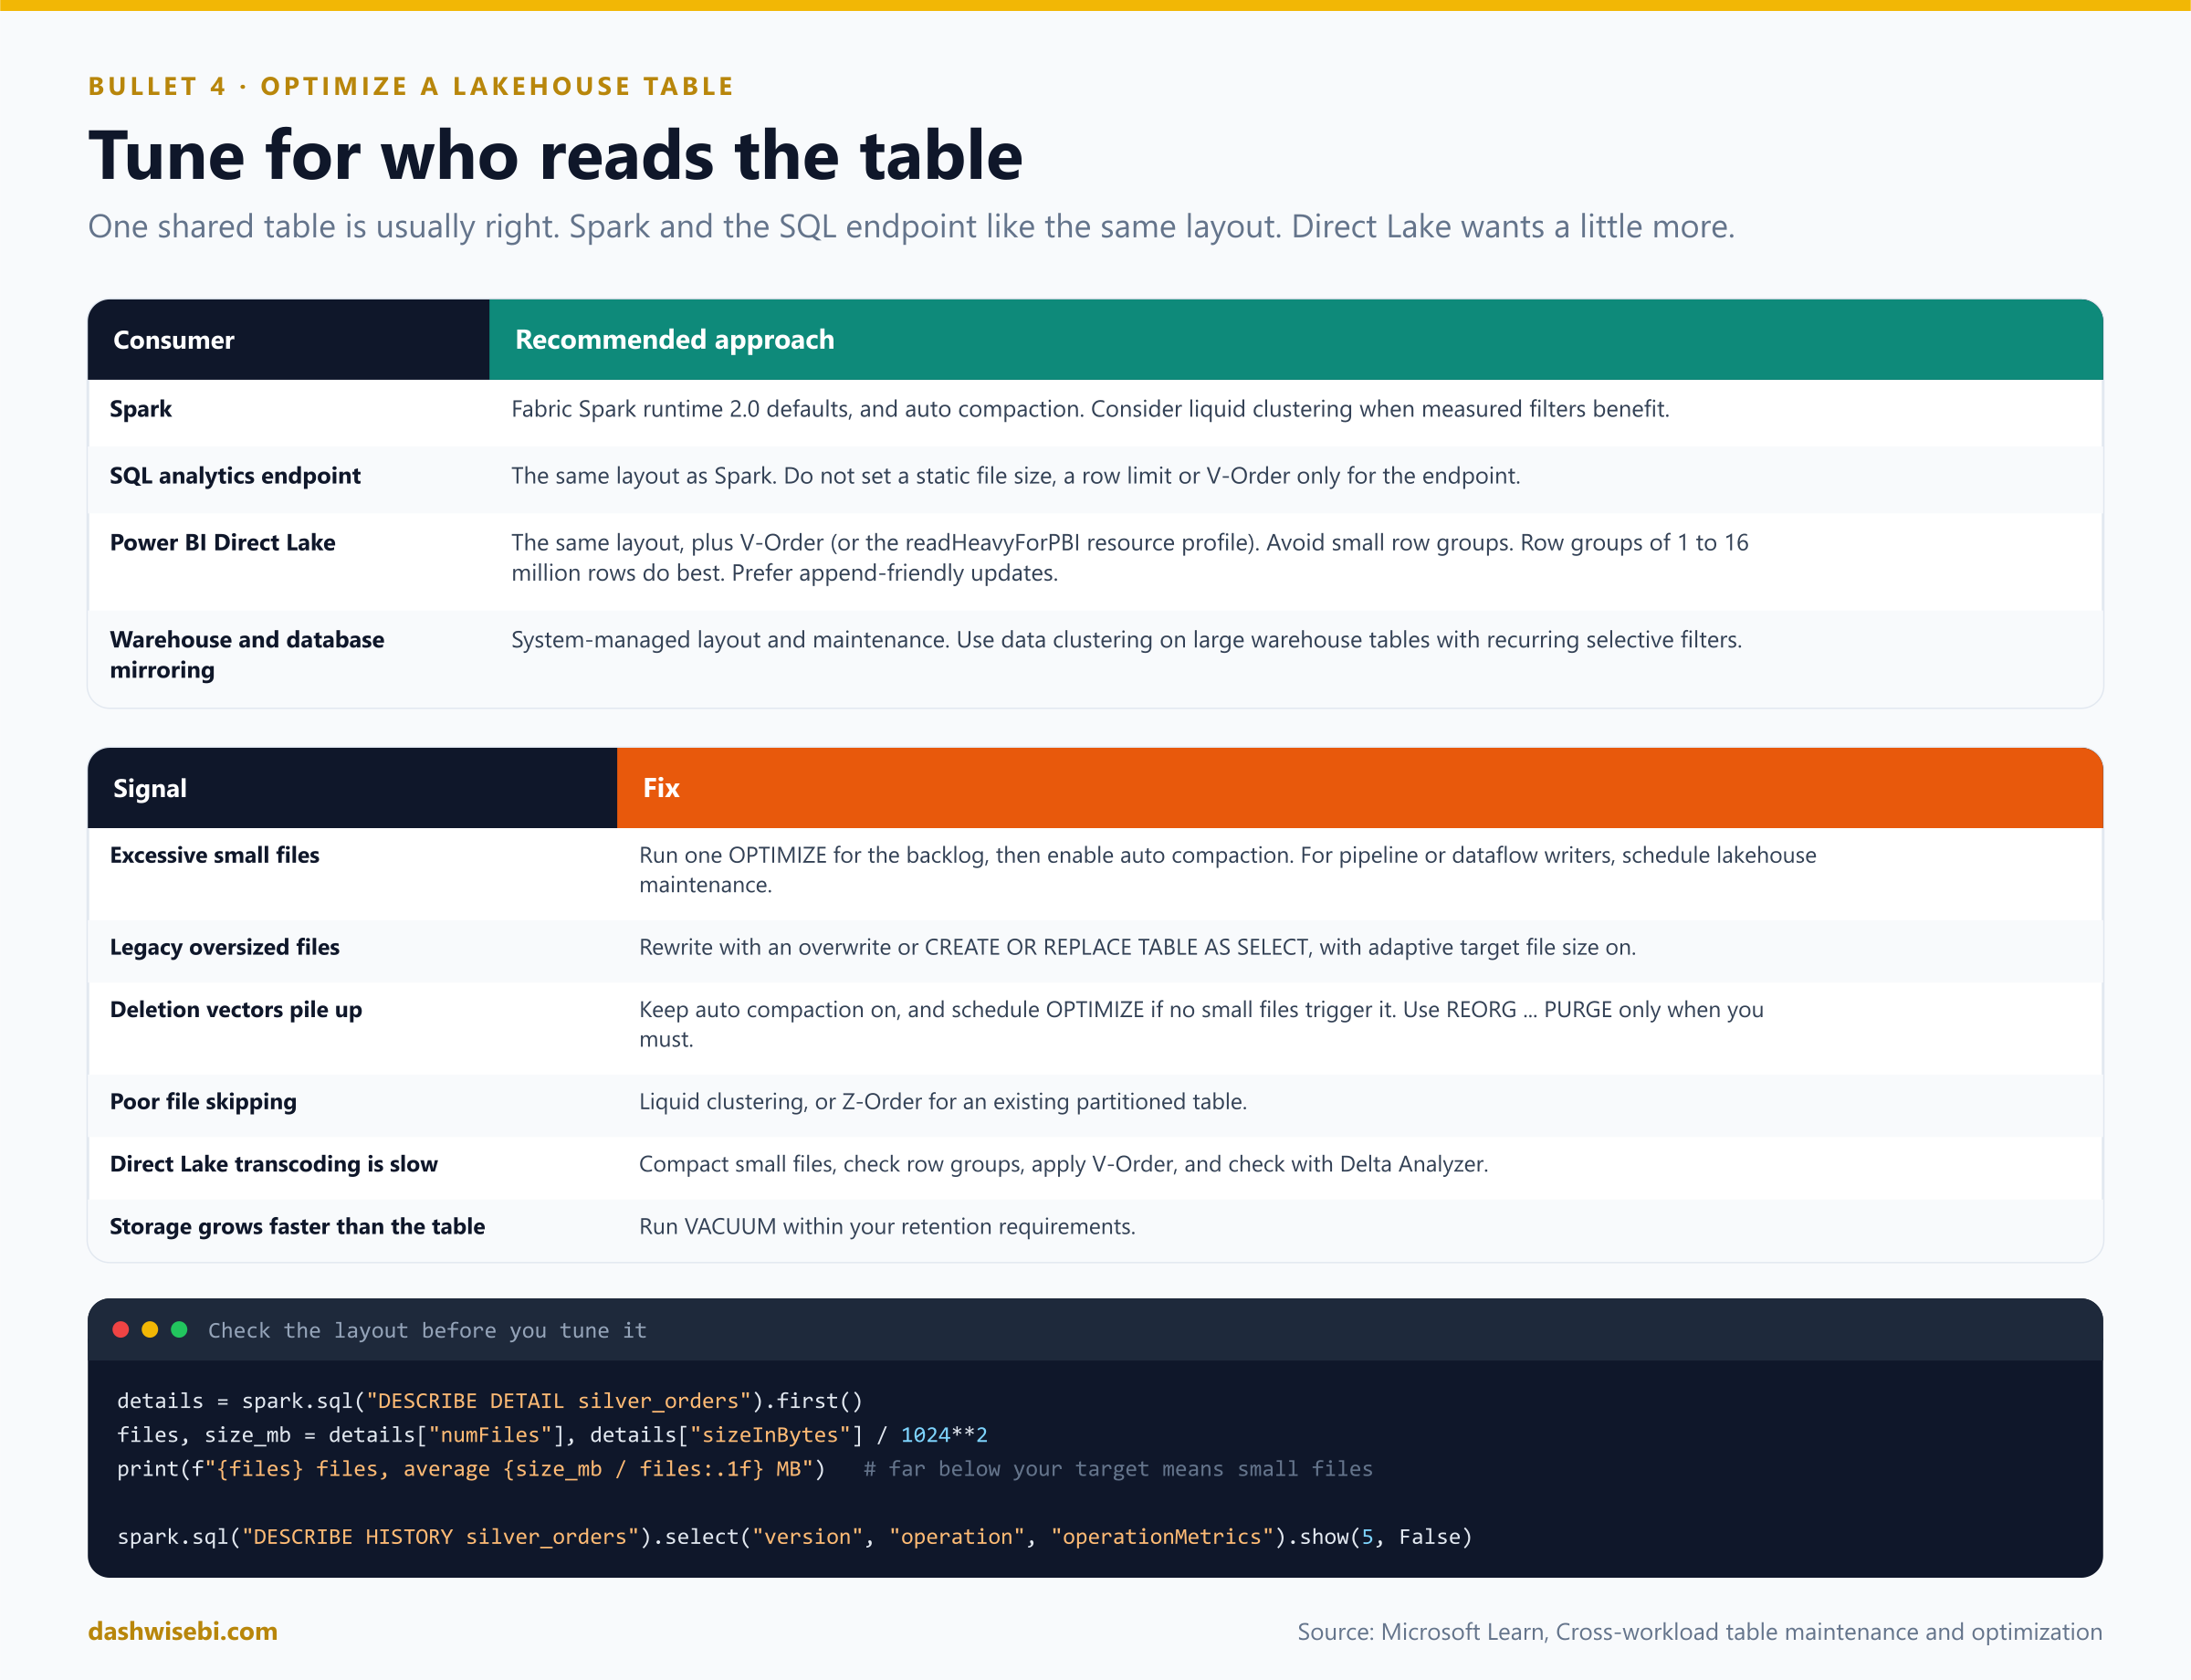
- Spark and the SQL analytics endpoint do well on the same layout: adaptive file sizes, no excess small files, and clustering when filters justify it. Do not set a static file size, a row limit or V-Order only for the endpoint.
- Power BI Direct Lake reads the same Delta tables but adds needs of its own. It prefers V-Order (or the
readHeavyForPBIprofile), avoids small row groups (1 to 16 million rows per row group do best), and likes append-friendly updates, which keep existing Parquet files and allow incremental framing. Use Delta Analyzer to inspect the layout. - Pipeline Copy activity and Dataflow Gen2 write tables without Spark's defaults. Check the resulting file layout and schedule lakehouse maintenance separately.
- Warehouse and database mirroring manage their own layout and compaction. For a warehouse, use data clustering on large tables with repeated selective filters, and keep V-Order on (it is on by default).
- Medallion layers. Bronze: favor write throughput and compact with auto compaction. Silver: reuse across engines, and enable V-Order only if Direct Lake is a main reader. Gold: the best place for Direct Lake models.
- Do not create another copy of the table only because several engines read it. Make a new table for a different grain, security, retention or latency need.
Measure before you tune
details = spark.sql("DESCRIBE DETAIL silver_orders").first()
files, size_mb = details["numFiles"], details["sizeInBytes"] / 1024**2
print(f"{files} files, average {size_mb / files:.1f} MB")   # far below your target means small files

spark.sql("DESCRIBE HISTORY silver_orders").select("version", "operation", "operationMetrics").show(5, False)
An average can hide skew between old and new files, so check the distribution before you change settings. After OPTIMIZE, the history shows numFilesAdded, numFilesRemoved and file size percentiles, which confirm that the files got fewer and larger.
5. Optimize a pipeline
Pipeline optimization is mostly Copy activity optimization, plus good pipeline design. The speed limit is the slowest of three things: the source, the destination and the network between them. Tuning cannot beat them, but it can stop you from leaving them idle.
Four levers
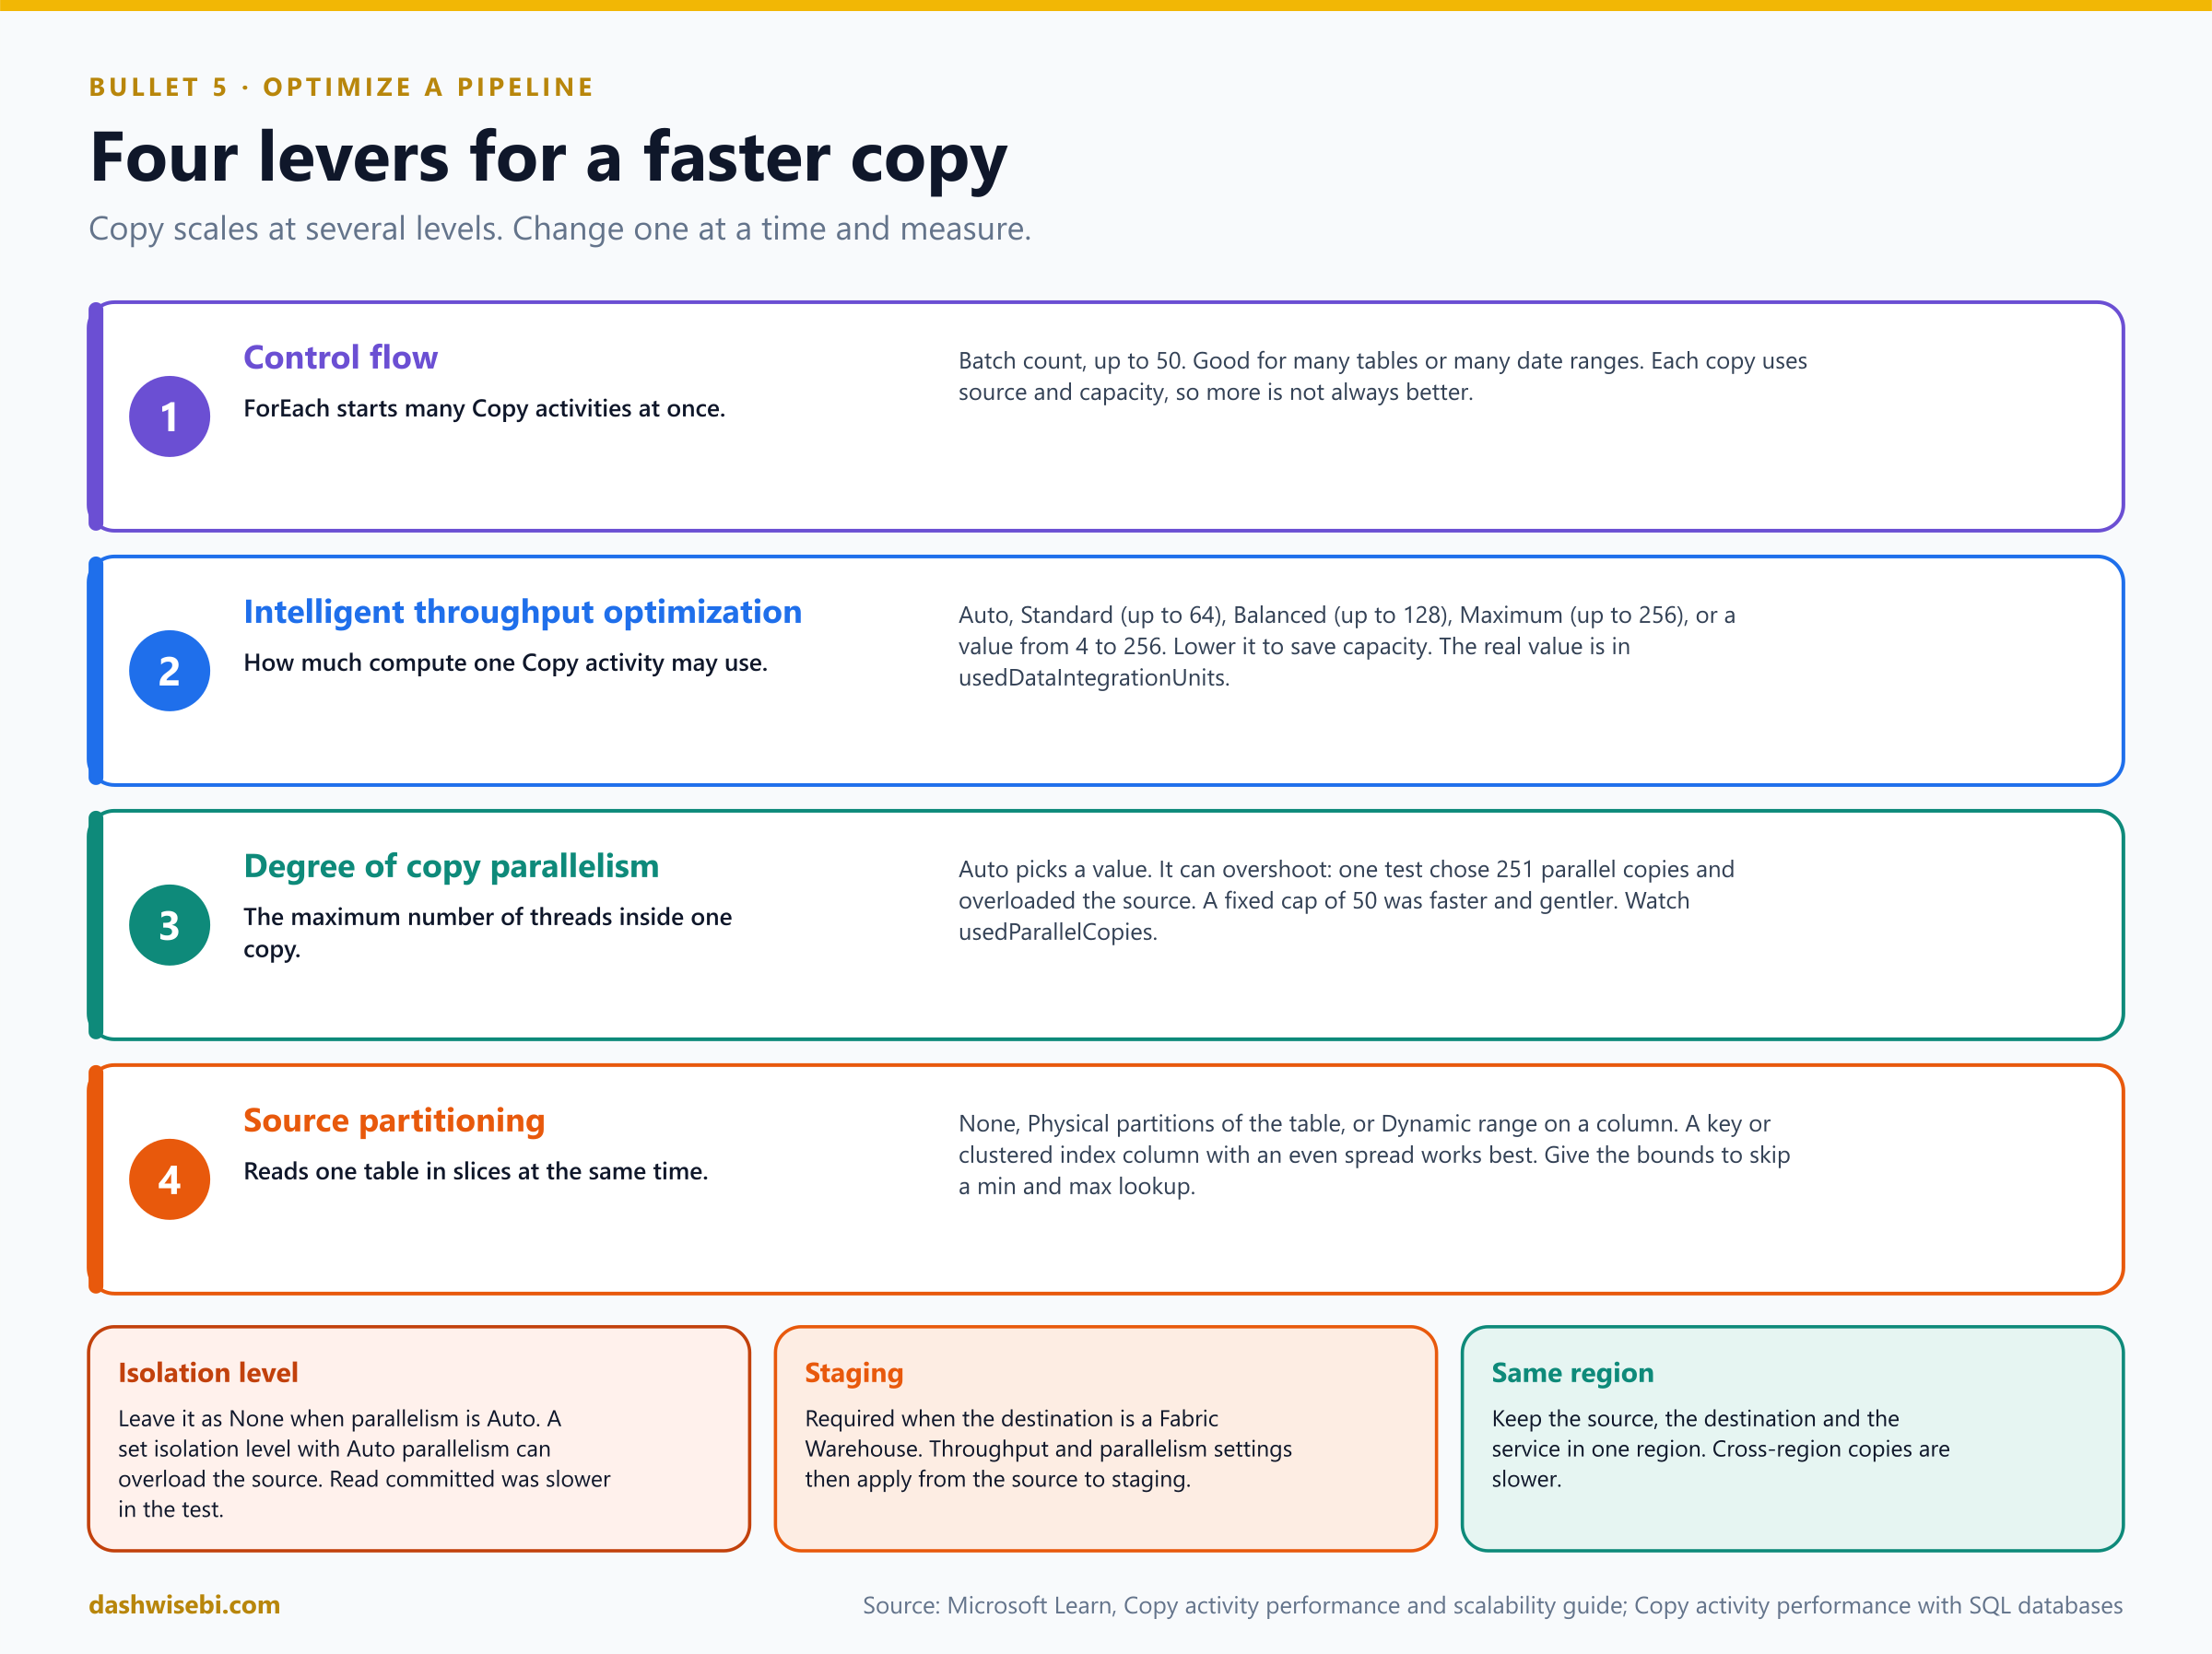
- Control flow. A ForEach can start many Copy activities at once, with a batch count of up to 50. Use it for many tables or many date ranges, driven by a control table (Episode 6).
- Intelligent throughput optimization. How much compute one Copy activity may use: Auto, Standard (up to 64), Balanced (up to 128), Maximum (up to 256), or a custom value from 4 to 256. It is a maximum: the service uses only what it needs, and the real value is reported as
usedDataIntegrationUnits. Lower it to save capacity. - Degree of copy parallelism. The maximum number of threads inside one copy, which read the source or write the destination at once. It is separate from the throughput setting. Auto picks a value, but it can overshoot: each parallel copy is a session on the source, and too many can overtax it. The real value is
usedParallelCopies. - Source partitioning for database sources. The options are None, Physical partitions of table and Dynamic range. With physical partitions, the number of partitions limits the parallelism. With dynamic range the service generates one query per parallel copy over ranges of a column, so choose a key or clustered-index column with an even spread to avoid skew, and supply the upper and lower bounds yourself. Otherwise the service first queries the source for the minimum and maximum.
"typeProperties": {            // trimmed. The portal writes these for you
  "source": {
    "partitionOption": "DynamicRange",
    "partitionSettings": {
      "partitionColumnName": "o_orderkey",
      "partitionLowerBound": "1",
      "partitionUpperBound": "6000000000"
    }
  },
  "dataIntegrationUnits": 50,
  "parallelCopies": 50
}
What one test showed
Microsoft's own test copied 1.5 billion rows from Azure SQL Database into a lakehouse table on an F64 trial capacity. Remember it is a test of one setup, not a formal benchmark.
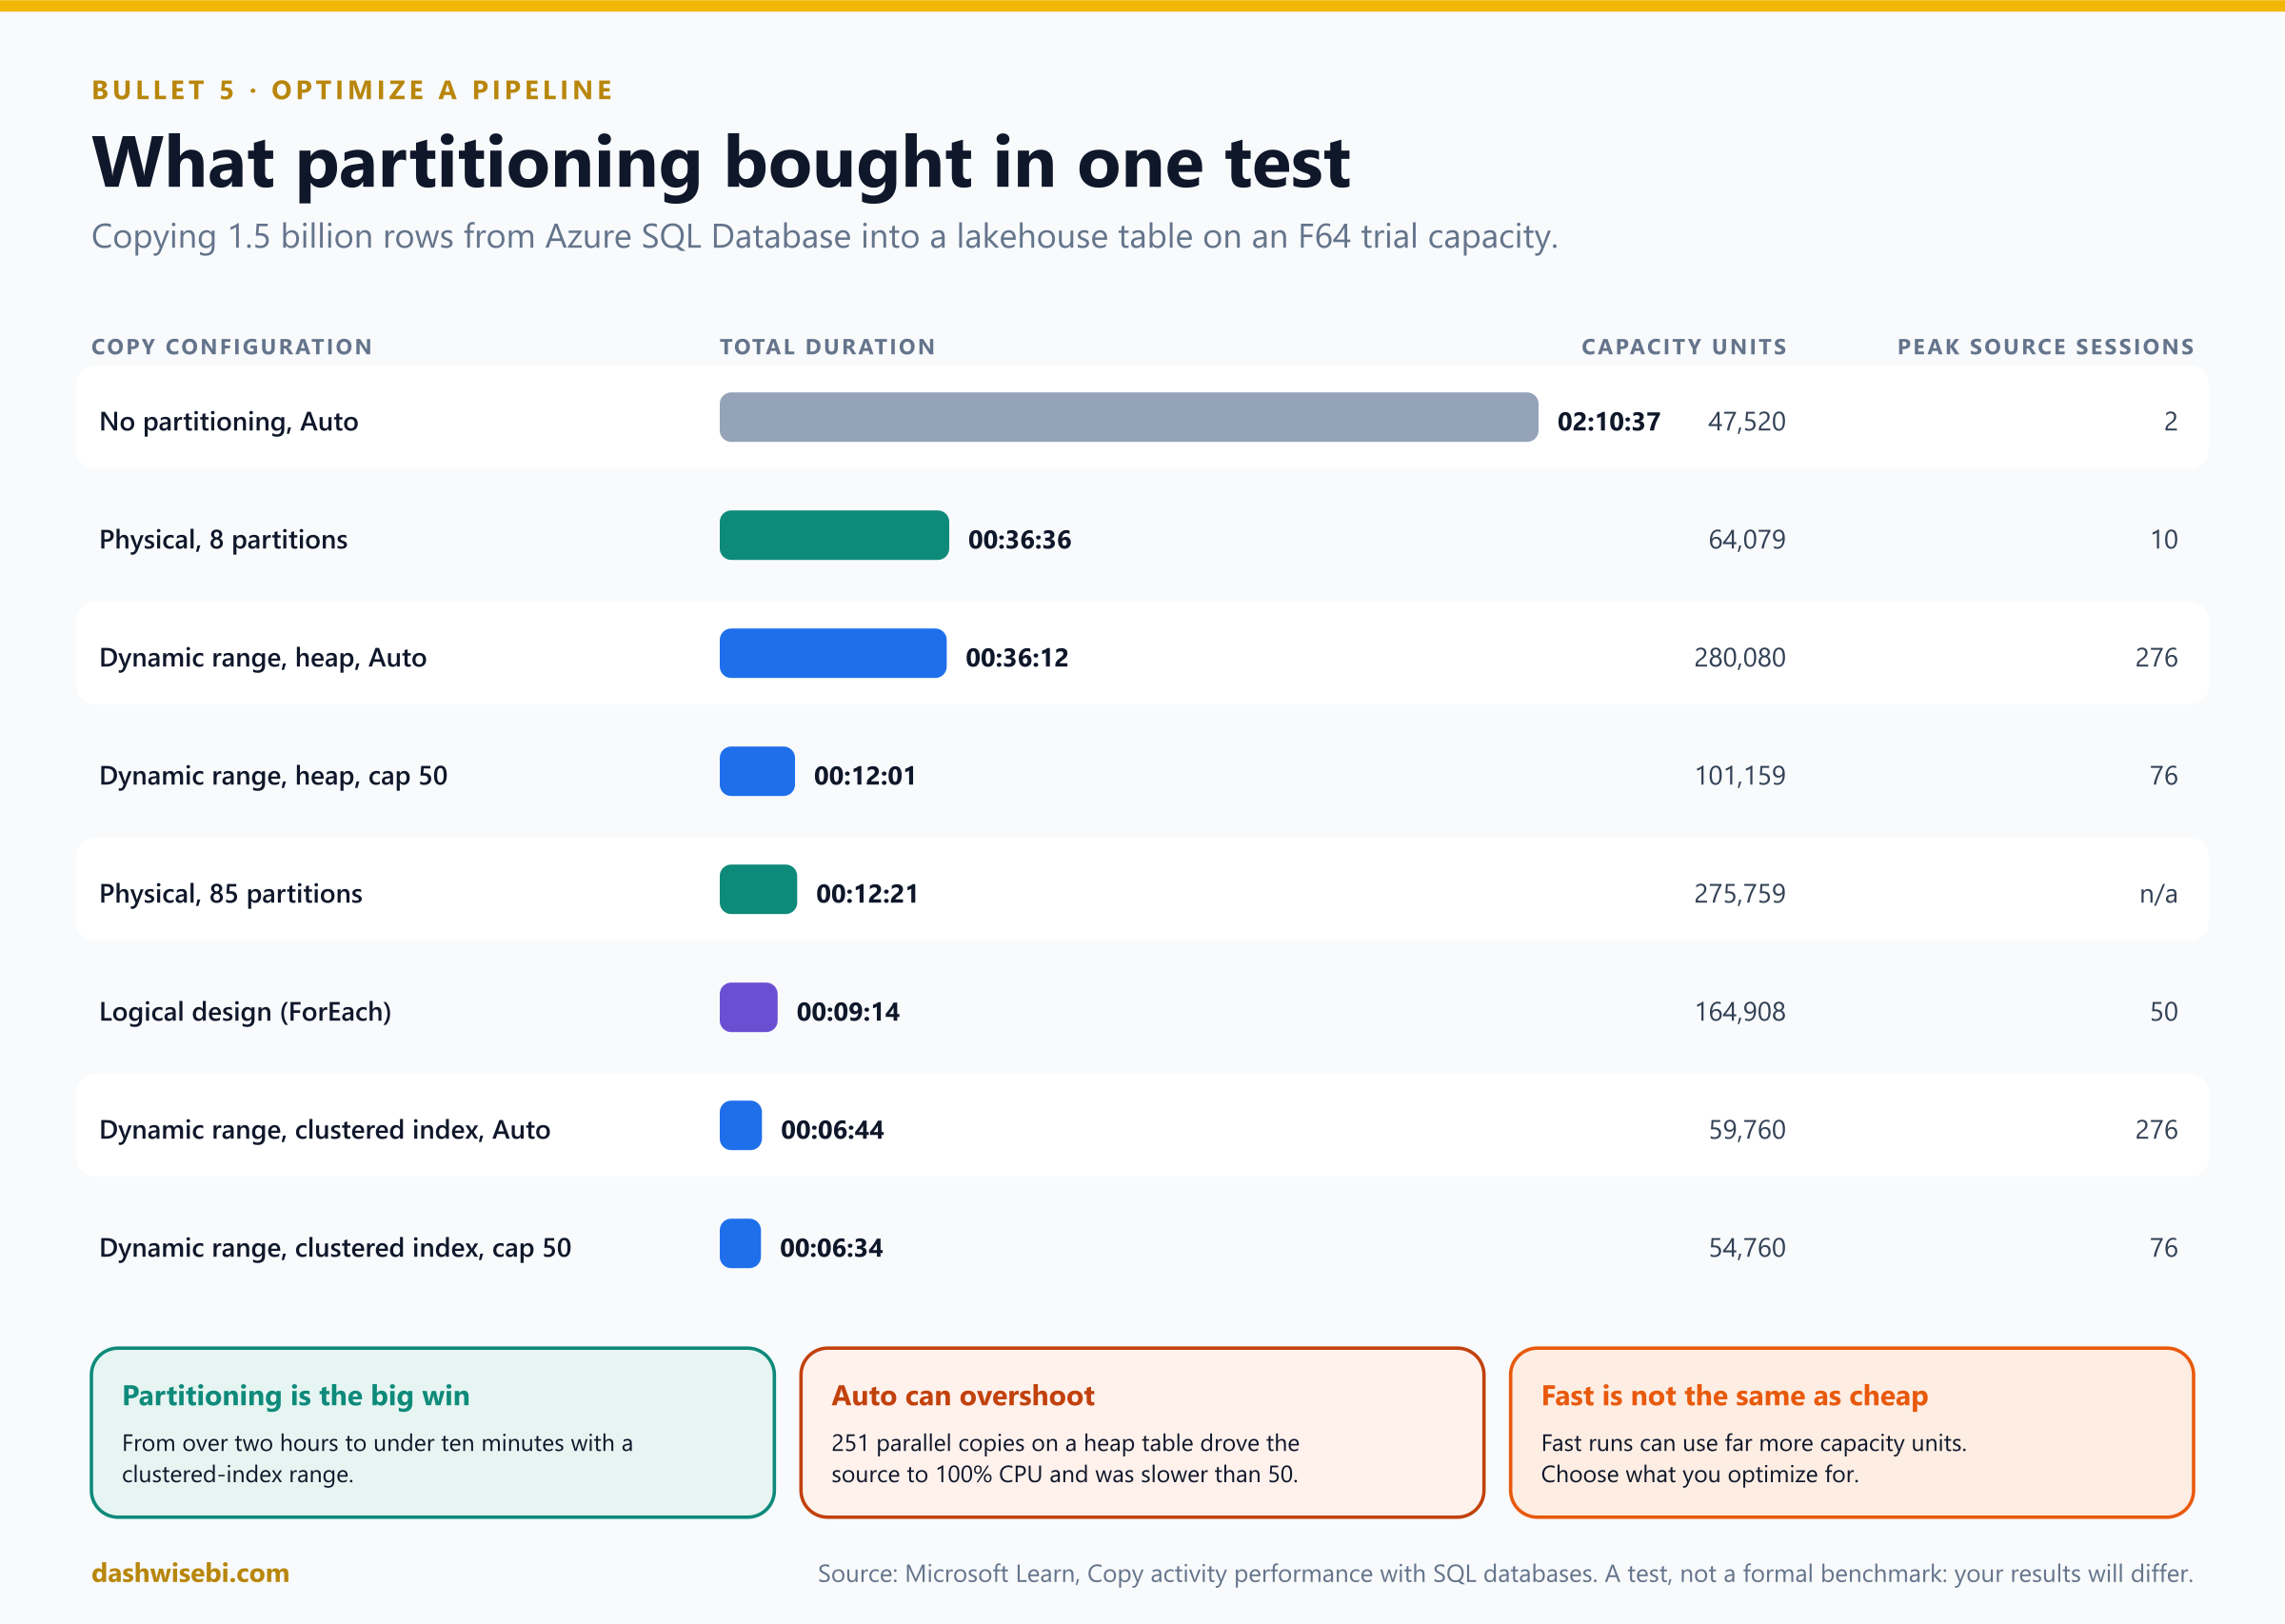
- The default (no partitioning, one copy) took about 2 hours 10 minutes and was gentle on the source (2 sessions).
- Partitioning was the big win. A dynamic range on a clustered index column finished in about 6.5 minutes with modest capacity use. A physical partitioning with 85 partitions took about 12 minutes. A logical design (a ForEach running many Copy activities over date ranges, up to 50 at once) took about 9 minutes, but used far more capacity units.
- Auto parallelism overshot. On a heap table, dynamic range with Auto created 251 parallel copies and drove the source to 100% CPU in about 36 minutes. A fixed degree of 50 finished in about 12 minutes with fewer sessions. On the clustered table the two were almost equal, because the index made each slice cheap.
- Isolation level. Setting one alongside Auto parallelism risks overloading the source. Leave it at None unless it is a requirement. In the test, Read committed was slower than none or Read uncommitted.
- Cost versus speed. Cutting the throughput setting from Maximum to a custom value of 50 made one test run 34% longer but used about 45.5% fewer capacity units. If you are not optimizing for duration, lower the setting.
- Staging. Copying into a Fabric Warehouse requires staging, so the throughput and parallelism settings apply from the source to staging. Workspace staging times out after 60 minutes, so use external staging for long loads (Episode 6).
- Region. Keep the source, the destination and the service in the same cloud region. A cross-region copy is slower.
The guidance in one sentence: if the table has physical partitions (and enough of them), use them. If the data is skewed or has few partitions, use dynamic range with bounds and a capped parallelism. If neither is fast enough and you can spend developer effort, use logical partitioning with ForEach. And if you do not know the source's design, the defaults are a safe, if slow, choice.
Find the bottleneck first
Open the Copy activity run from the Monitor hub. You see data read and written, files or rows copied, throughput, the settings applied, and the steps of the copy with their durations. The step with the longest duration is the bottleneck. For some runs a banner shows Performance tuning tips that name the bottleneck and suggest a change. The same information is in the activity output: dataRead, dataWritten, rowsRead, rowsCopied, rowsSkipped, copyDuration, throughput (KBps), usedDataIntegrationUnits, usedParallelCopies, sourcePeakConnections, sinkPeakConnections and perfRecommendation. Do not parse executionDetails, because its format can change.
Symptom to change
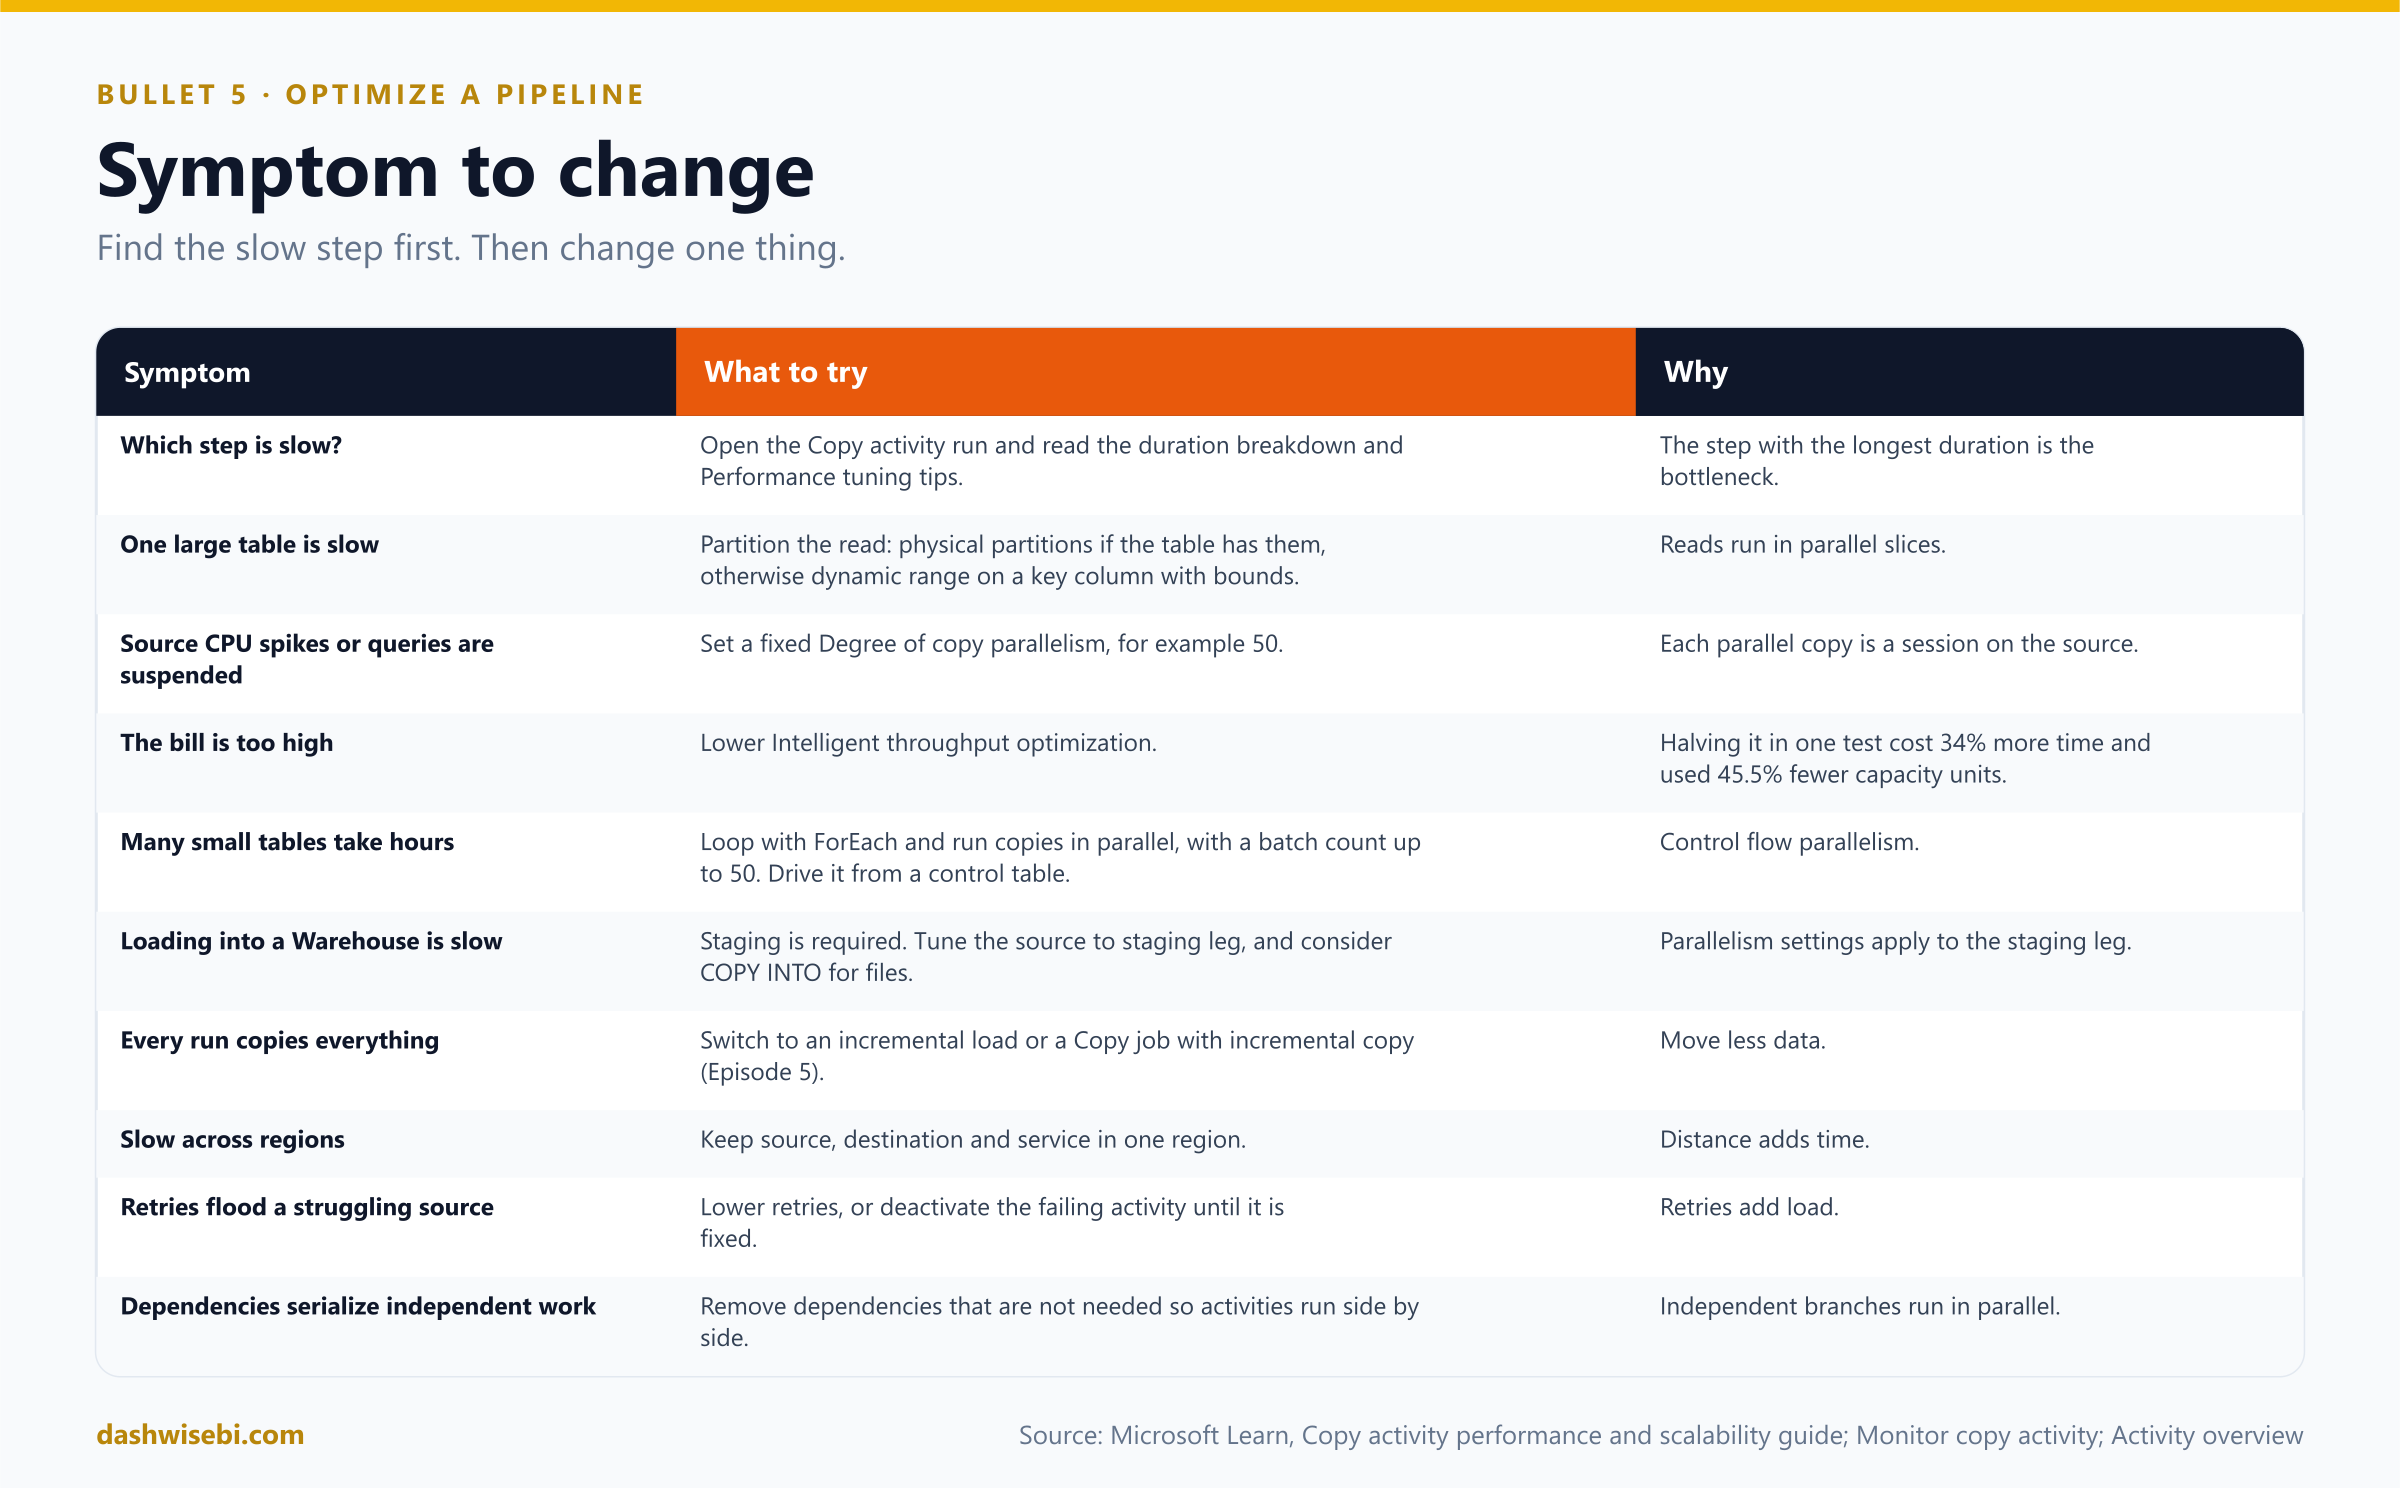
- Move less data. Replace full loads with incremental loads, or a Copy job with incremental copy (Episode 5). The fastest copy is the one you do not run.
- Run independent work side by side. Activities with no dependency between them run in parallel. Do not chain steps that do not need each other.
- Do transformation where it is cheap. The Copy activity is for movement and light shaping. Heavy transformation belongs in Spark, SQL or a dataflow (Episode 7).
- Schedule heavy loads off-peak and check the Capacity Metrics app (Episode 8) for the items that use the most capacity.
- Do not retry blindly. Retries add load to a source that may already be struggling.
Choosing the right answer
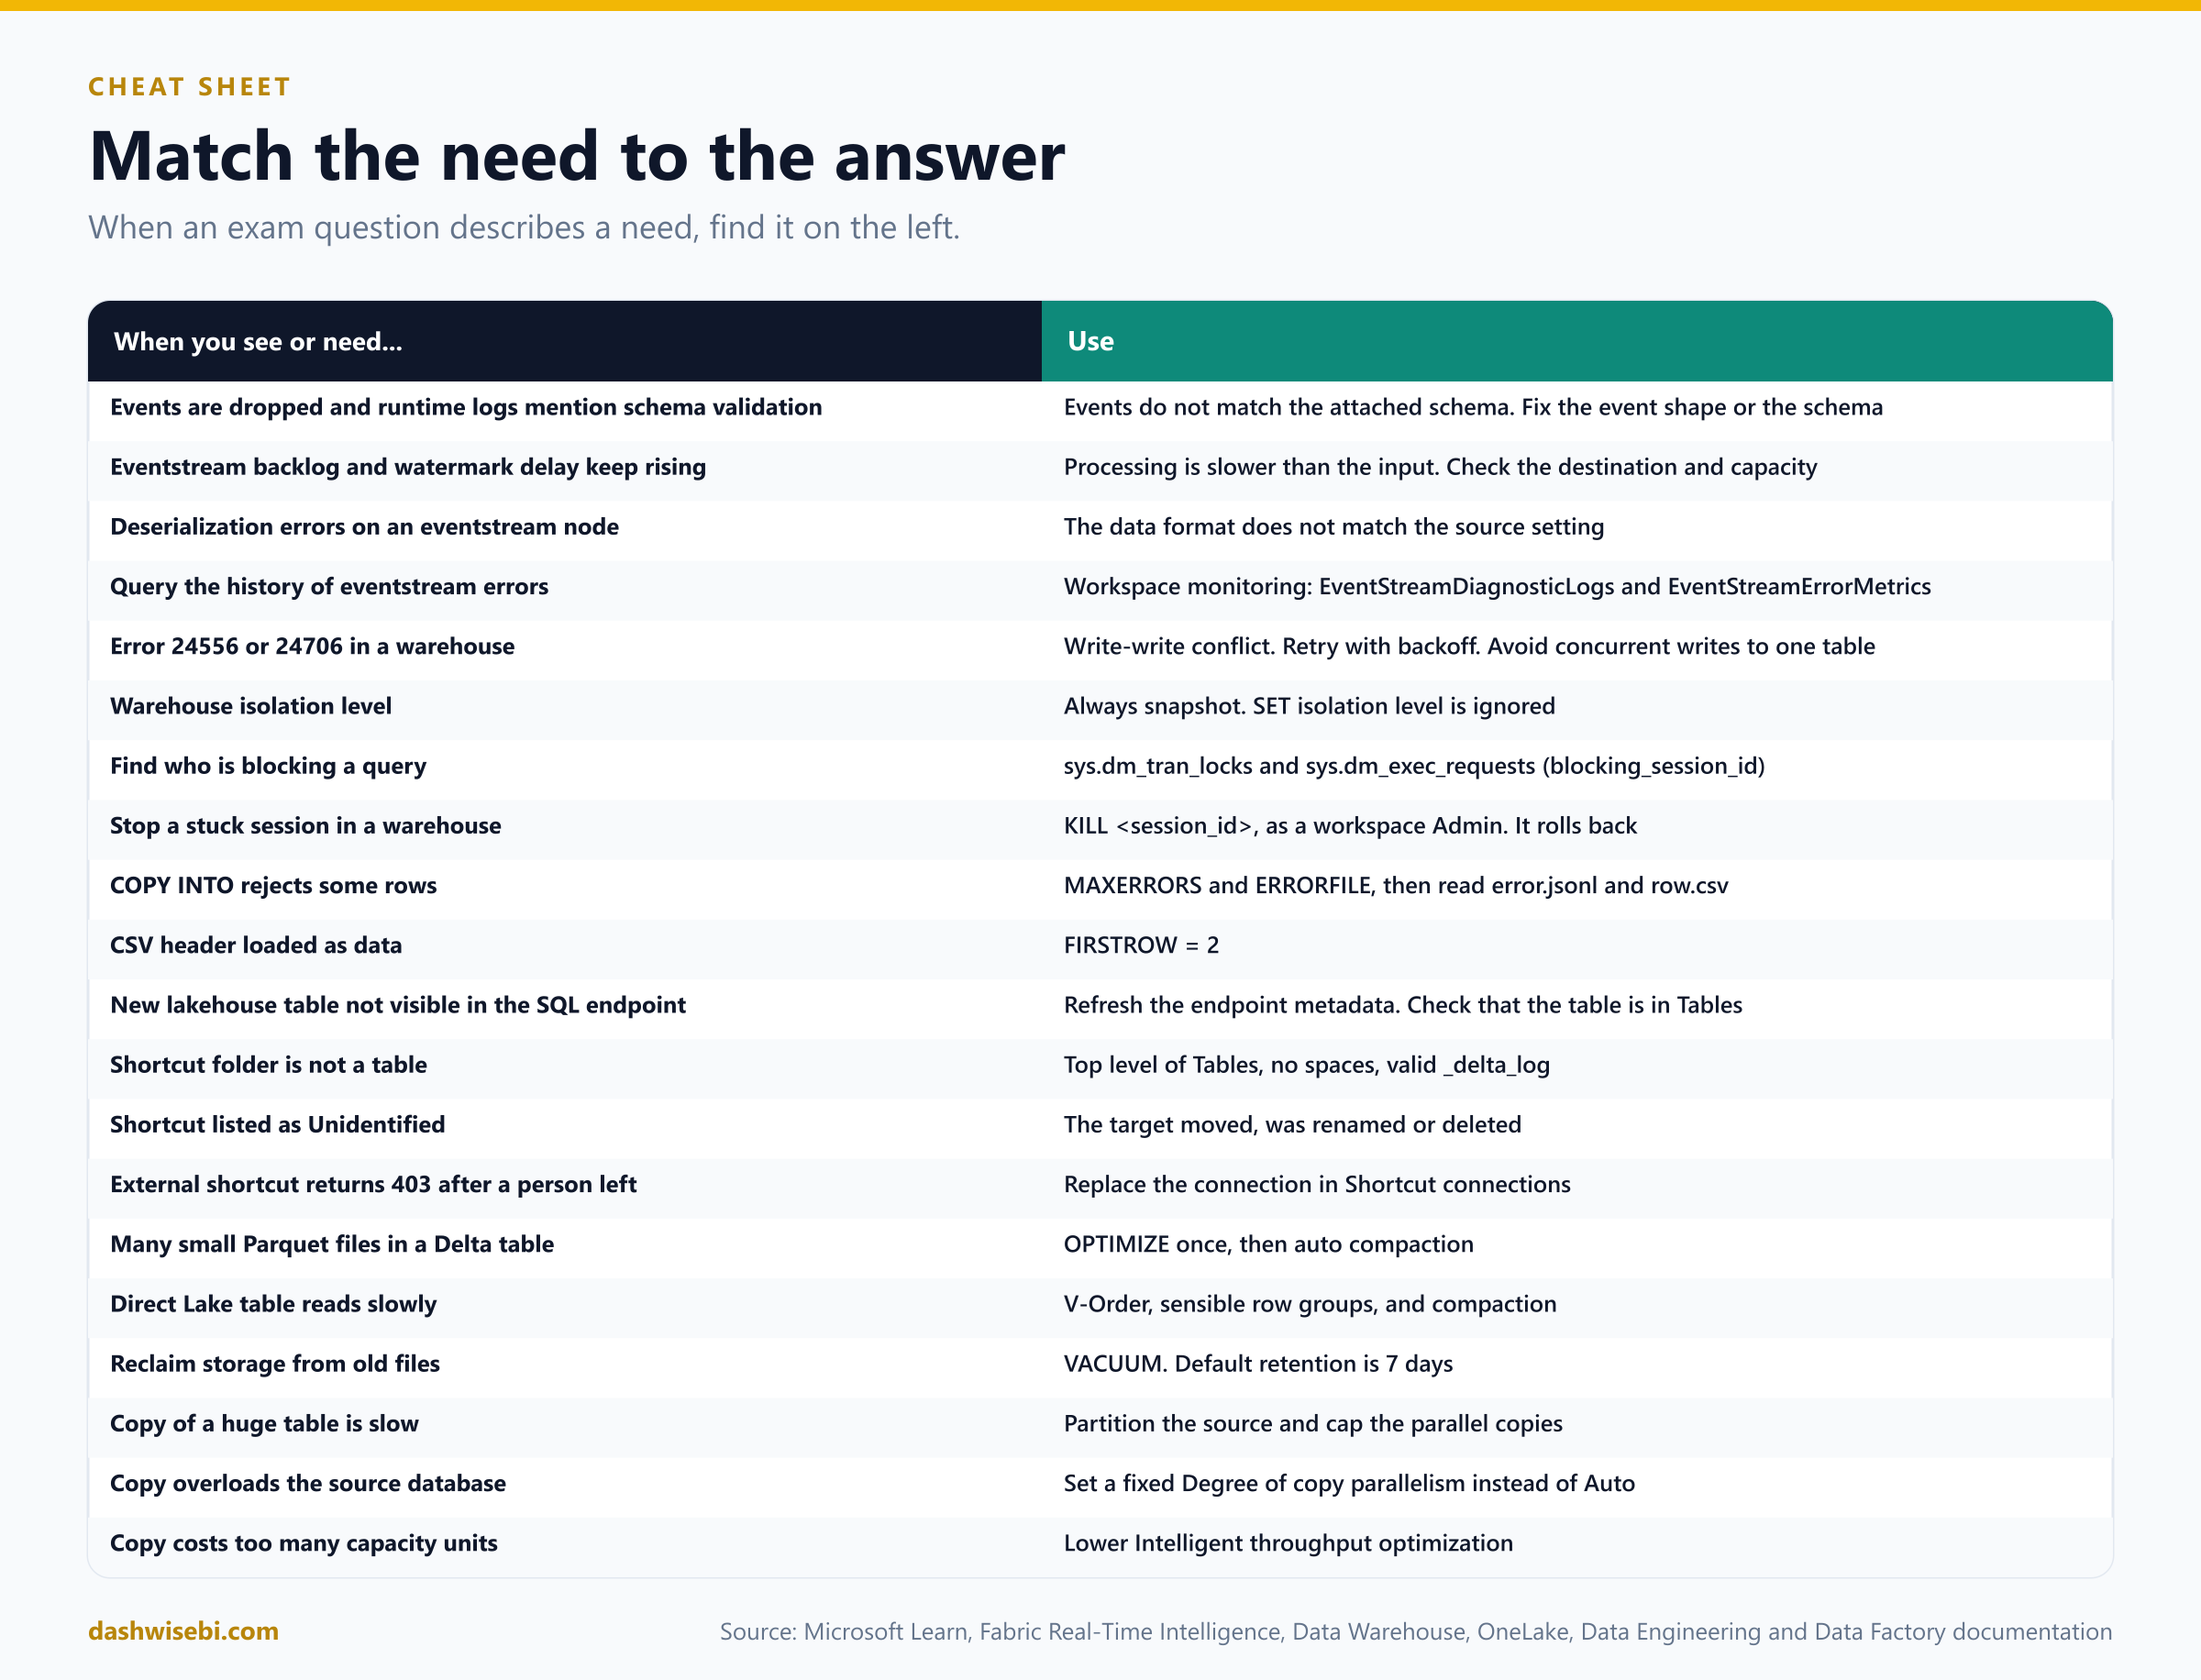
When an exam question describes a symptom, find it on the left and pick the answer on the right.
Common mix-ups
- "A warning on a destination means events were delivered." Warning means the node runs with issues. Check the logs and the table.
- "Events that break the schema are queued for later." They are dropped, and the validation error appears in the runtime logs.
- "Watermark delay is the network latency." It is how far behind the processing is, measured from the newest processed event's production time.
- "Workspace monitoring logs every eventstream automatically." You must also turn on Log Eventstream activity for each eventstream, and you need the Admin role.
- "Each diagnostic log row is one error." Repeated entries are throttled or aggregated.
- "I can set the Warehouse to read committed." The setting is ignored. It is always snapshot isolation.
- "Updates to different rows never conflict." Locking is at table level, so they can.
- "A transaction that gets 24556 is lost for good." Retry it. Another transaction committed first.
- "A MERGE that only inserts cannot conflict." It can, if it is not the first to commit.
- "Readers block writers in the Warehouse." Snapshot isolation means they do not. DDL is what blocks.
- "Anyone can KILL a session." It takes the workspace Admin role. Viewer can only read the DMVs.
- "MAXERRORS lets the load succeed with any number of bad rows." It succeeds only if the rejected rows are fewer than MAXERRORS.
- "Rejected-row files are produced for pipelines and Parquet." Only for CSV and JSONL loaded with T-SQL.
- "A Spark table missing from the SQL endpoint must be broken." Check that it is under Tables, and refresh the metadata.
- "I can INSERT through the lakehouse SQL endpoint." It is read-only.
- "A shortcut in a subfolder of Tables becomes a table." Only top-level shortcuts do.
- "Deleting the target of a shortcut also removes the shortcut." The shortcut stays and breaks, under Unidentified.
- "A 403 on a shortcut always means the shortcut is wrong." It usually means the caller or the connection lacks access at the target.
- "Delegated SQL endpoint mode applies OneLake security." It does not, and it blocks shortcuts whose source has OneLake row, column or object security.
- "A revoked permission works immediately in delegated mode." A cached token can keep it working for 30 to 60 minutes.
- "V-Order is on by default and applies to old files." It is off by default in new workspaces, and it applies only to new writes.
- "VACUUM compacts files." It only removes unreferenced files. OPTIMIZE compacts.
- "Liquid clustering clusters data on every write." Only OPTIMIZE or auto compaction applies it.
- "Auto compaction is free." It runs synchronously after the write.
- "Set the parallel copies to Auto and forget it." Auto can overshoot and overload the source.
- "Maximum throughput is always best." It can cost many more capacity units for little gain.
- "Add an isolation level to speed up the source query." With Auto parallelism it can overload the source.
- "A Copy into a Warehouse needs no staging." Staging is required.
Try these scenarios
Eight exam-style questions. Cover the answers and test yourself.
1. The events that vanish
An eventstream delivers telemetry to an Eventhouse. After the sender added a field with a different type, many events are missing, and the runtime logs show validation errors. Why?
Answer: A schema is attached, and events that do not conform are dropped. Fix the event shape (or update the schema) and resend. Data conversion and deserialization error counts in the data insights confirm the type problem.
2. The first events are missing
A new eventstream with a lakehouse destination loses the first few minutes of data after publishing. What do you change?
Answer: Ingestion started before routing was initialized. Clear Activate ingestion on the destination, publish the eventstream, and then activate the ingestion.
3. Two jobs, two failures
Two ETL jobs update different customers in the same Warehouse table at the same time. One of them fails with error 24556. Why, and what do you do?
Answer: The Warehouse locks at table level under snapshot isolation, so concurrent UPDATEs of one table can conflict even on different rows. The first to commit wins. Retry the failed job with a delay (exponential backoff), and avoid running them at the same time.
4. Which rows were bad?
A COPY INTO from CSV fails with a bulk load data conversion error. You need to see the offending rows and load the good ones. How?
Answer: Set MAXERRORS and ERRORFILE (in the same storage location), read error.jsonl and row.csv with OPENROWSET, and fix the cause: for example FIRSTROW = 2 for a header, or a corrected file. Reload from an explicit path to the corrected file.
5. The table that is not there
A notebook writes a new Delta table in the lakehouse. Ten minutes later the SQL analytics endpoint does not show it. What do you check?
Answer: That the table is under the lakehouse Tables folder and uses supported column types, then refresh the endpoint metadata (the Refresh button, the REST API, or a Refresh SQL analytics endpoint activity at the end of the pipeline).
6. The engineer who left
Dozens of shortcuts to an ADLS Gen2 account start returning 403 after the engineer who created the connection left the company. What is the fastest fix?
Answer: Open the lakehouse Settings, Shortcut connections, find the broken connection in Action required, and Replace it with a connection that has valid credentials (and the Storage Blob Data Reader role). Every shortcut on it is updated at once.
7. A thousand tiny files
A streaming job writes to a lakehouse table every few seconds. Reads are slow and the table has thousands of small files. A Power BI Direct Lake model reads it. What do you do?
Answer: Run one OPTIMIZE for the backlog, then enable auto compaction and optimize write to keep files right-sized. Because Direct Lake reads it, also enable V-Order (or the readHeavyForPBI profile) and check the row groups. Run VACUUM separately to reclaim storage.
8. The two-hour copy
A pipeline copies a 2-billion-row table from Azure SQL Database in two hours. The DBA reports the source CPU reaches 100% whenever someone sets parallelism to Auto on a heap table. How do you make it faster and safer?
Answer: Partition the read with a dynamic range on a key column (give the bounds), and set a fixed Degree of copy parallelism (for example 50) instead of Auto. If you can, add a clustered index on the partition column at the source. Leave the isolation level at None, and lower the throughput setting if cost matters more than speed.
Where to go next
- Build a small eventstream with a schema and send a bad event on purpose. Find the error in the runtime logs, then turn on workspace monitoring and query
EventStreamDiagnosticLogs. - In a trial Warehouse, run two sessions that update the same table and cause an update conflict. Then create a blocked query with an open transaction and clear it with the DMVs.
- Run a
COPY INTOwith a bad row,MAXERRORSandERRORFILE, and readerror.jsonl. - Create shortcuts three ways: in a Tables subfolder, with a space in the name, and valid. See which become tables. Move the target and find the shortcut under Unidentified.
- Write a table with many tiny appends. Check
DESCRIBE DETAIL, runOPTIMIZE, and compare the file count and size. Then try auto compaction. - Copy a large table with and without a dynamic range partition, and compare the durations and
usedParallelCopiesin the activity output. - Read the sources behind this post: DP-700 study guide, Monitor the status and performance of an eventstream, Eventstream workspace monitoring overview, Transactions in Fabric Data Warehouse, Troubleshoot query blocking in Fabric Data Warehouse, Troubleshoot Transact-SQL ingestion errors using error files, What is the SQL analytics endpoint for a lakehouse?, SQL analytics endpoint metadata sync, T-SQL surface area, OneLake shortcuts, Secure and manage OneLake shortcuts, Manage shortcut connections, Troubleshoot OneLake security for SQL analytics endpoints, Troubleshoot permission and capacity errors in Data Engineering, Table compaction, Optimize Delta Lake tables with V-Order, Delta table maintenance in Microsoft Fabric, Cross-workload table maintenance and optimization, Copy activity performance and scalability guide, Copy activity performance with SQL databases and Monitor Copy activity.
Keep reading
DP-700 Episode 10: Streaming I, Engines & Eventstream
DP-700 study guide told as a story: pick a streaming engine, choose native tables or shortcuts, decide on query acceleration, and build an Eventstream.
DP-700 Episode 7: Batch Transformation with PySpark, SQL & KQL
DP-700 study guide to batch transformation in Fabric with PySpark, T-SQL and KQL: denormalizing, aggregating, and handling duplicate, missing and late data.