PL-300 Episode 2: Transform & Load Data in Power Query

PowerBI consultant ·
Welcome to Episode 2 of our PL-300 series. In Part 1 we connected to data and profiled it. Now the data is in Power Query, and it is messy. Dates are text, a table is the wrong shape, two files need to become one, and half the queries should never reach the report.
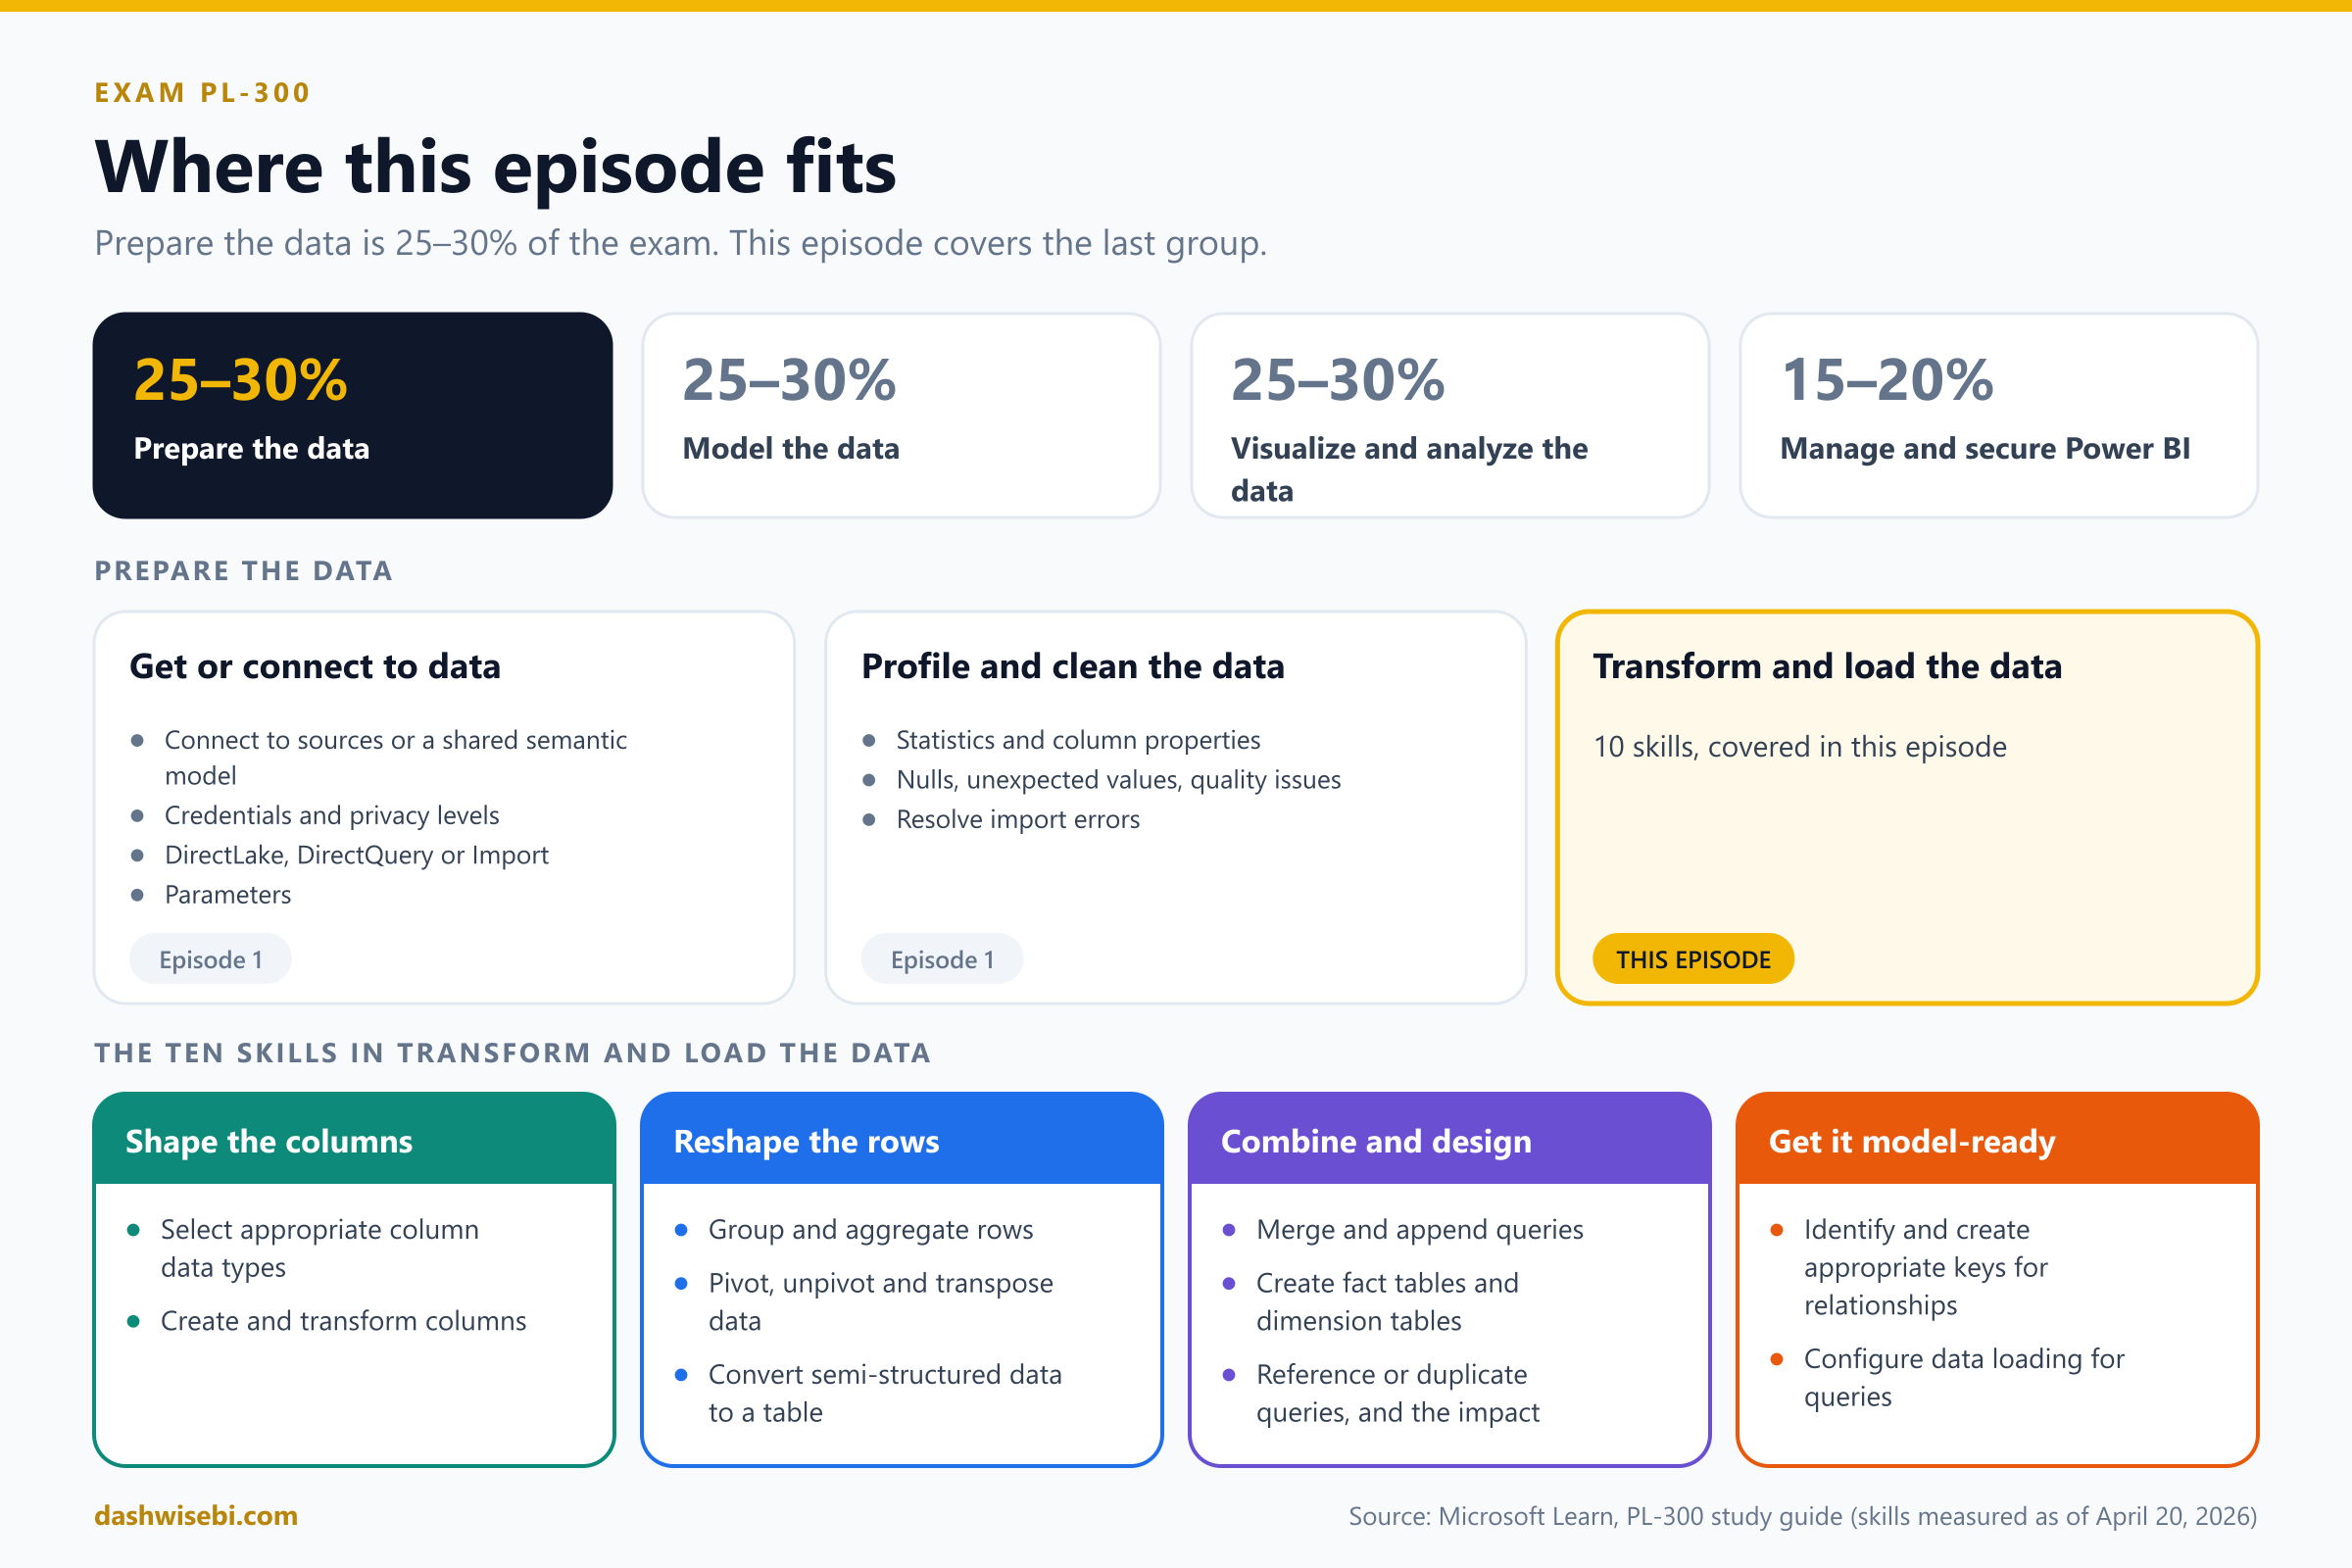
This episode covers the last group in the Prepare the data skill area (25 to 30 percent of the exam): Transform and load the data. Every skill below comes with a small example, and most come with real screenshots from Power BI Desktop.
By the end you will be able to:
- Select the right column data types, and fix a locale problem
- Create and transform columns
- Group and aggregate rows
- Pivot, unpivot and transpose data
- Convert semi-structured data, such as JSON, to a table
- Merge and append queries
- Create fact tables and dimension tables
- Identify and create keys for relationships
- Use reference and duplicate, and know the impact
- Configure data loading for queries
1. Select the right column data types
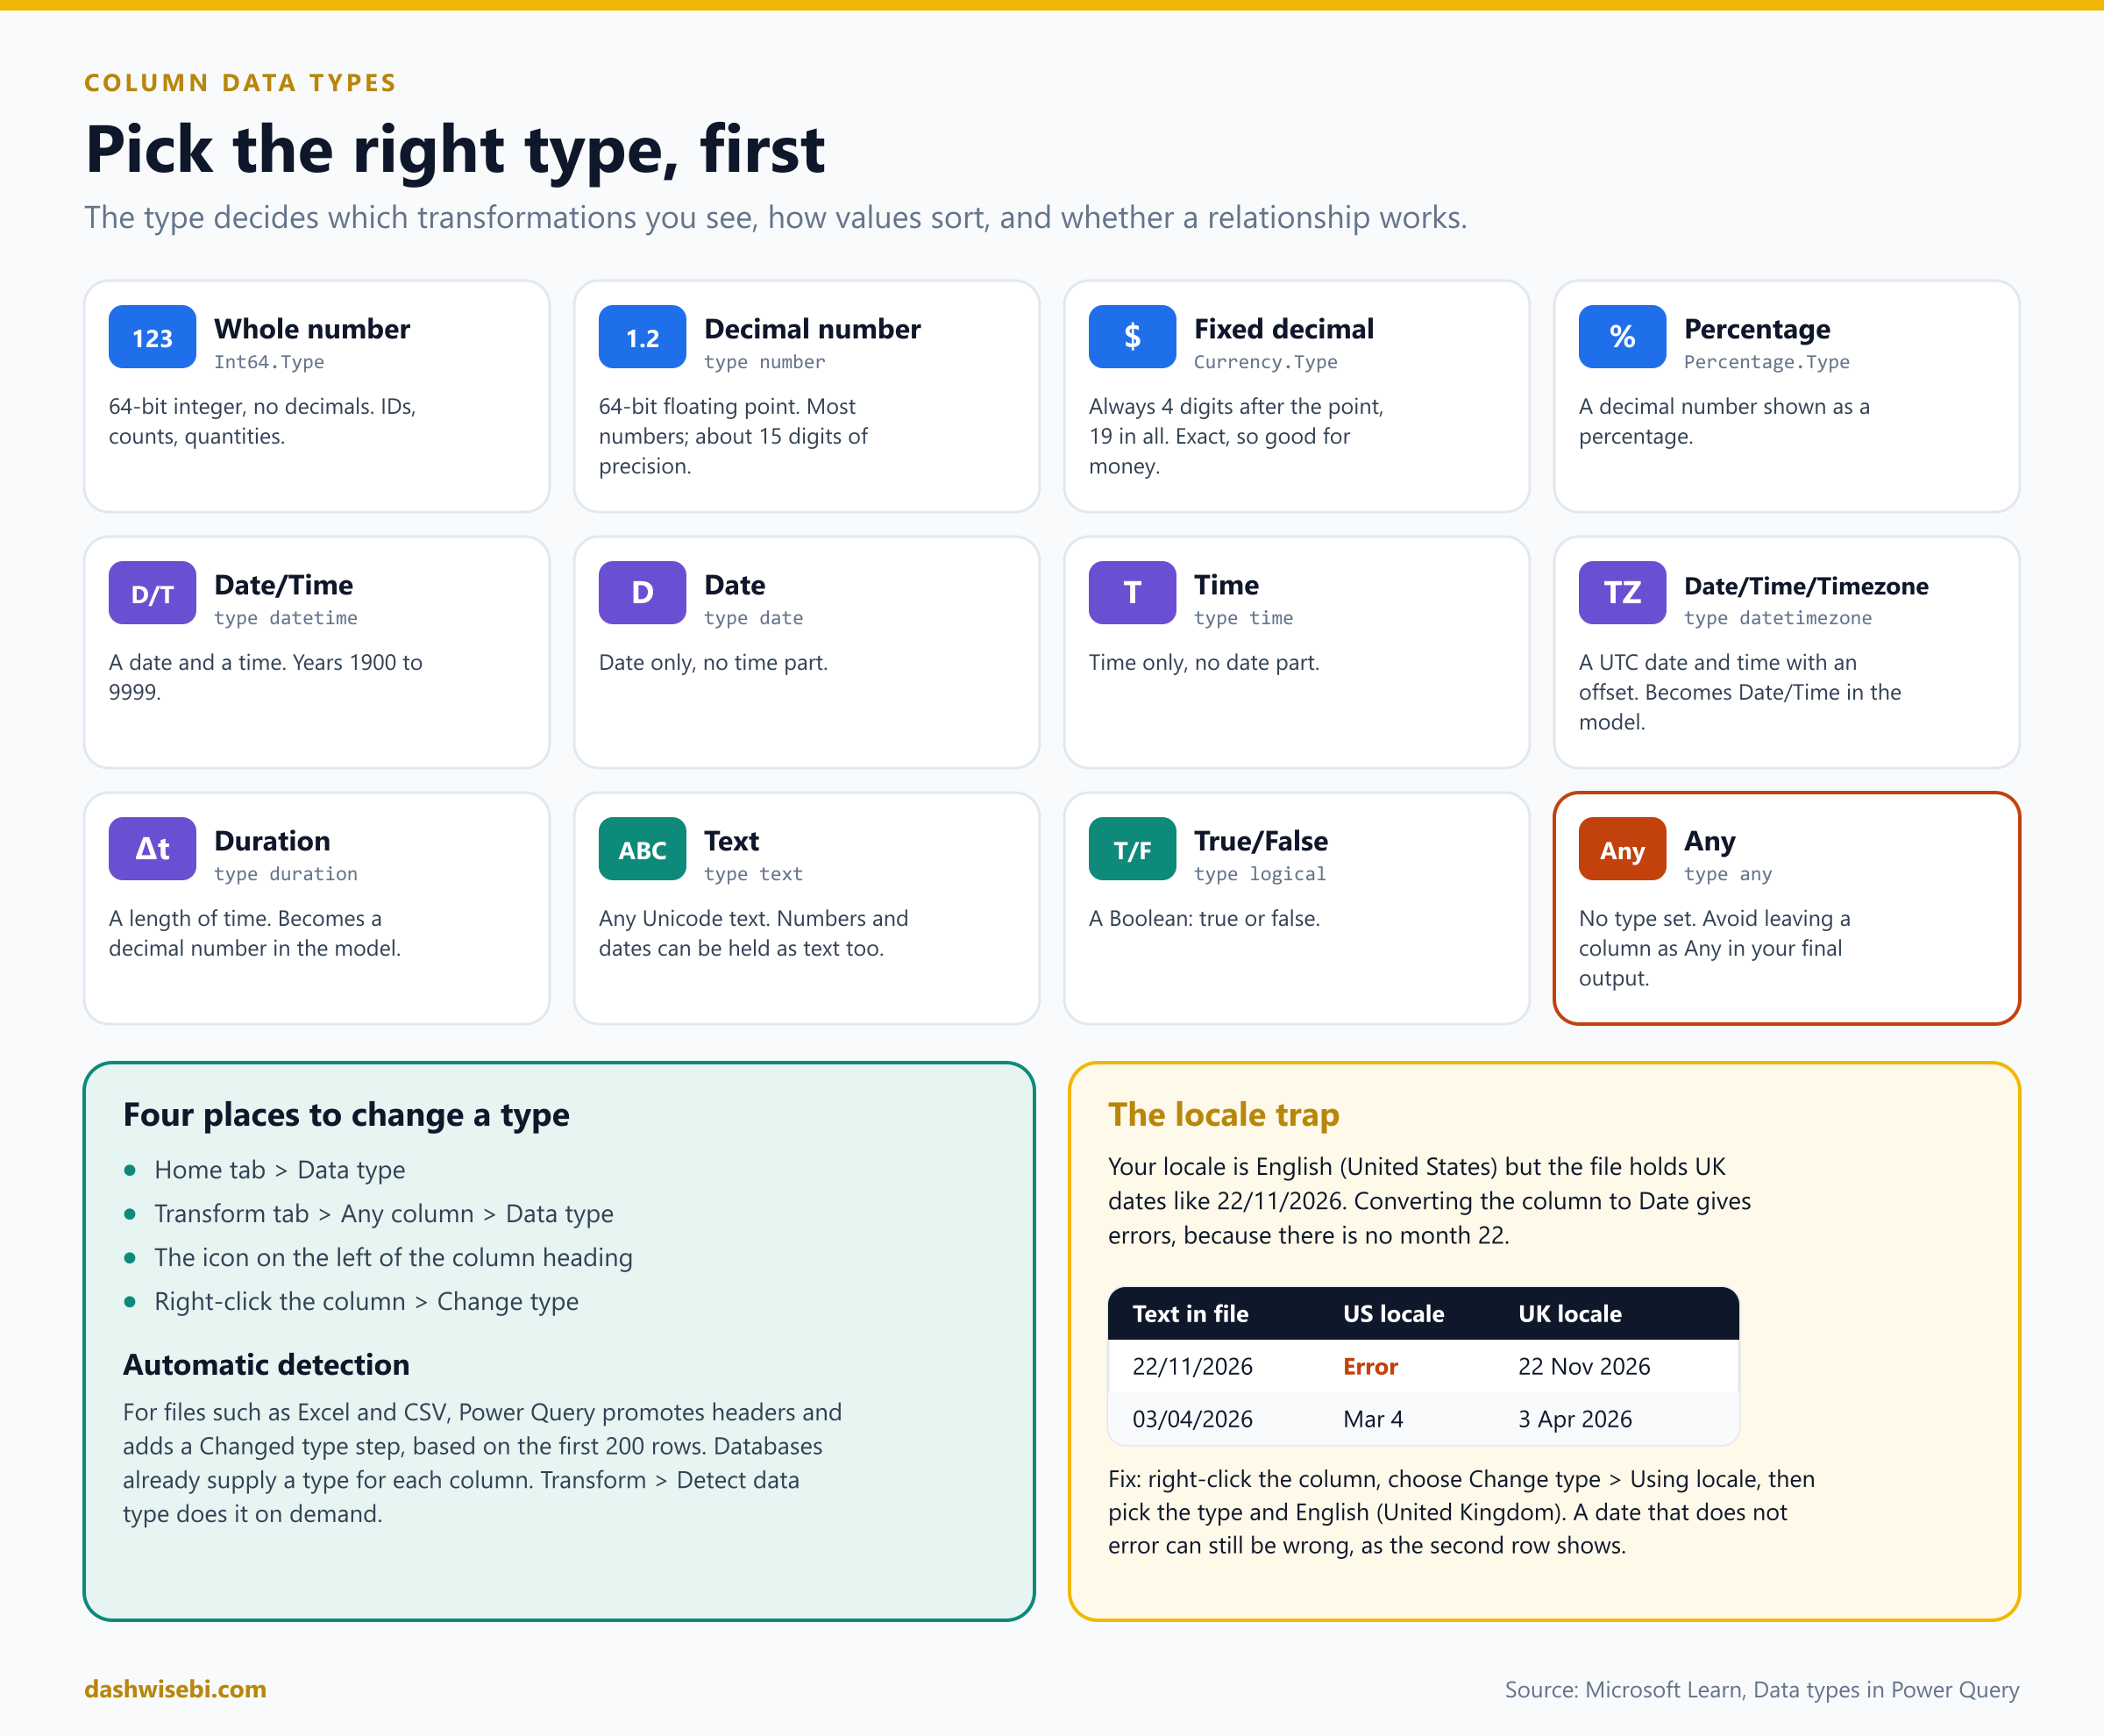
Every column has a data type, and it quietly controls three things: which transformations you are offered, how values sort, and whether a relationship will work. A number stored as text sorts as 1, 10, 2. A date stored as text cannot be used in a time intelligence calculation.
How to set a type
- Select the column.
- On the Home tab choose Data type, or use the icon on the left of the column heading, or right-click the column and choose Change type.
- Pick the type. Power Query adds a Changed type step to Applied steps.
For files such as Excel and CSV, Power Query detects the types for you when the file loads, based on the first 200 rows. Databases already supply a type for each column. If you want to run the detection again later, use Transform > Detect data type.
Which numeric type?
- Whole number for IDs and counts.
- Decimal number for most measurements.
- Fixed decimal number for money. It always keeps four digits after the point, so it avoids the tiny rounding errors of a plain decimal.
The locale trap
The file says 22/11/2026. Your Power BI Desktop is set to English (United States). Convert the column to Date and every row shows an error, because there is no month 22. Worse, 03/04/2026 converts without any error and quietly becomes March 4 instead of 3 April.
The fix is to right-click the column, choose Change type > Using locale, pick Date and set the locale to English (United Kingdom). In the exam, a question about dates that give errors or swap day and month is almost always asking for this.
2. Create and transform columns
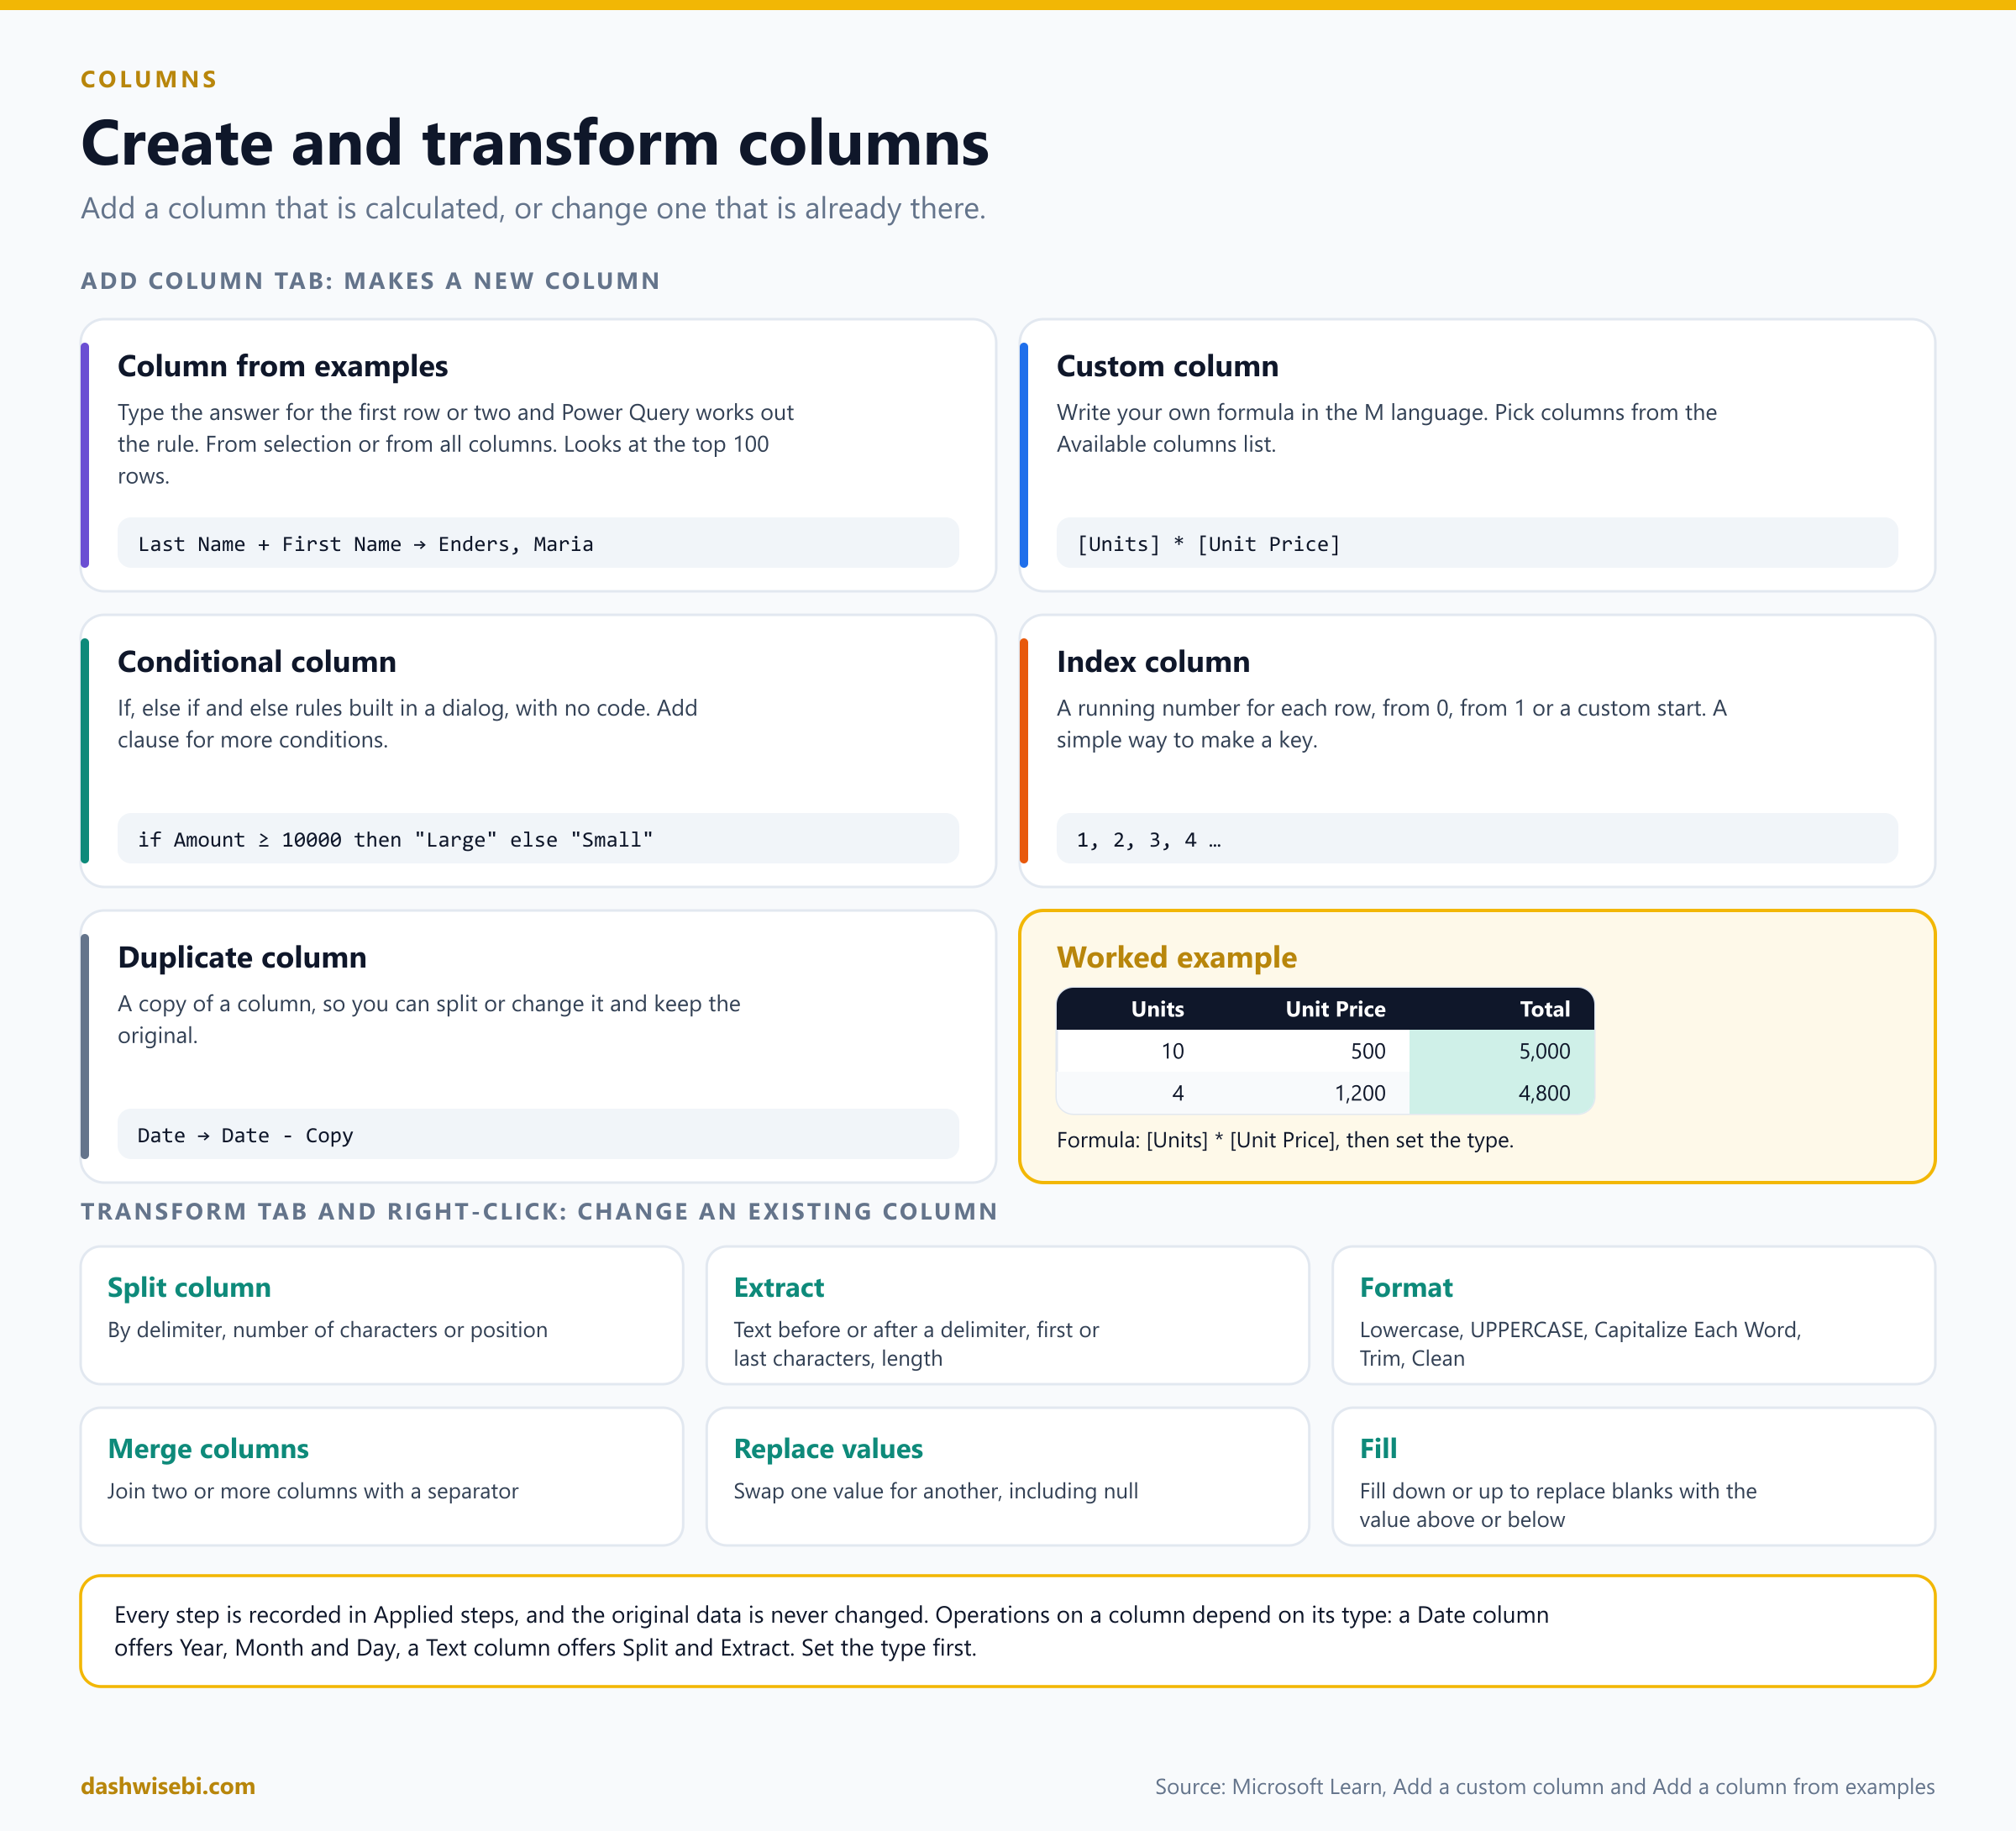
There are two families of column tools. The Add Column tab makes a new column and leaves the old ones alone. The Transform tab (and the right-click menu) changes a column that already exists.
Add Column
- Column from examples: type the result you want for the first row or two, and Power Query works out the rule. It reads the top 100 rows, and you can base it on a selection or on all columns. Use it for things like joining a last name and a first name as "Enders, Maria".
- Custom column: write a formula in the M language, picking columns from the Available columns list. For example
[Units] * [Unit Price]. - Conditional column: build if, else if and else rules in a dialog, with no code. Choose Add Clause for more conditions. The else value can be a value or another column.
- Index column: a running number for each row, starting at 0, 1 or a number you choose. It is a quick way to create a key.
- Duplicate column: a copy you can split or change while keeping the original.
Heads up: a new custom or conditional column does not get a data type automatically. Set it yourself straight after you create it.
Transform
- Split column: by delimiter, number of characters or position.
- Extract: text before or after a delimiter, first or last characters, or length.
- Format: lowercase, UPPERCASE, Capitalize Each Word, Trim and Clean. Trim and Clean matter a lot before a merge, because "Pune " with a trailing space is not the same value as "Pune".
- Replace values and Fill down or up, to swap values and to fill blanks from the row above or below.
Remember that the options depend on the type. A Date column offers Year, Month and Day. A Text column offers Split and Extract. That is one more reason to set the type first.
3. Reshape the rows
Sometimes the data is right but the shape is wrong. Four tools change the shape. The picture below uses tiny tables so you can see what each one does before we go through the real screenshots.
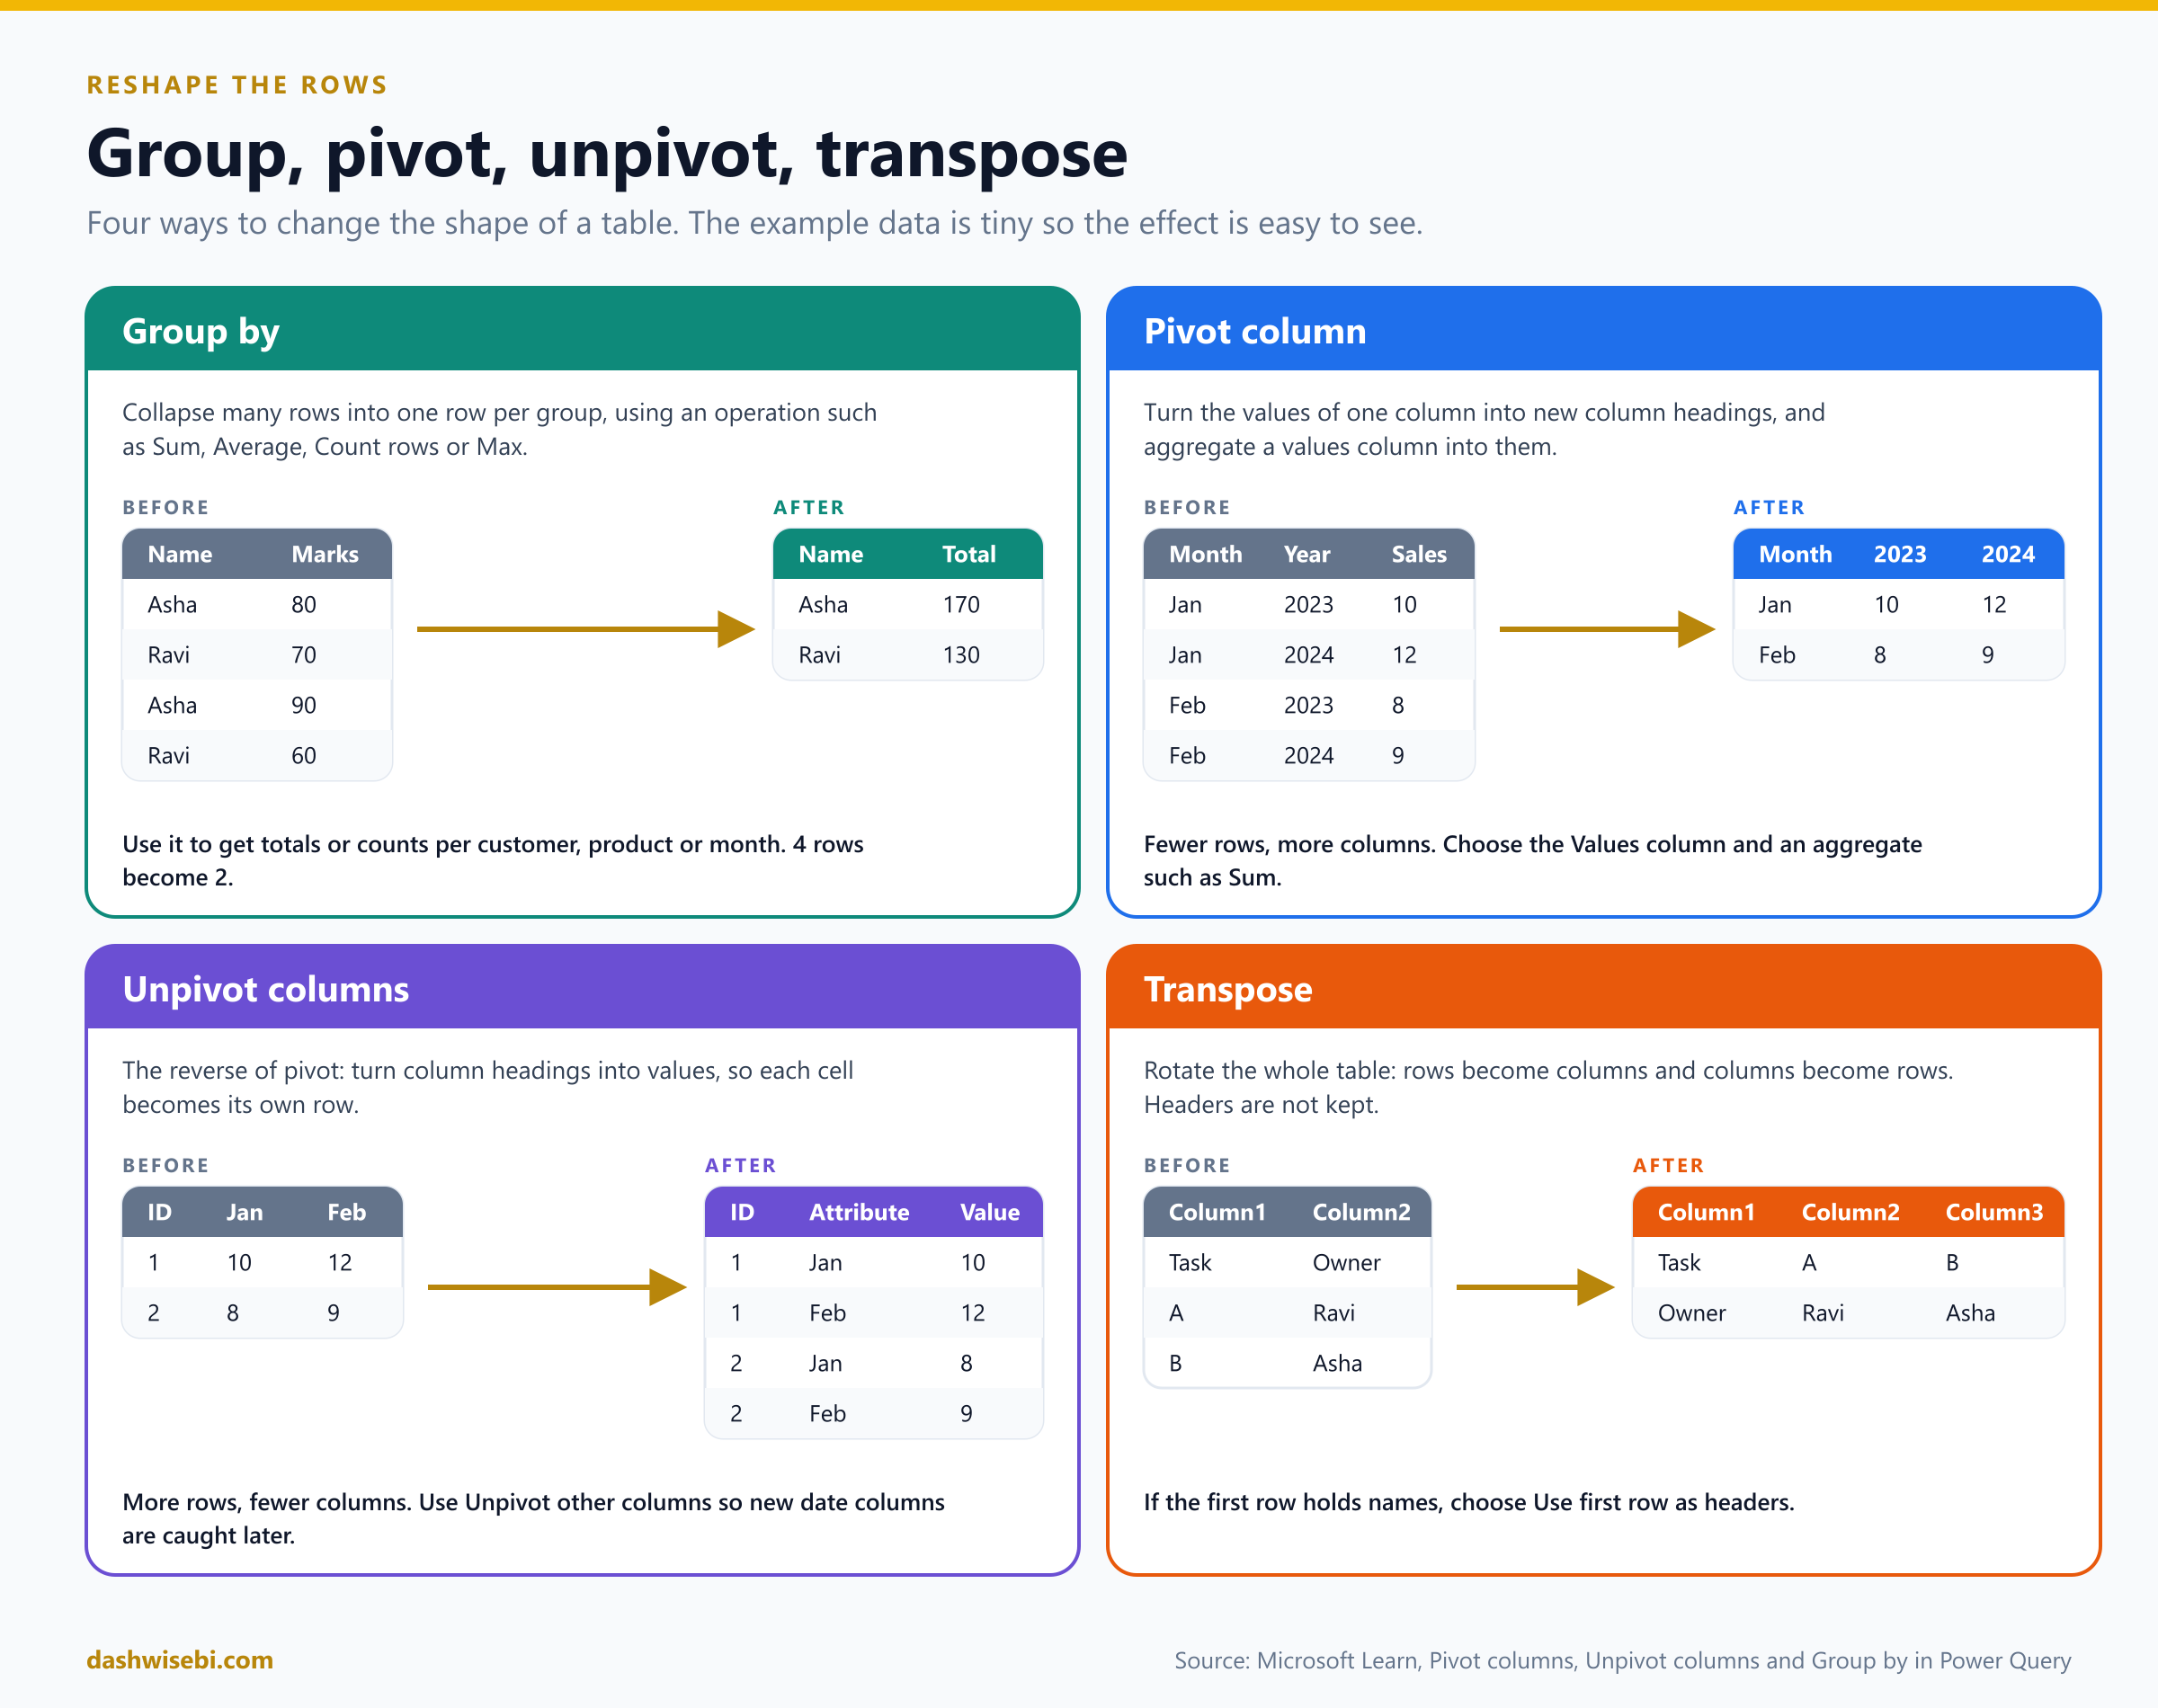
Group by and aggregate
Group by collapses many rows into one row per group. Think of it as a pivot table in miniature. In our demo the Student_marks table has 15 rows, with several marks for each student. We want one row per student with the total.
- Open the query and choose Transform > Group by.
- Group by Name.
- Give the new column a name, such as Totalmarks, choose the operation Sum and the column Marks.
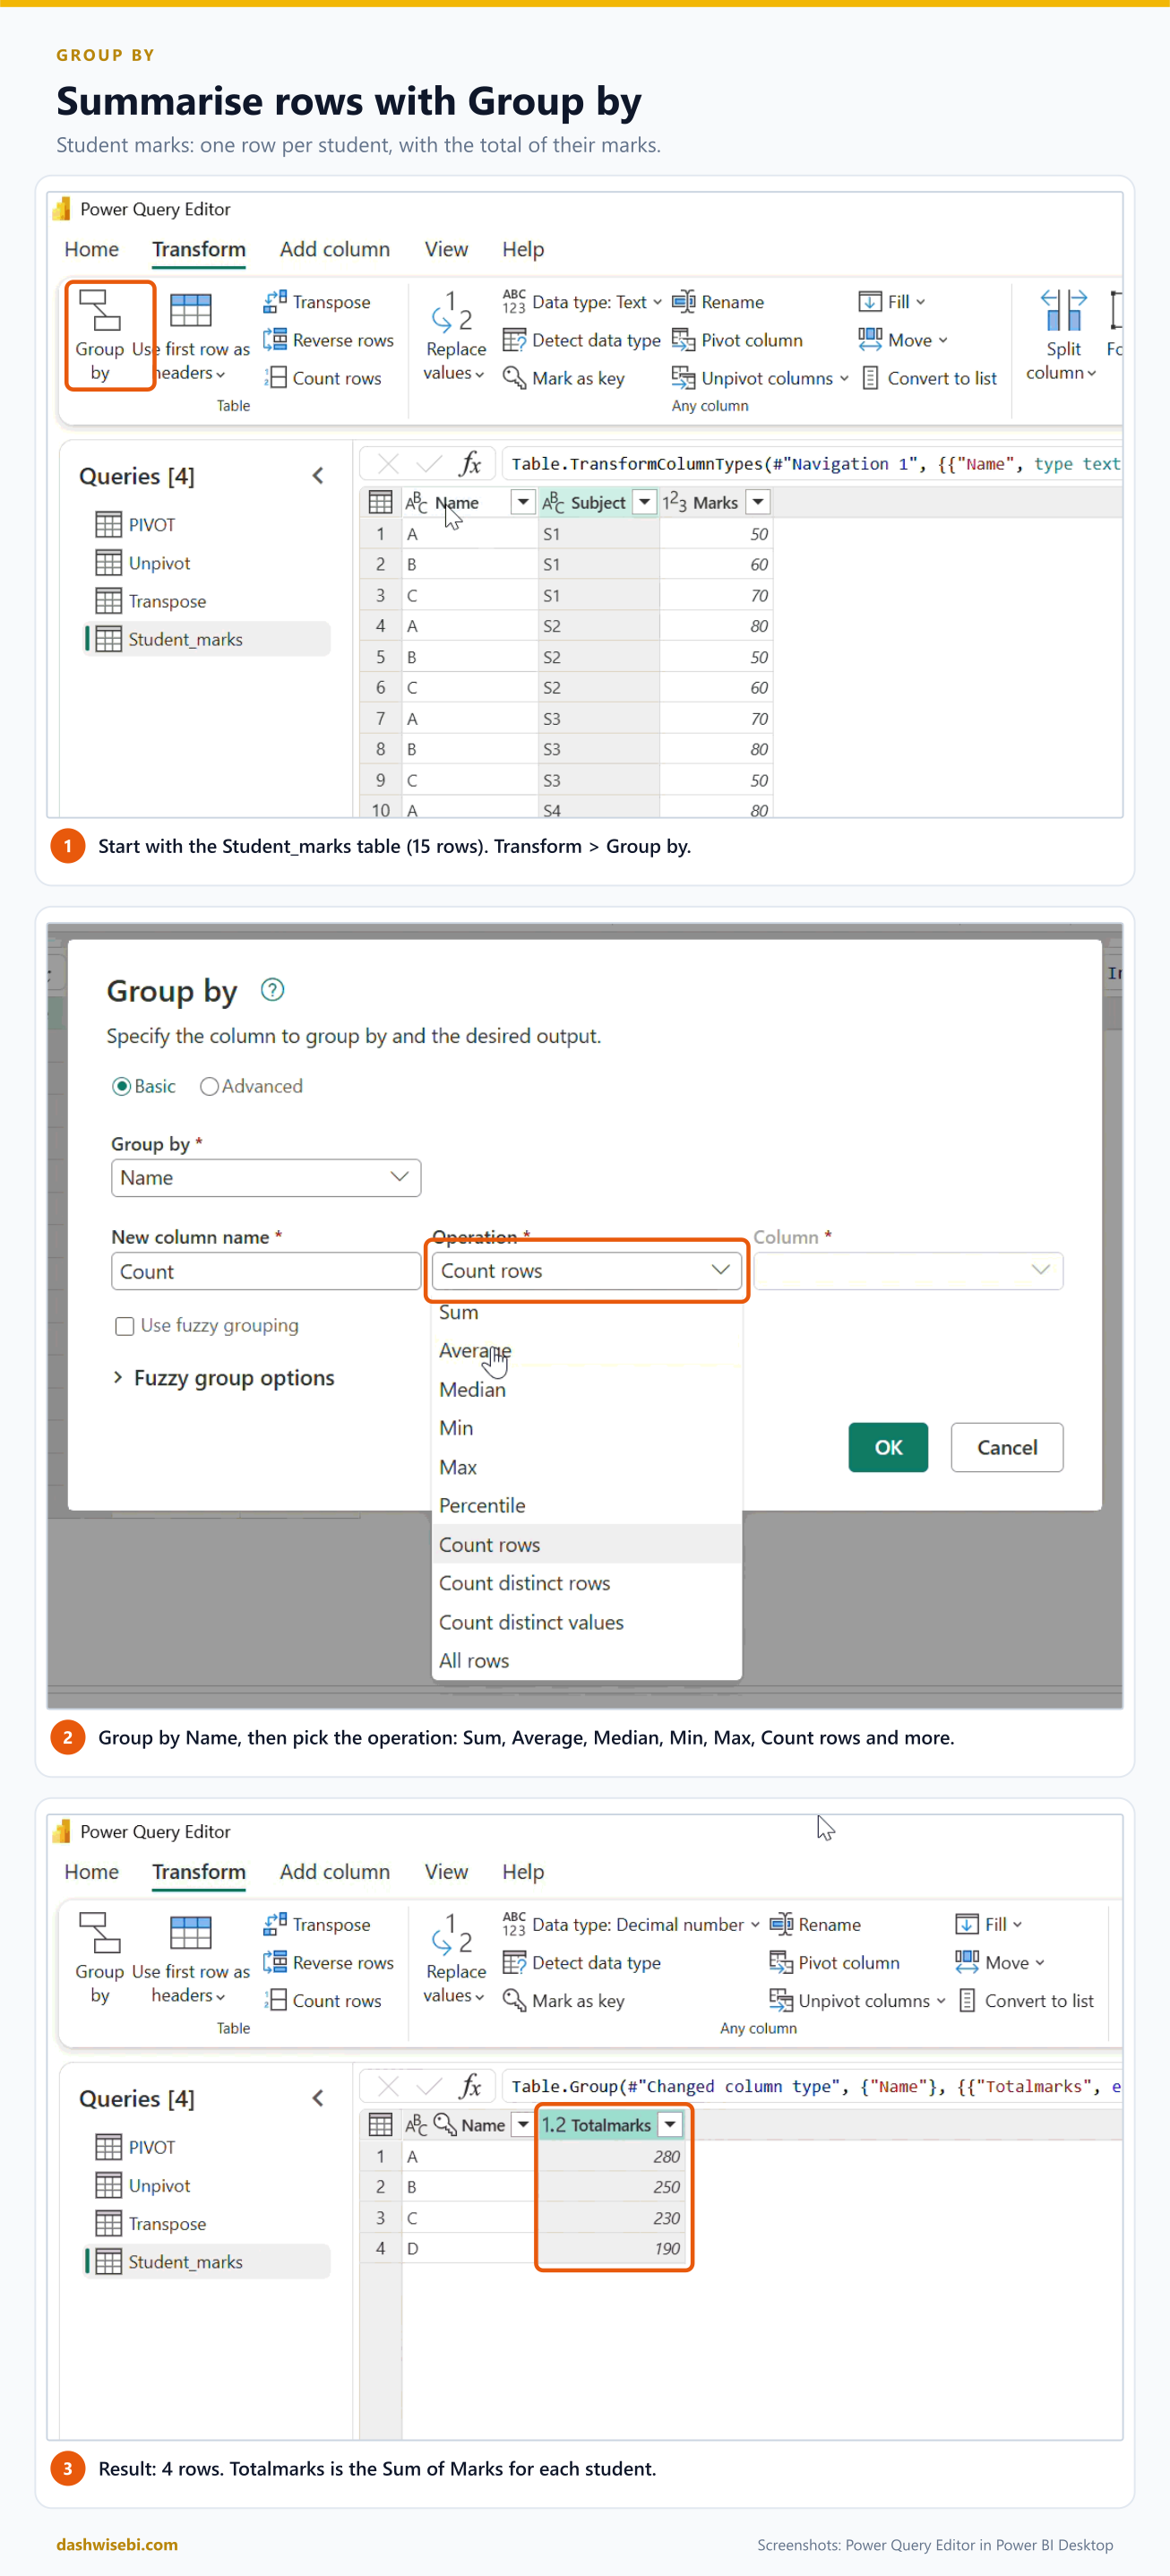
The result has four rows. The other operations are Average, Median, Min, Max, Count rows, Count distinct rows and All rows. Choose Advanced to group by more than one column or to add several aggregations at once, such as the total and the count together.
Pivot: values become columns
Our second demo has a Month column, a Year column and Sales. We want one row per month and one column per year, so the years can sit side by side.
- Select the Year column.
- Choose Transform > Pivot column.
- Set Values column to Sales.
- Under Advanced options set the Aggregate value function to Sum.
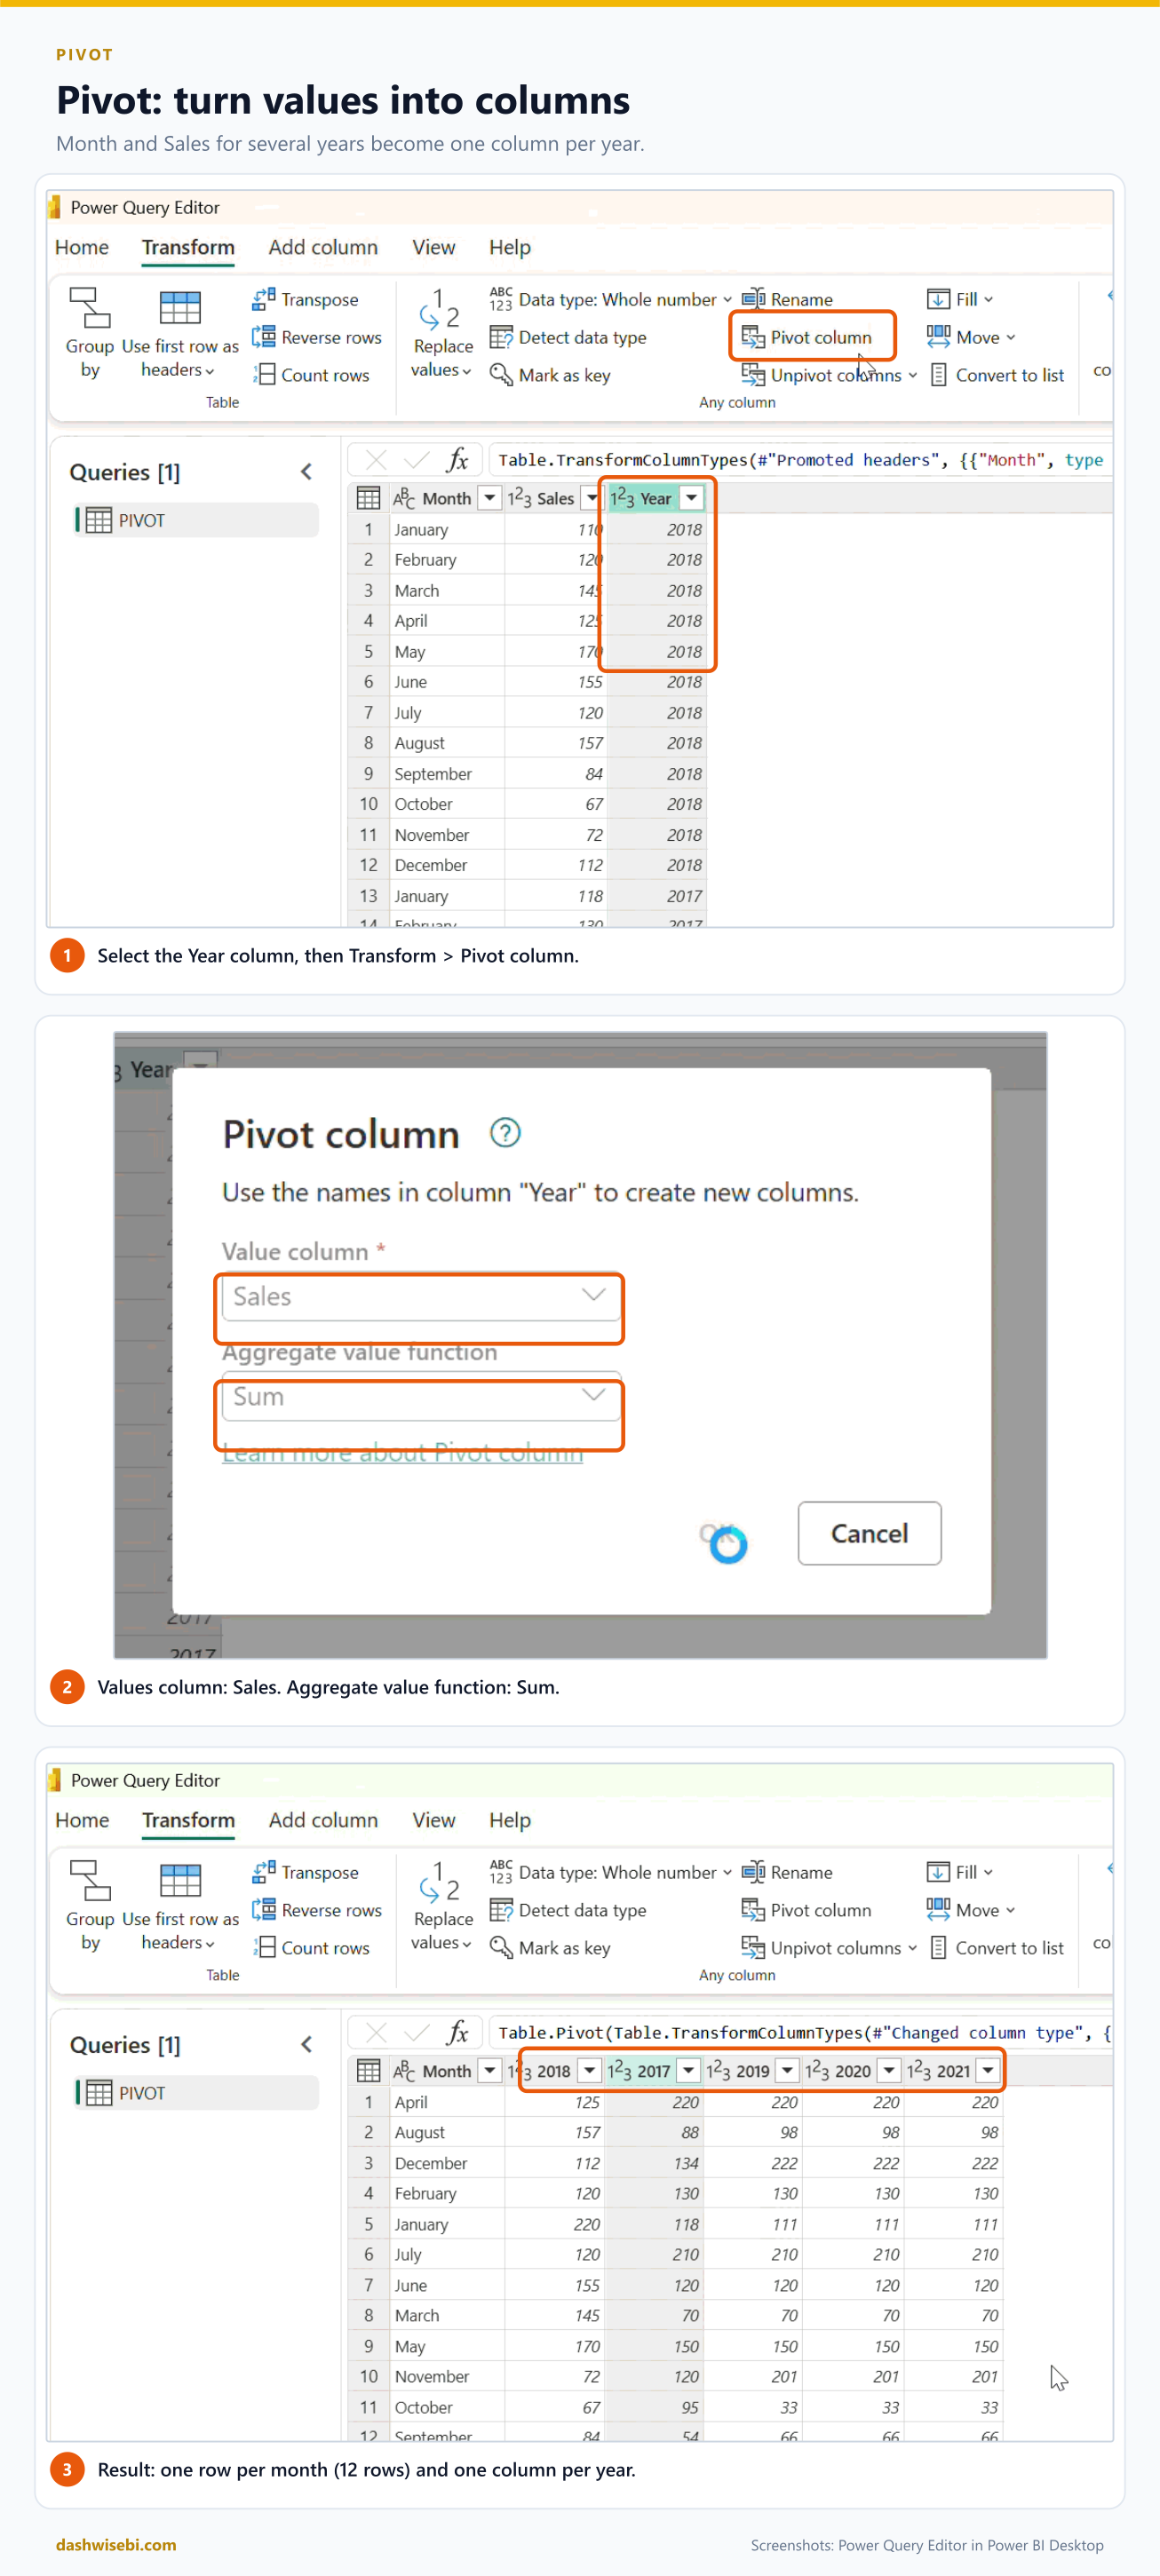
The result has 12 rows, one per month, and a column for each year. The aggregate matters. If a month and year pair appears more than once and you choose Don't aggregate, Power Query reports an error. The choices are Don't aggregate, Count (all), Count (not blank), Minimum, Maximum, Median, Sum and Average.
When should you pivot? Rarely, for Power BI models. Charts and DAX prefer long, narrow tables. Pivot is useful for a report-style layout or to spread an attribute into columns.
Unpivot: columns become rows
This is the one you will use most. Spreadsheets love wide layouts, with one column per date. Power BI hates them, because you cannot put "date" on a chart axis when the dates are column names.
In our demo the table has an ID column and 24 date columns, so 25 columns in all. We want ID, Date and Value.
- Select the ID column.
- Choose Transform > Unpivot columns > Unpivot other columns.
- Rename Attribute to something meaningful, such as Date, and Value to match what it holds.
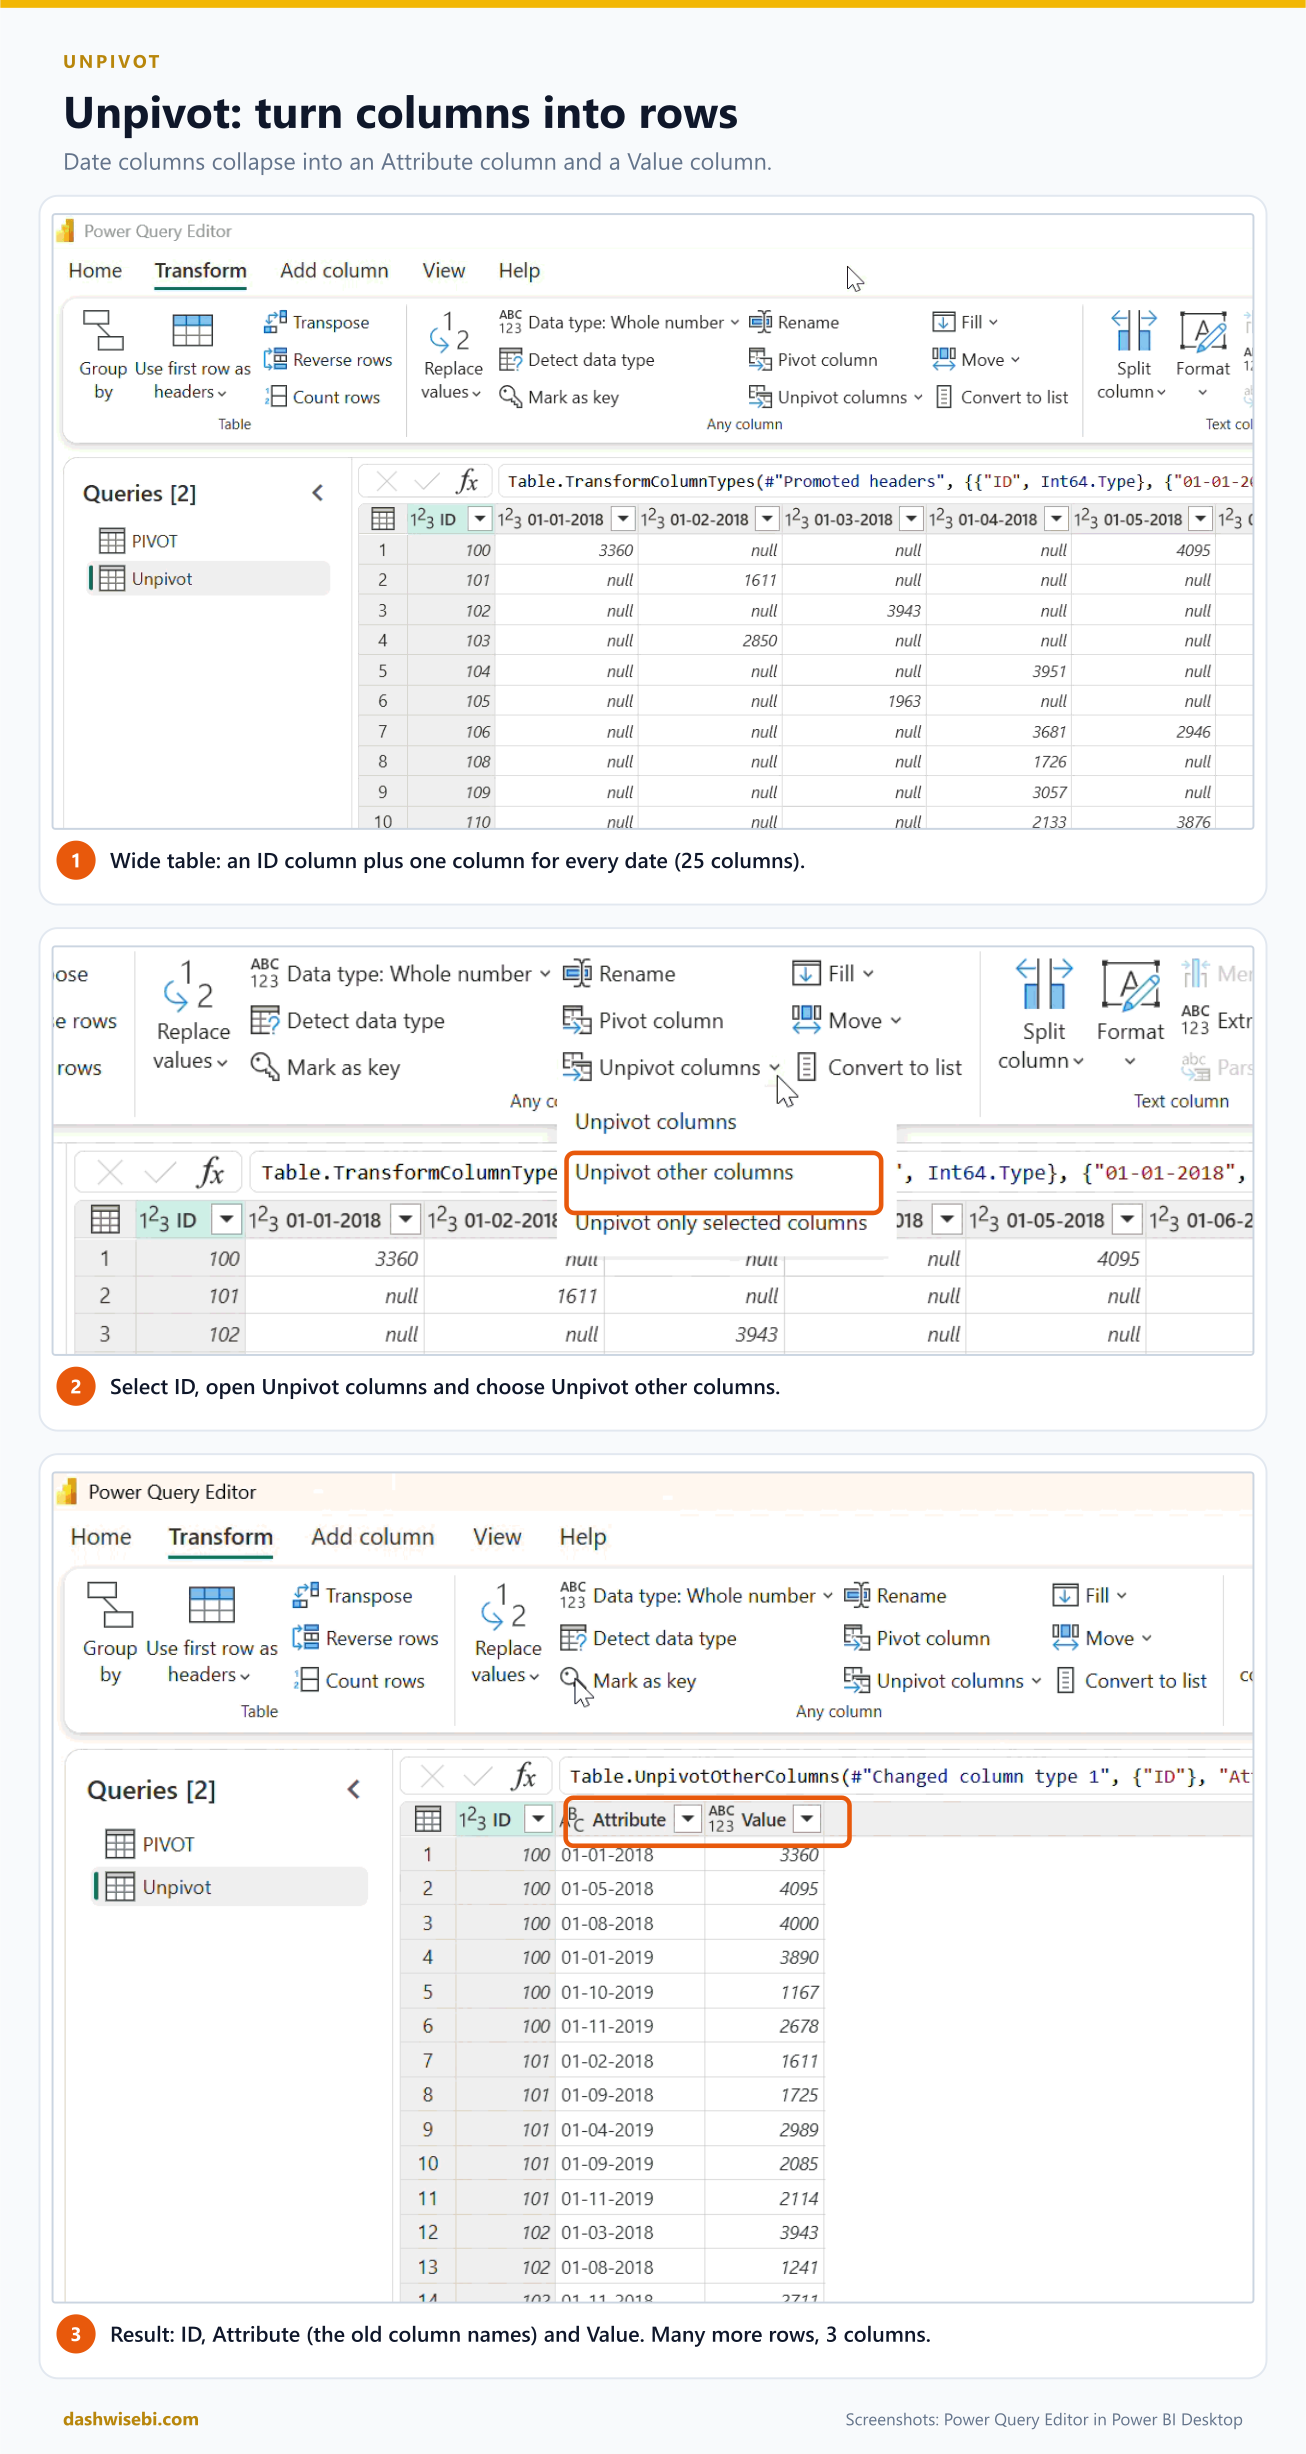
There are three commands, and the difference is worth knowing for the exam:
- Unpivot columns unpivots the columns you selected.
- Unpivot other columns unpivots everything except what you selected. Choose this when new columns will keep arriving, such as a new month each month. They are picked up automatically at the next refresh.
- Unpivot only selected columns unpivots just those columns, and a column added later is left alone.
Transpose: rotate the table
Transpose swaps rows and columns. Our task list has 3 columns and 26 rows. After Transform > Transpose it has 26 columns and 3 rows.
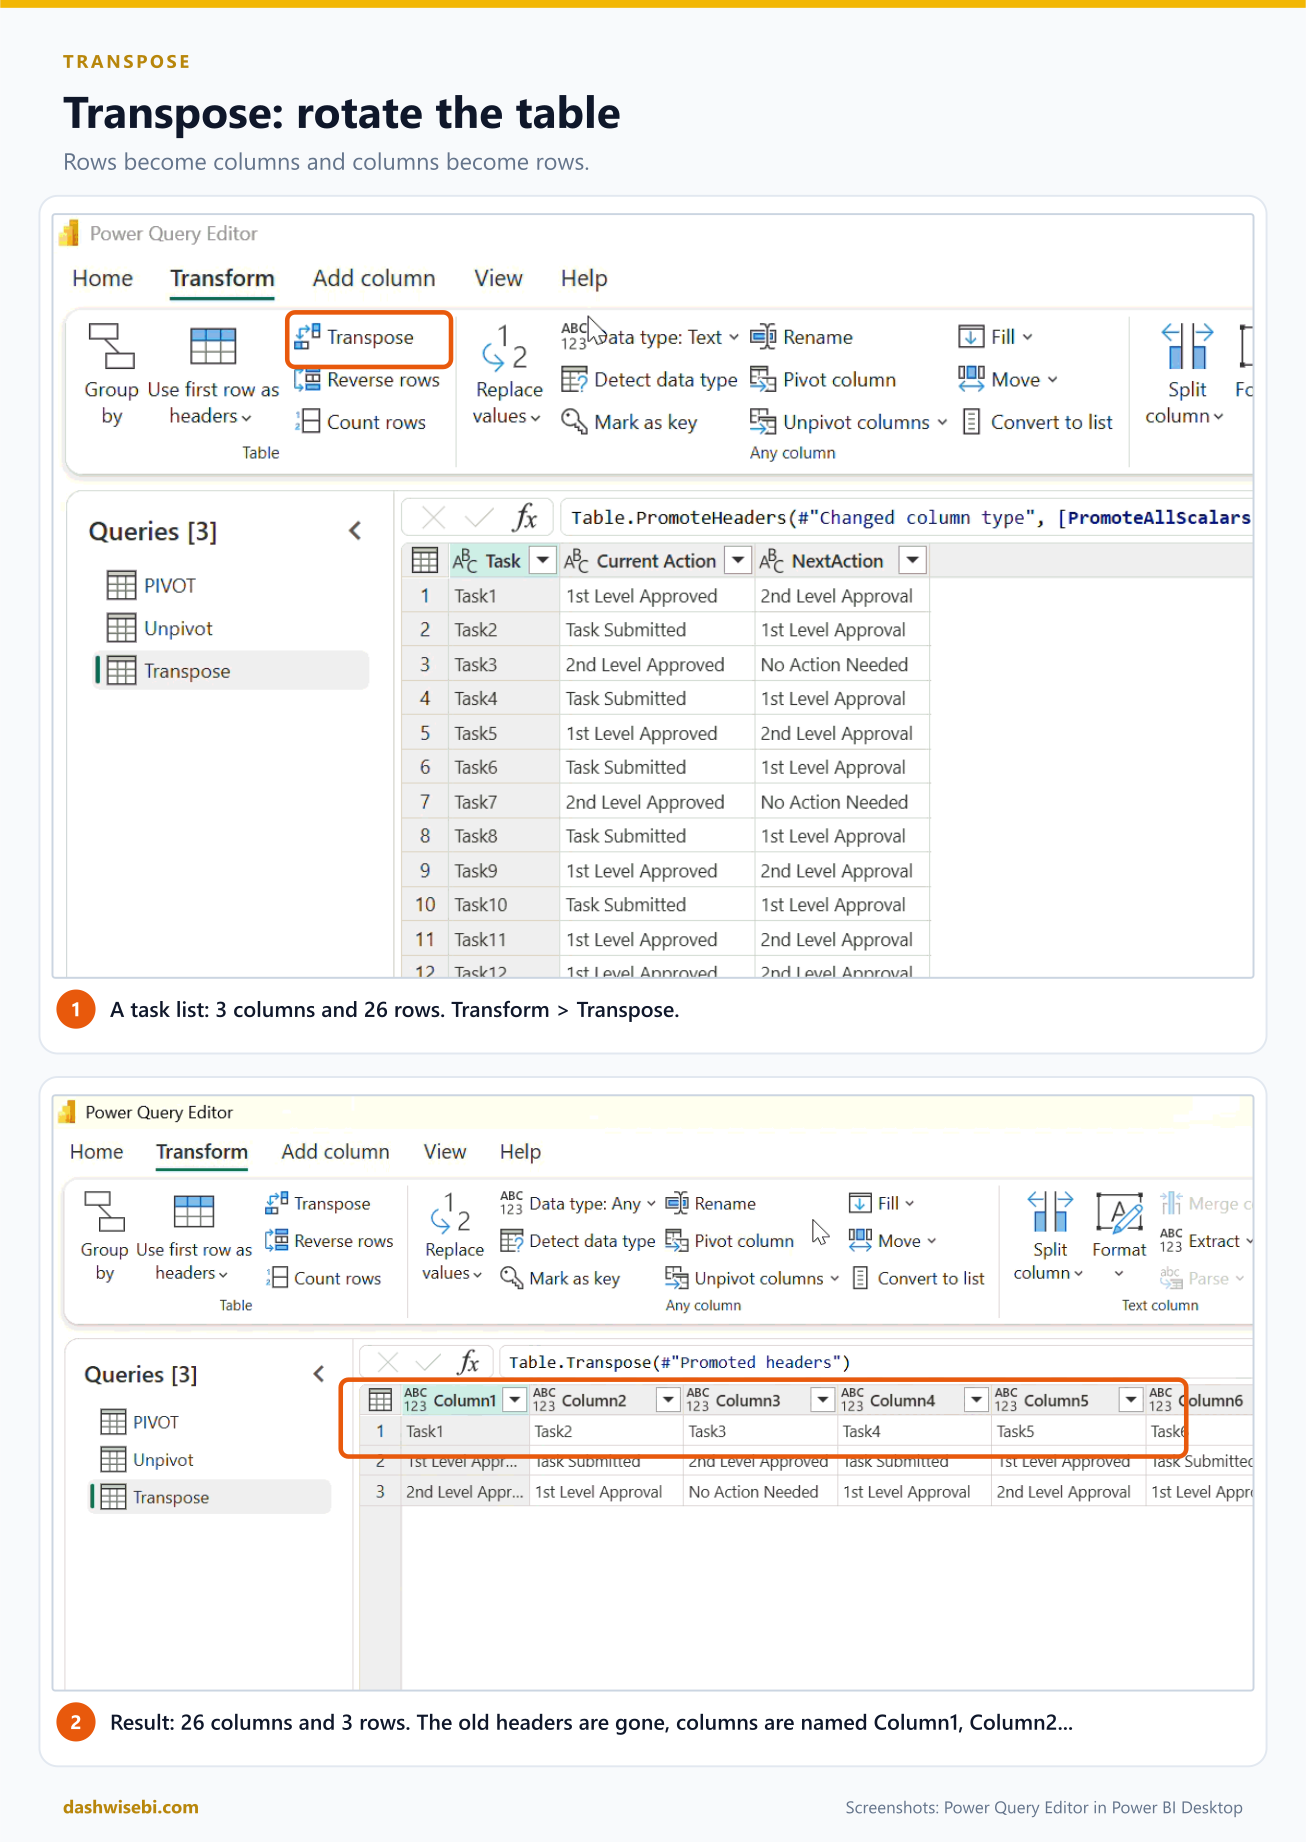
Notice what happened to the headers. They are gone, and the columns are called Column1, Column2 and so on. Two follow-up steps are usual: Use first row as headers if the first row holds names, and Detect data type, because transposing can leave every column as text or any. Transpose is the least common of the four. Reach for it when a source file has its fields down the side instead of across the top.
4. Convert semi-structured data to a table
Not everything arrives as rows and columns. JSON files, XML and web APIs return nested data: records inside records, and lists inside records. Power Query can flatten this into a table.
Our demo file holds a list of users. Each user has five fields: userId, firstName, lastName, phoneNumber and emailAddress.
- Choose Get data, search for json and pick the JSON connector.
- Browse to the .json file and select Next (or Open).
- Power Query reads the file. If the data is a list of records, it converts the list to a table for you.
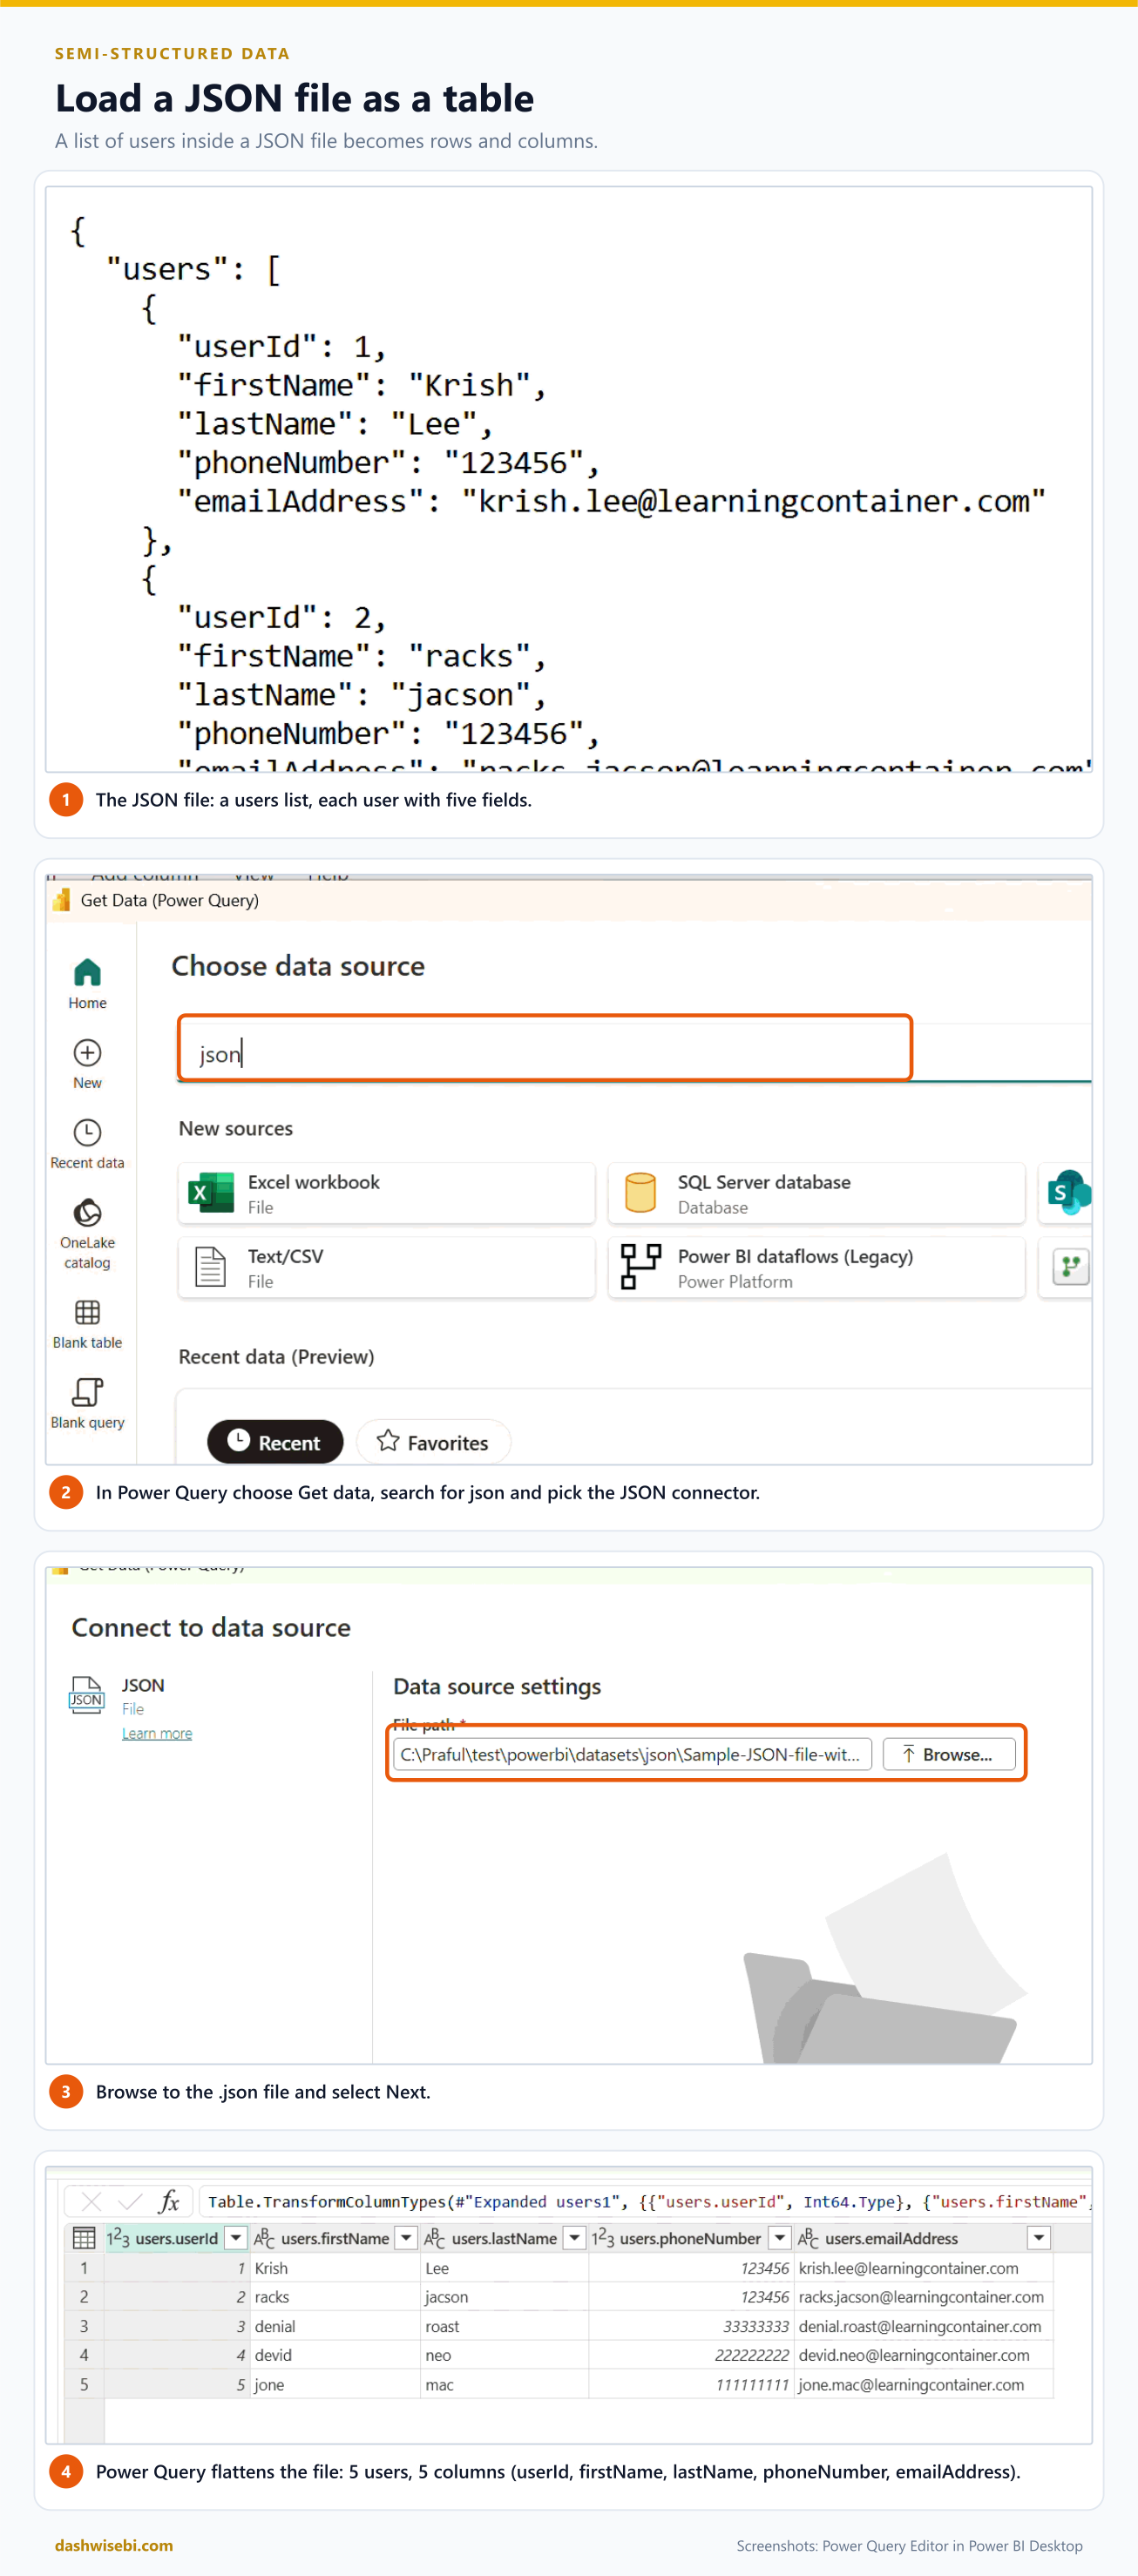
The result is a table of five users with five columns. If your file is more deeply nested, you will see cells that say Record or List. They are not errors. Use the expand arrow in the column heading to pull the fields out, or convert a list to a table with Transform > Convert to table (or Into Table). Repeat until every column holds plain values, then set the data types.
5. Combine queries: append and merge
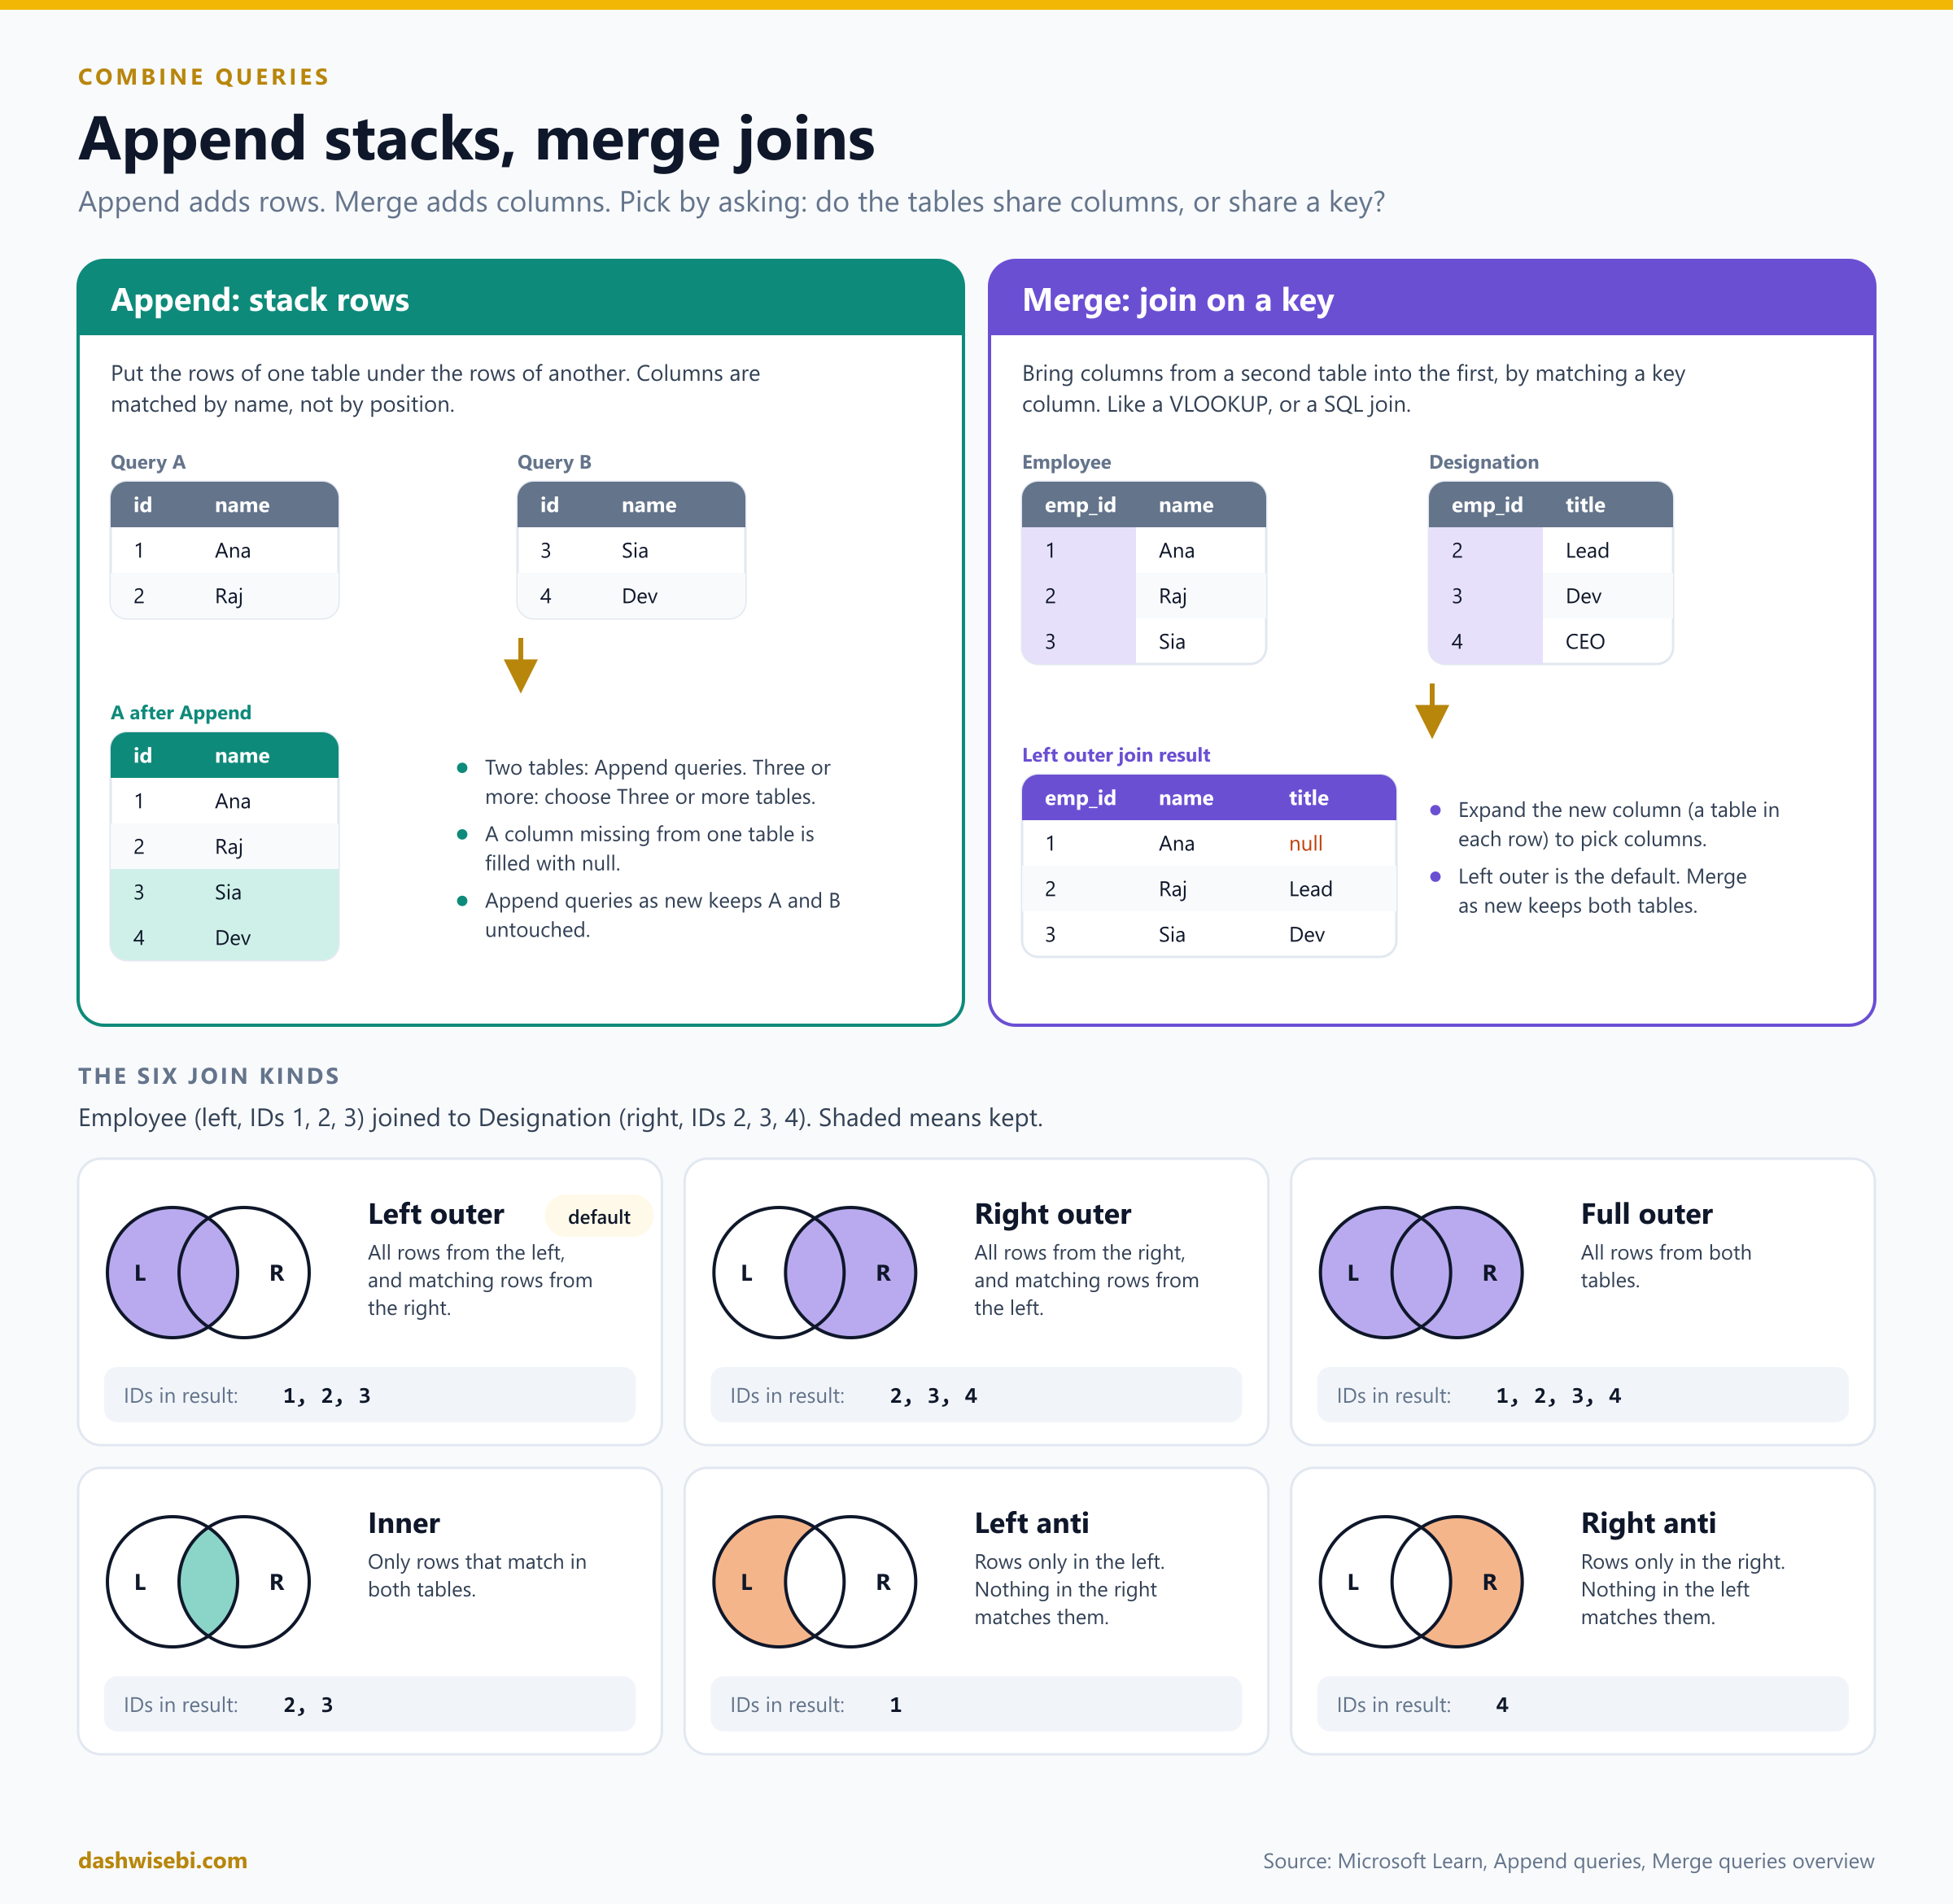
Two questions decide which tool you need. Do the tables share columns? Then append, which stacks rows. Do they share a key? Then merge, which adds columns.
Append queries
In our demo query A has 14 rows and query B has 9 rows, and both have the columns id and name. We want one table with all the rows.
- Select query A.
- Choose Home > Combine > Append queries.
- Choose Two tables, pick B as the second table, and select OK.
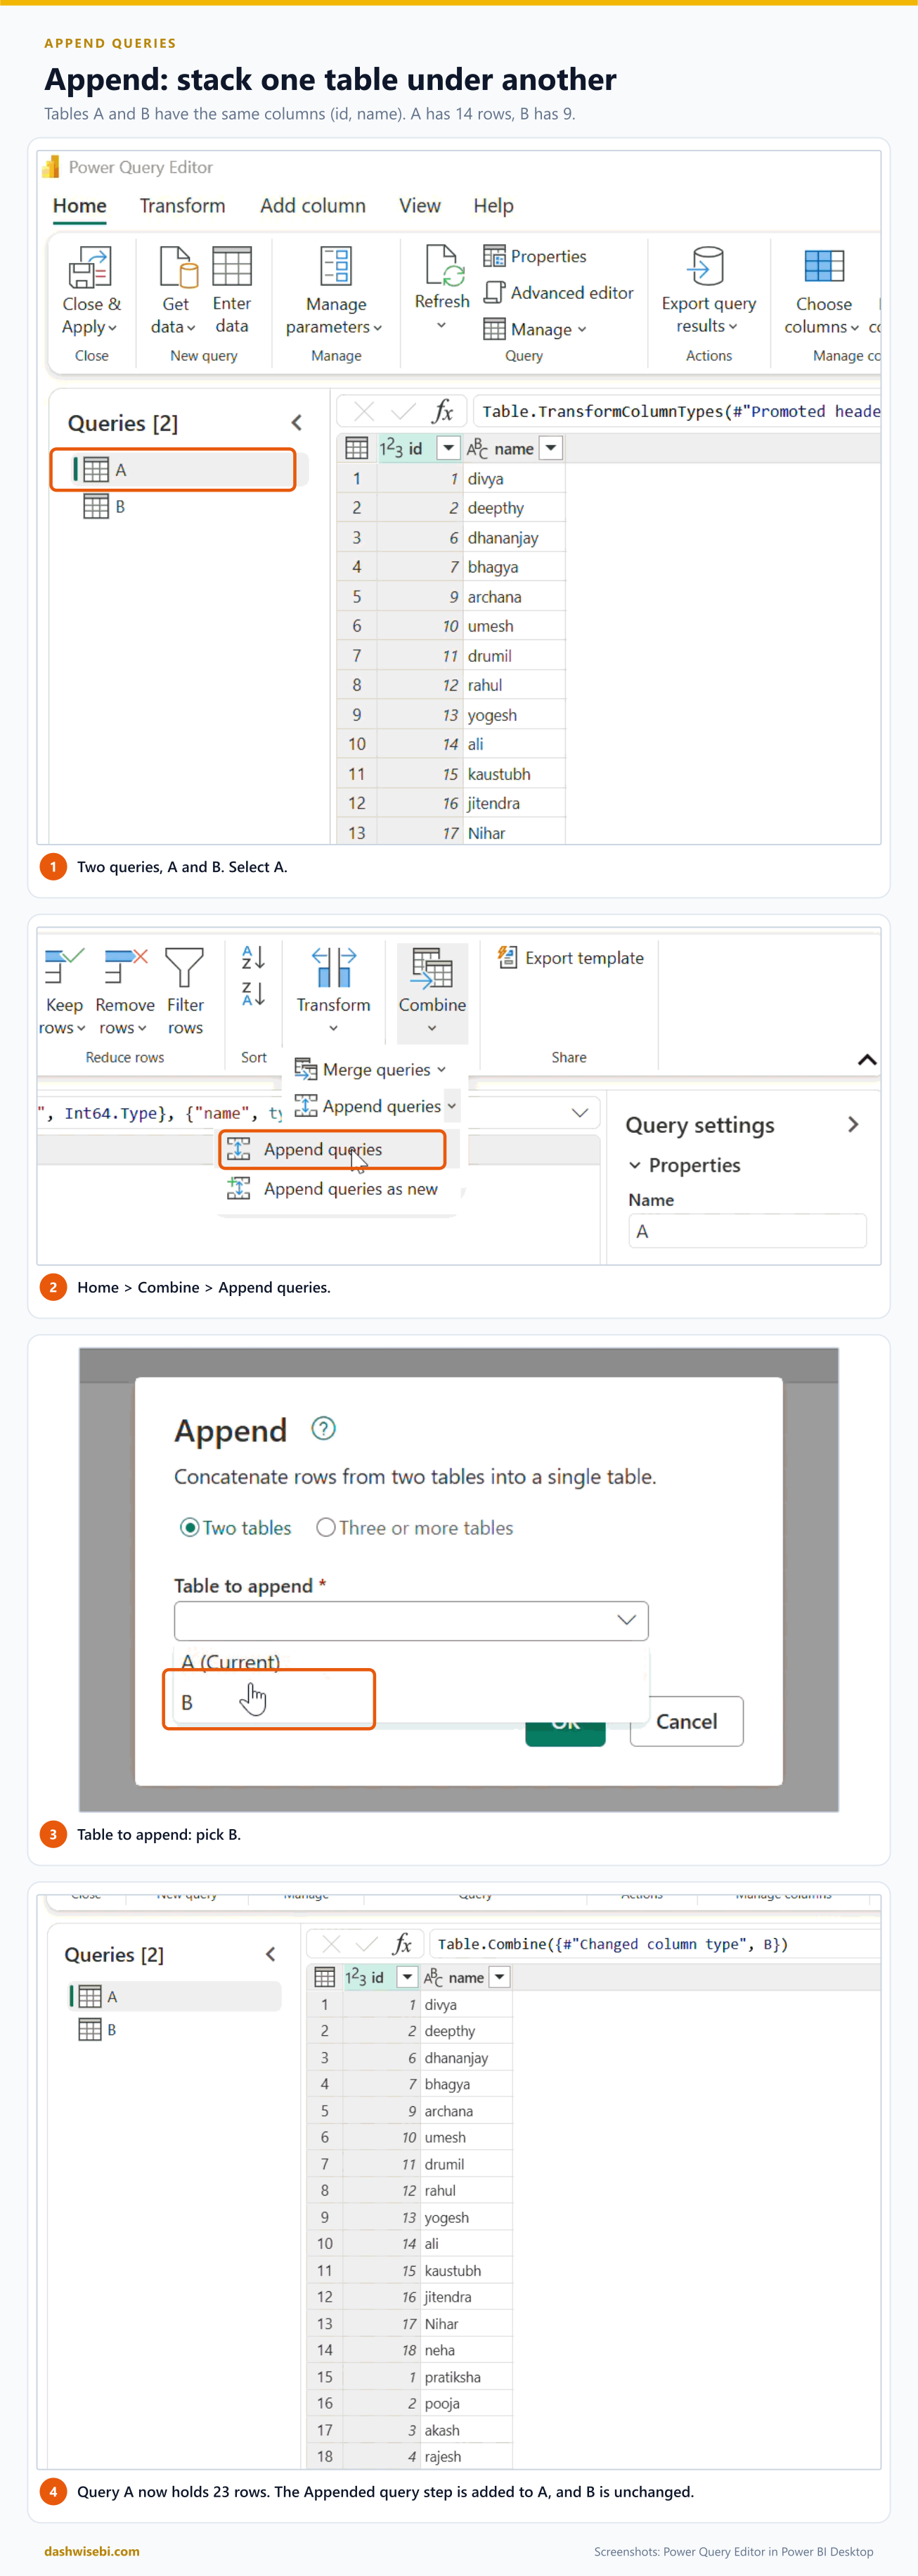
Query A now holds 23 rows (14 plus 9). An Appended query step is added to A, so A has changed and B has not. Three things to remember:
- Columns are matched by name, not by position. If B has a column that A lacks, the rows from A get null in it.
- For three or more tables, choose Three or more tables in the dialog.
- Appending does not remove duplicates. In our demo both tables contain ids 1 to 4, so the combined table has repeated ids. If id is meant to be a key, add a column that makes it unique first, or remove the duplicates.
Append queries as new
If you would rather keep A and B exactly as they were, choose Append queries as new. The dialog asks for the First table and the Second table and creates a brand new query.
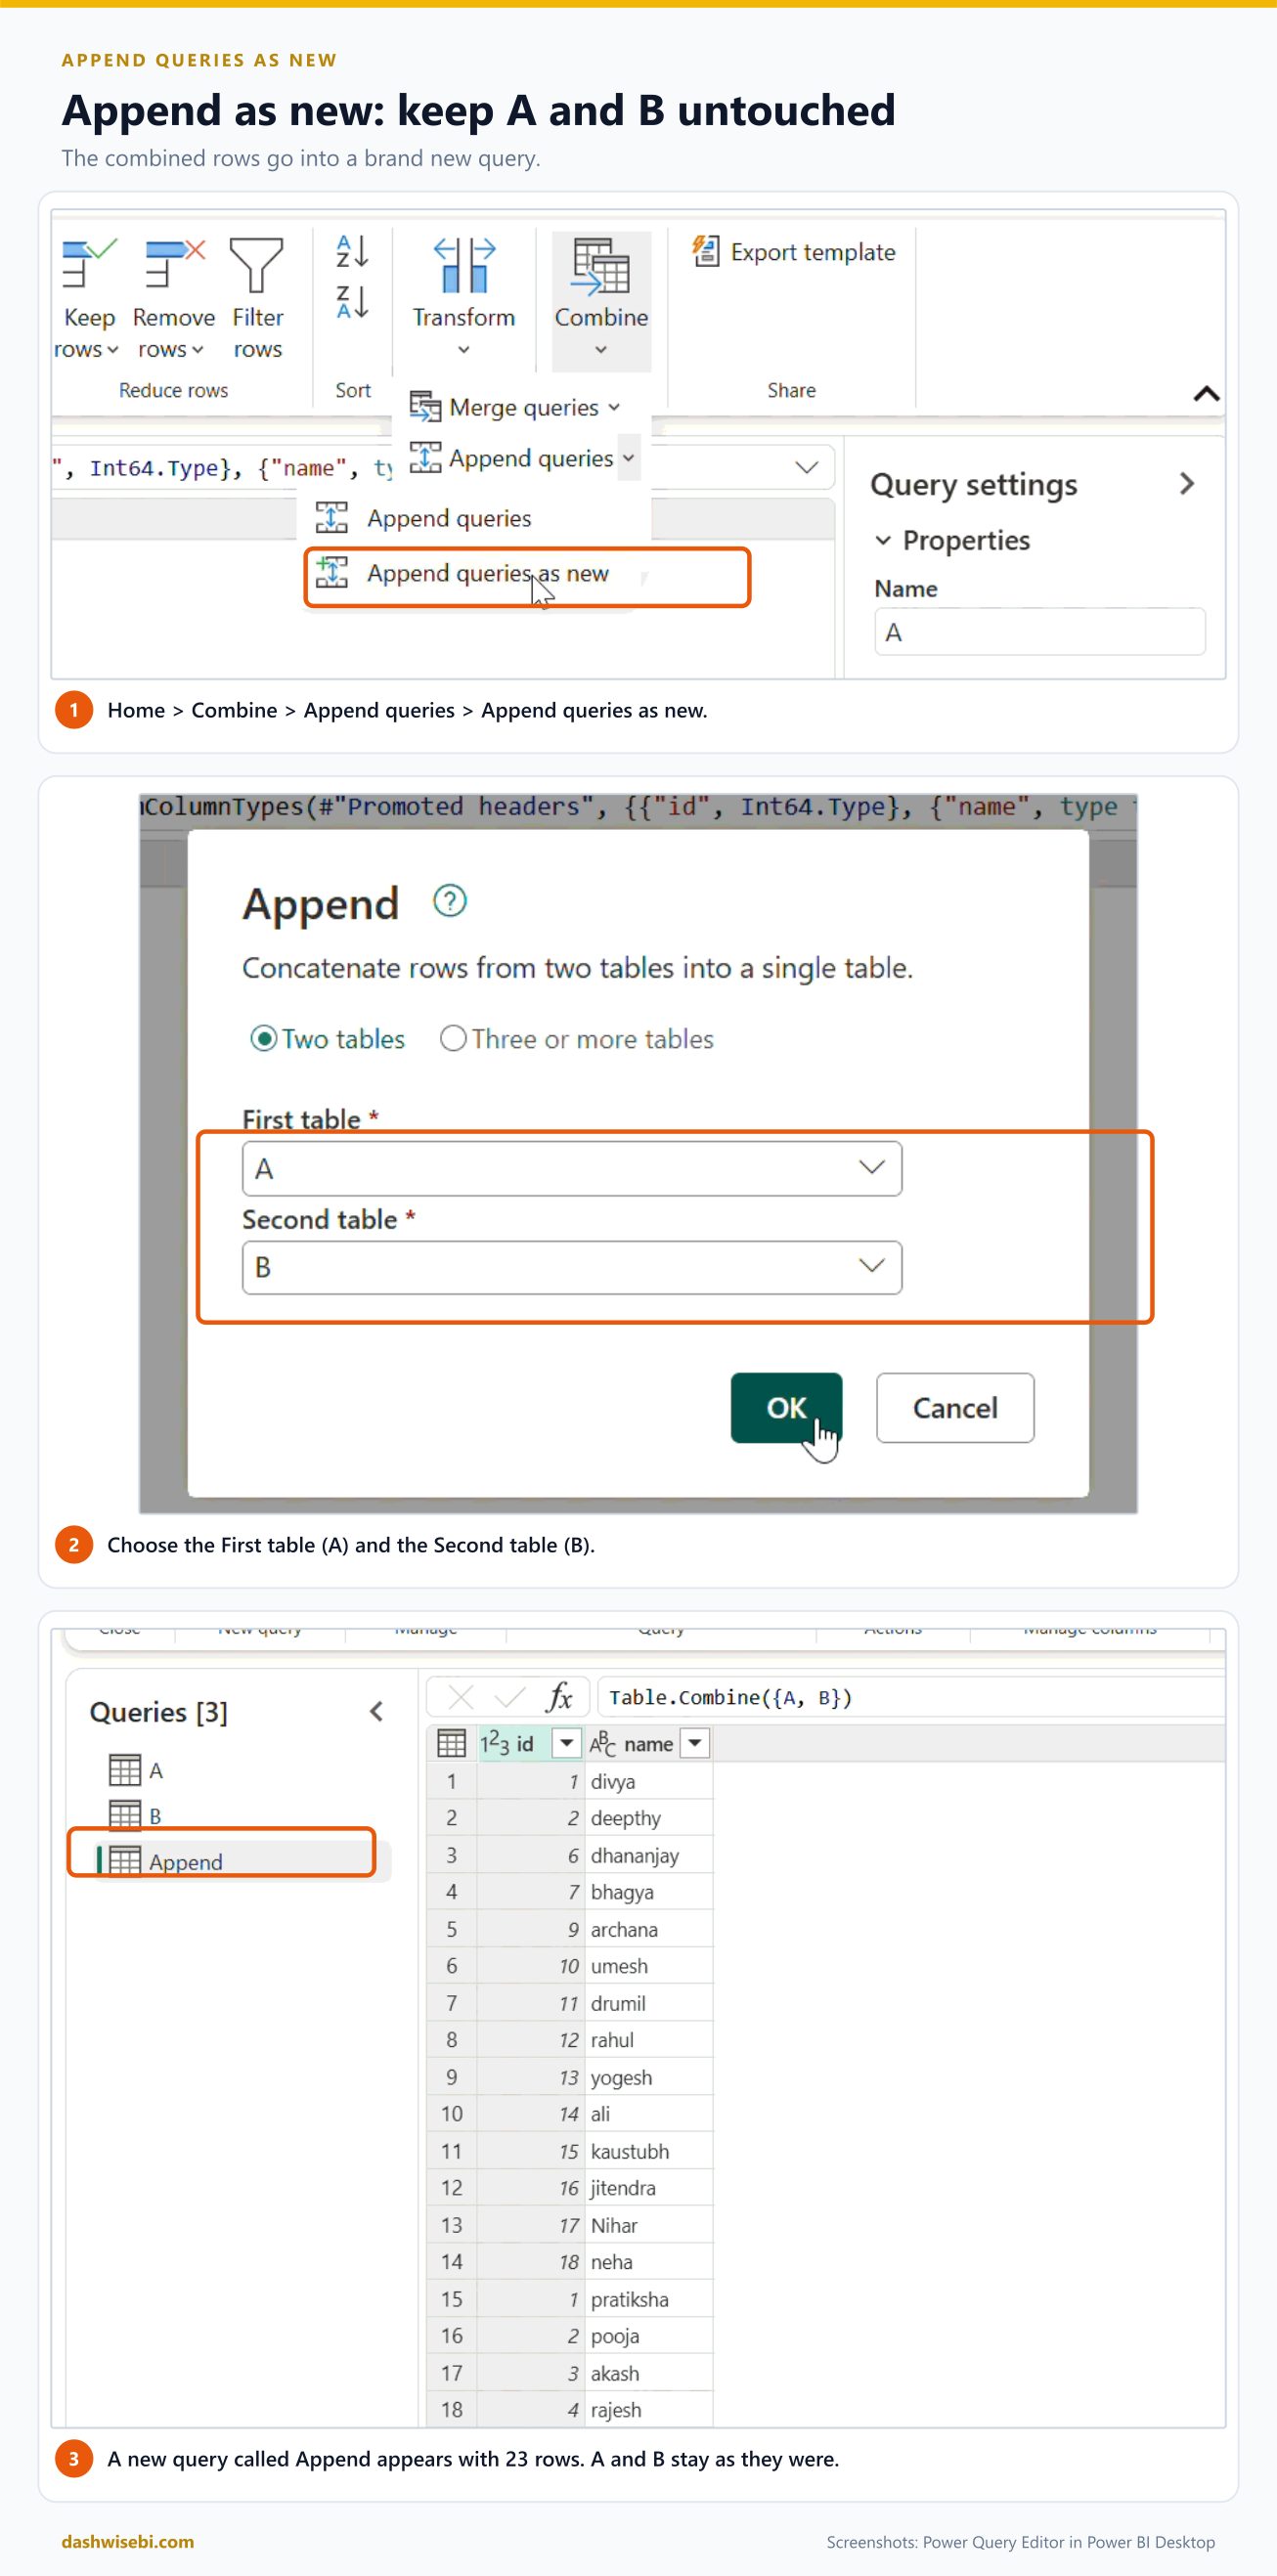
The new query is called Append, and its formula is Table.Combine({A, B}). A and B stay as they were. This is the better choice when A and B are also used somewhere else.
Merge queries
Merge is Power Query's version of a SQL join, or of an Excel VLOOKUP that can return many columns. In our demo Employee has emp_id, name and age for three people (101 Vijay, 102 Sanket, 103 Neena), and Designation has emp_id and designation (101 Jr, 101 Sr, 102 Lead, 106 lead).
- Select Employee, then choose Home > Combine > Merge queries.
- The first table is Employee. Pick Designation as the second table.
- Click the emp_id column in each table. Both columns are highlighted.
- Choose a Join kind. Left outer is the default. Select OK.
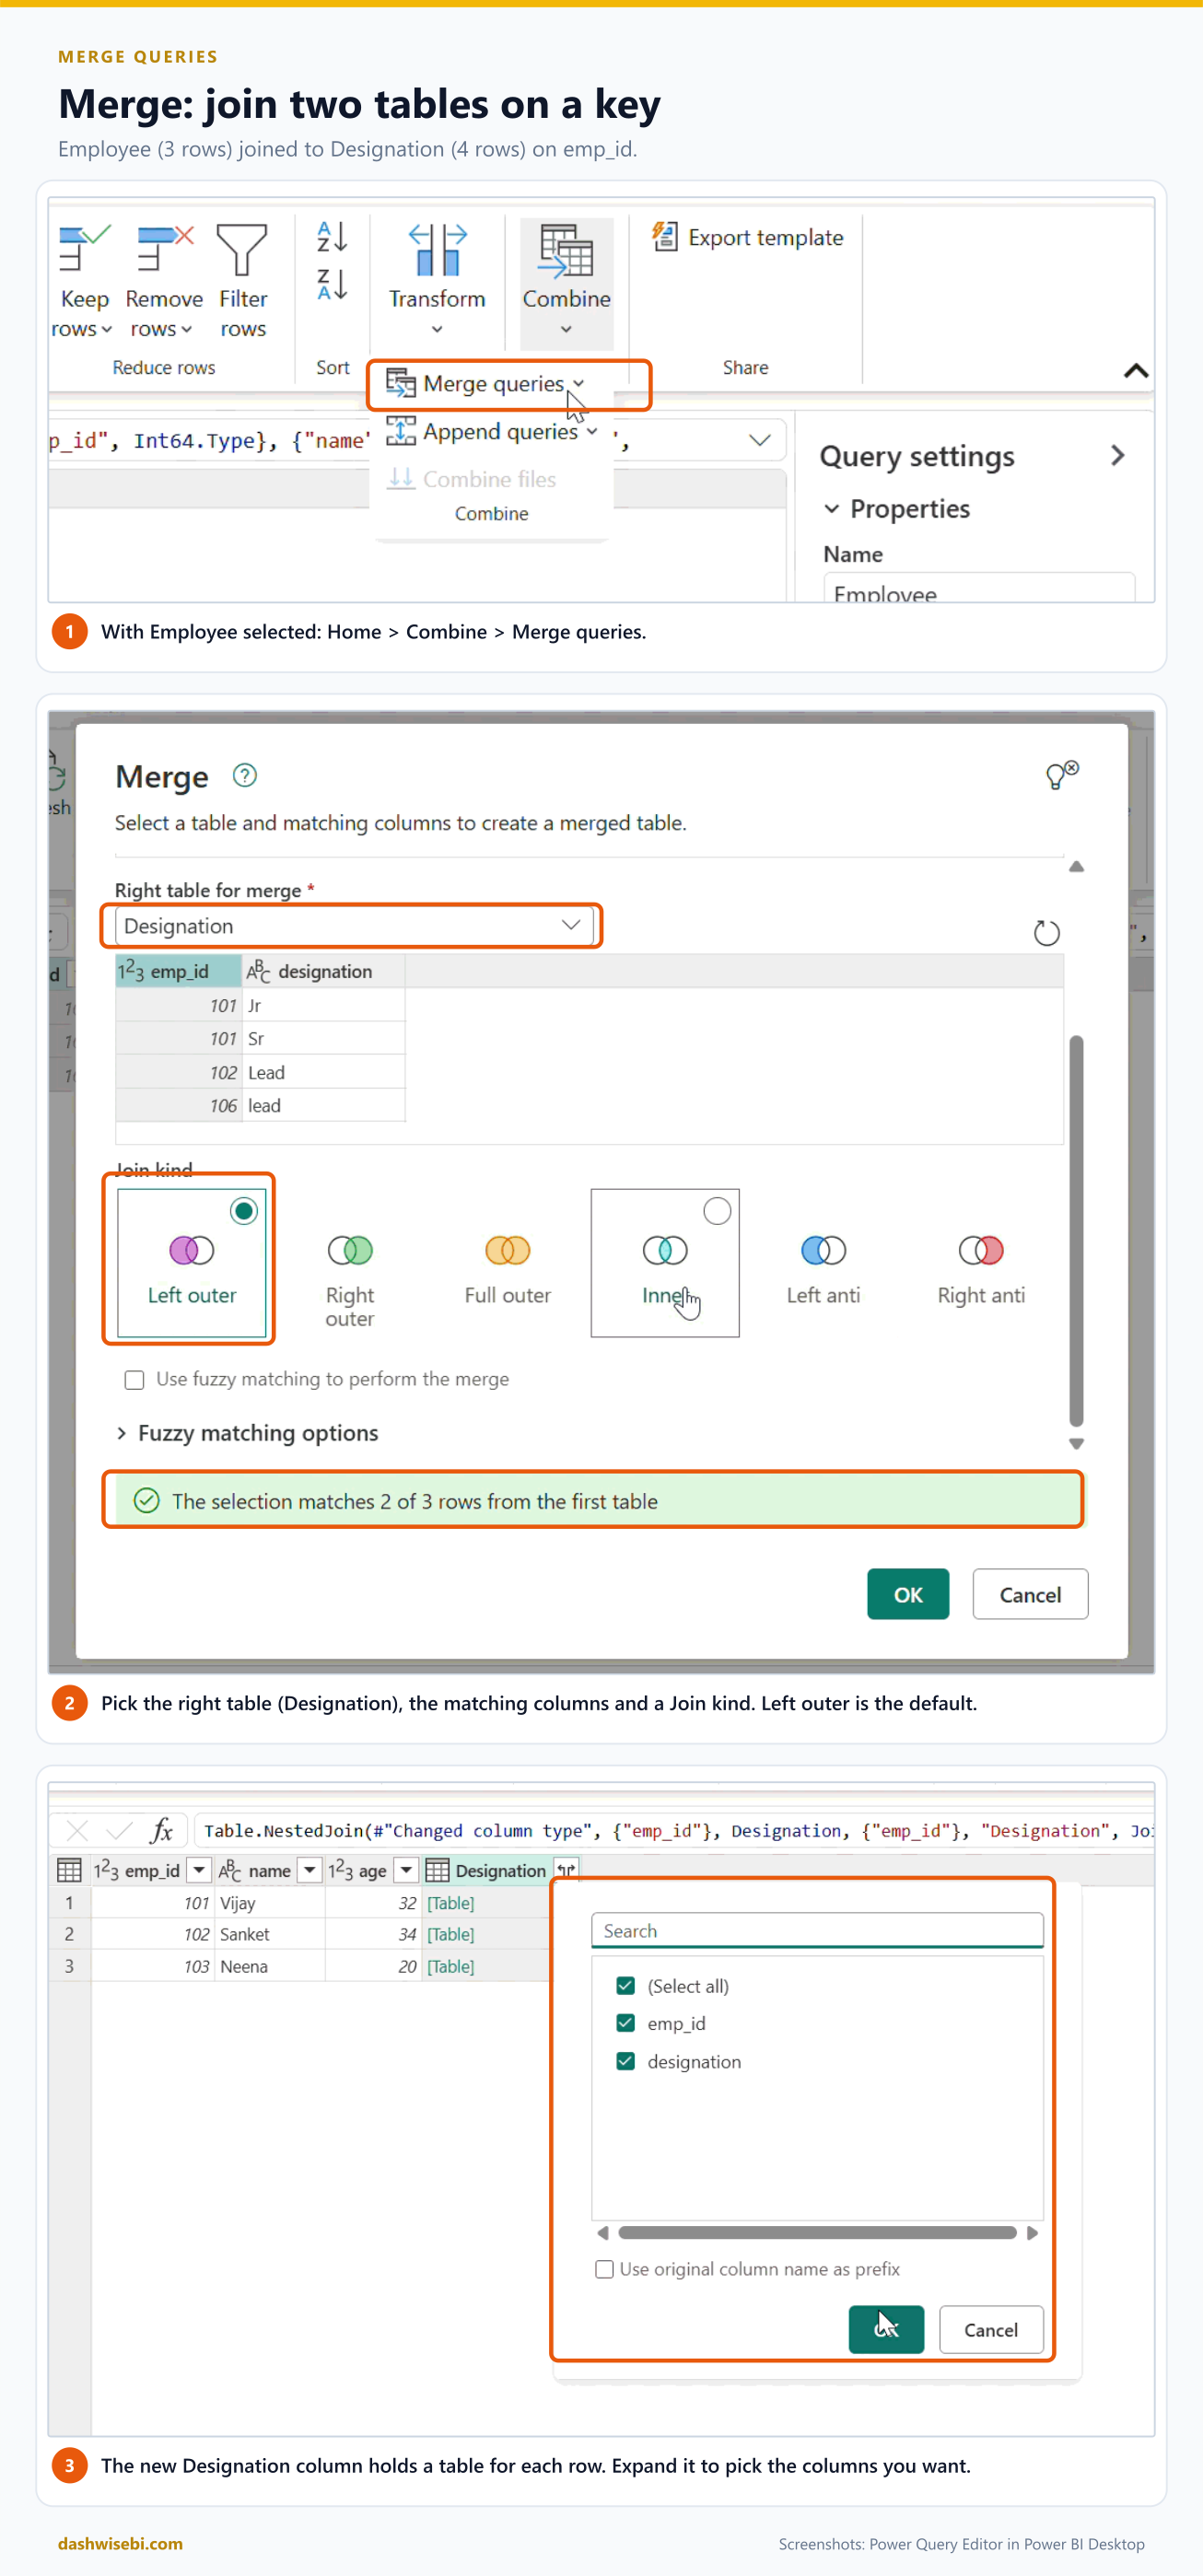
The merge adds one new column called Designation. Every cell says Table, because each employee can match more than one row. Click the expand icon in the column heading, choose the columns you want, and untick Use original column name as prefix if you do not want the prefix.
Here is what the join kinds did with our data:
- Employee 101 matches two rows, so Vijay appears twice once you expand, as Jr and as Sr.
- Employee 103 (Neena) matches nothing. With a left outer join she stays, with null as the designation.
- Designation 106 matches no employee. A left outer join drops it. A right outer or full outer join would keep it.
Two practical warnings. First, matching on text is case-sensitive, and so are stray spaces, so clean the key columns with Format > Trim and Clean before you merge. The merge dialog also offers Use fuzzy matching for approximate matches. Second, the key columns must have compatible data types. A whole number on one side and text on the other will not match.
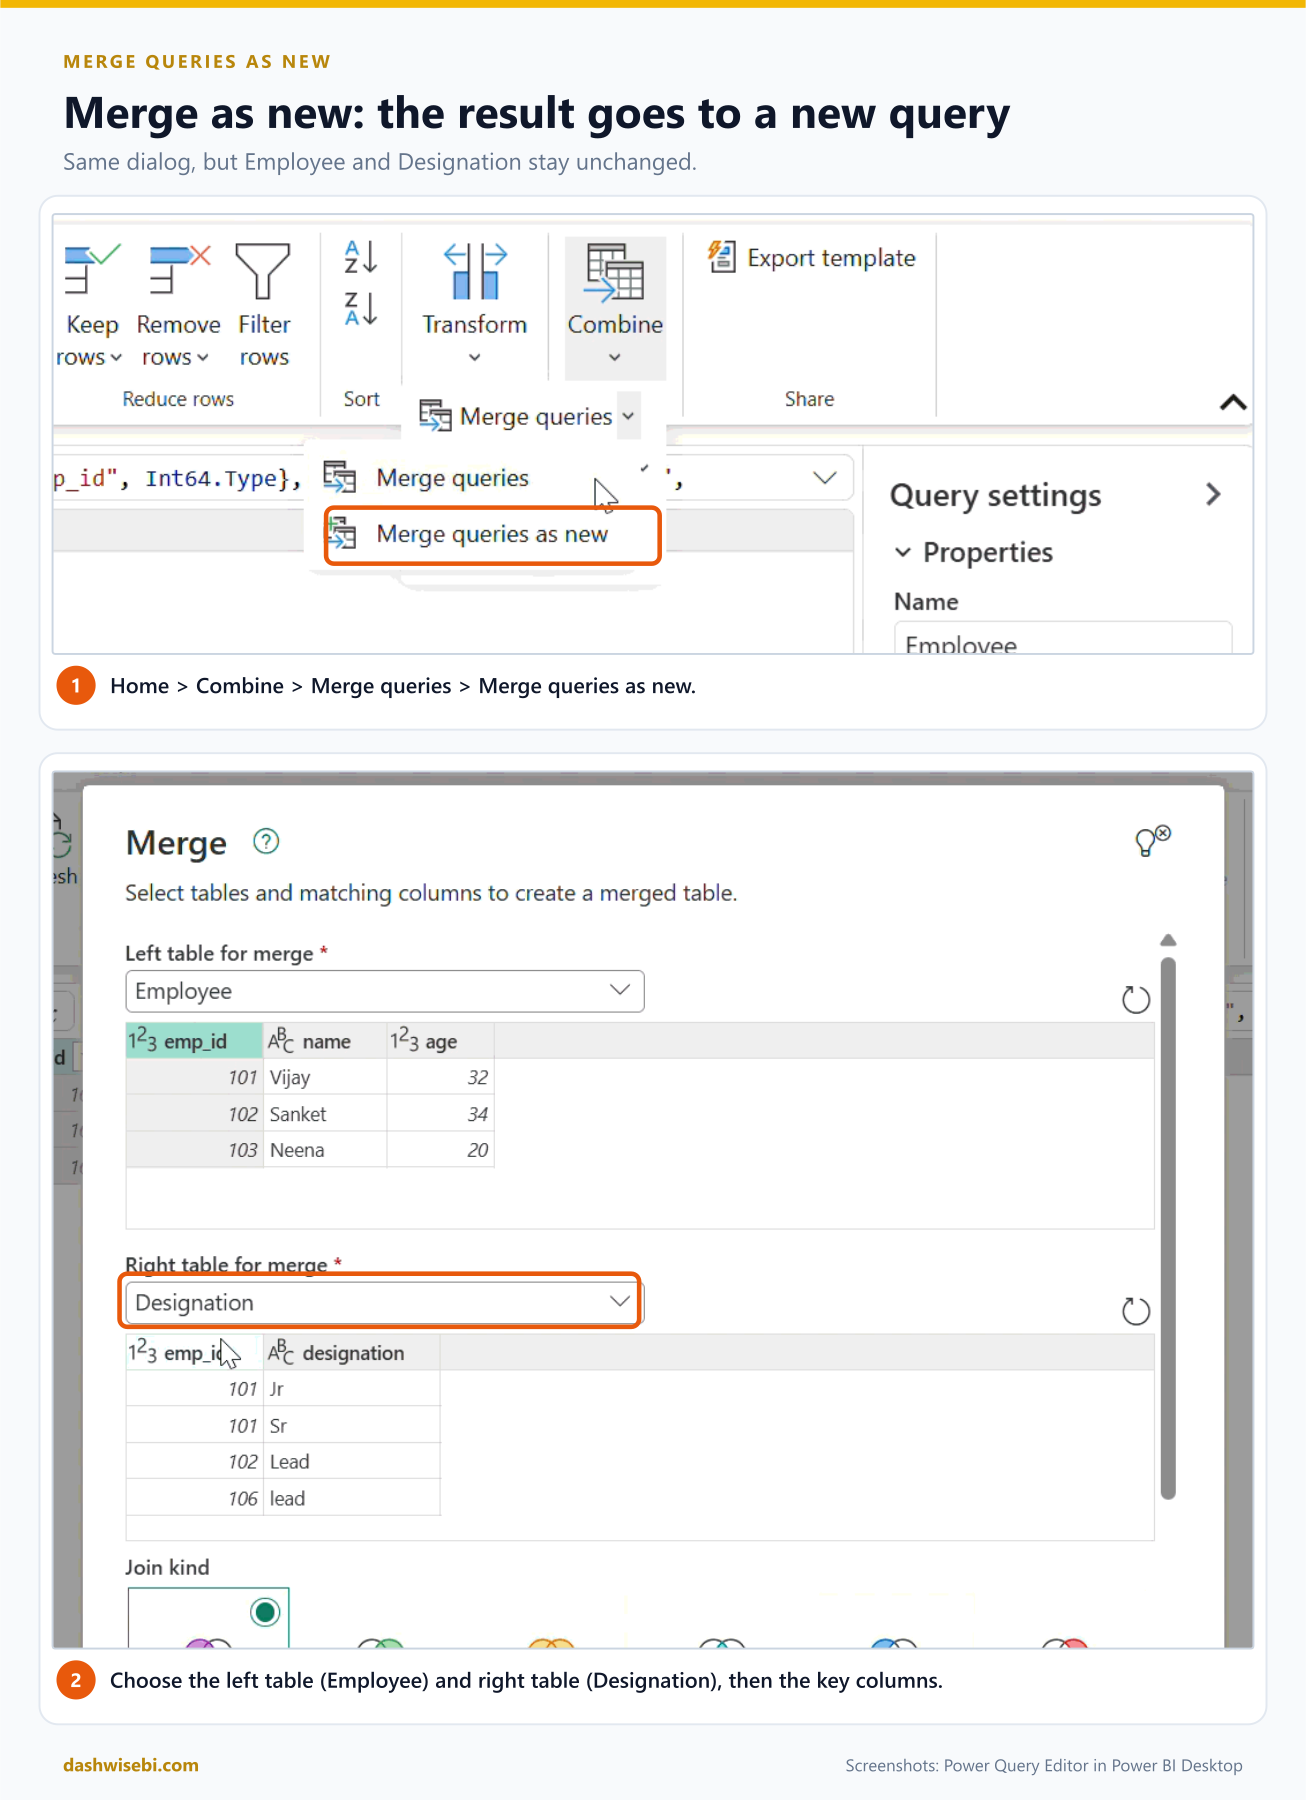
Merge queries as new
Just like append, Merge queries as new opens the same dialog but sends the result to a new query. Employee and Designation stay unchanged.
The six join kinds
- Left outer (default): all rows from the first table, and the matching rows from the second.
- Right outer: all rows from the second table, and the matching rows from the first.
- Full outer: all rows from both.
- Inner: only the rows that match in both.
- Left anti: rows only in the first table. Use it to find customers with no orders.
- Right anti: rows only in the second table.
6. Create fact tables and dimension tables
The goal of all this shaping is a model that Power BI loves: a star schema. One fact table sits in the middle, and several dimension tables surround it.
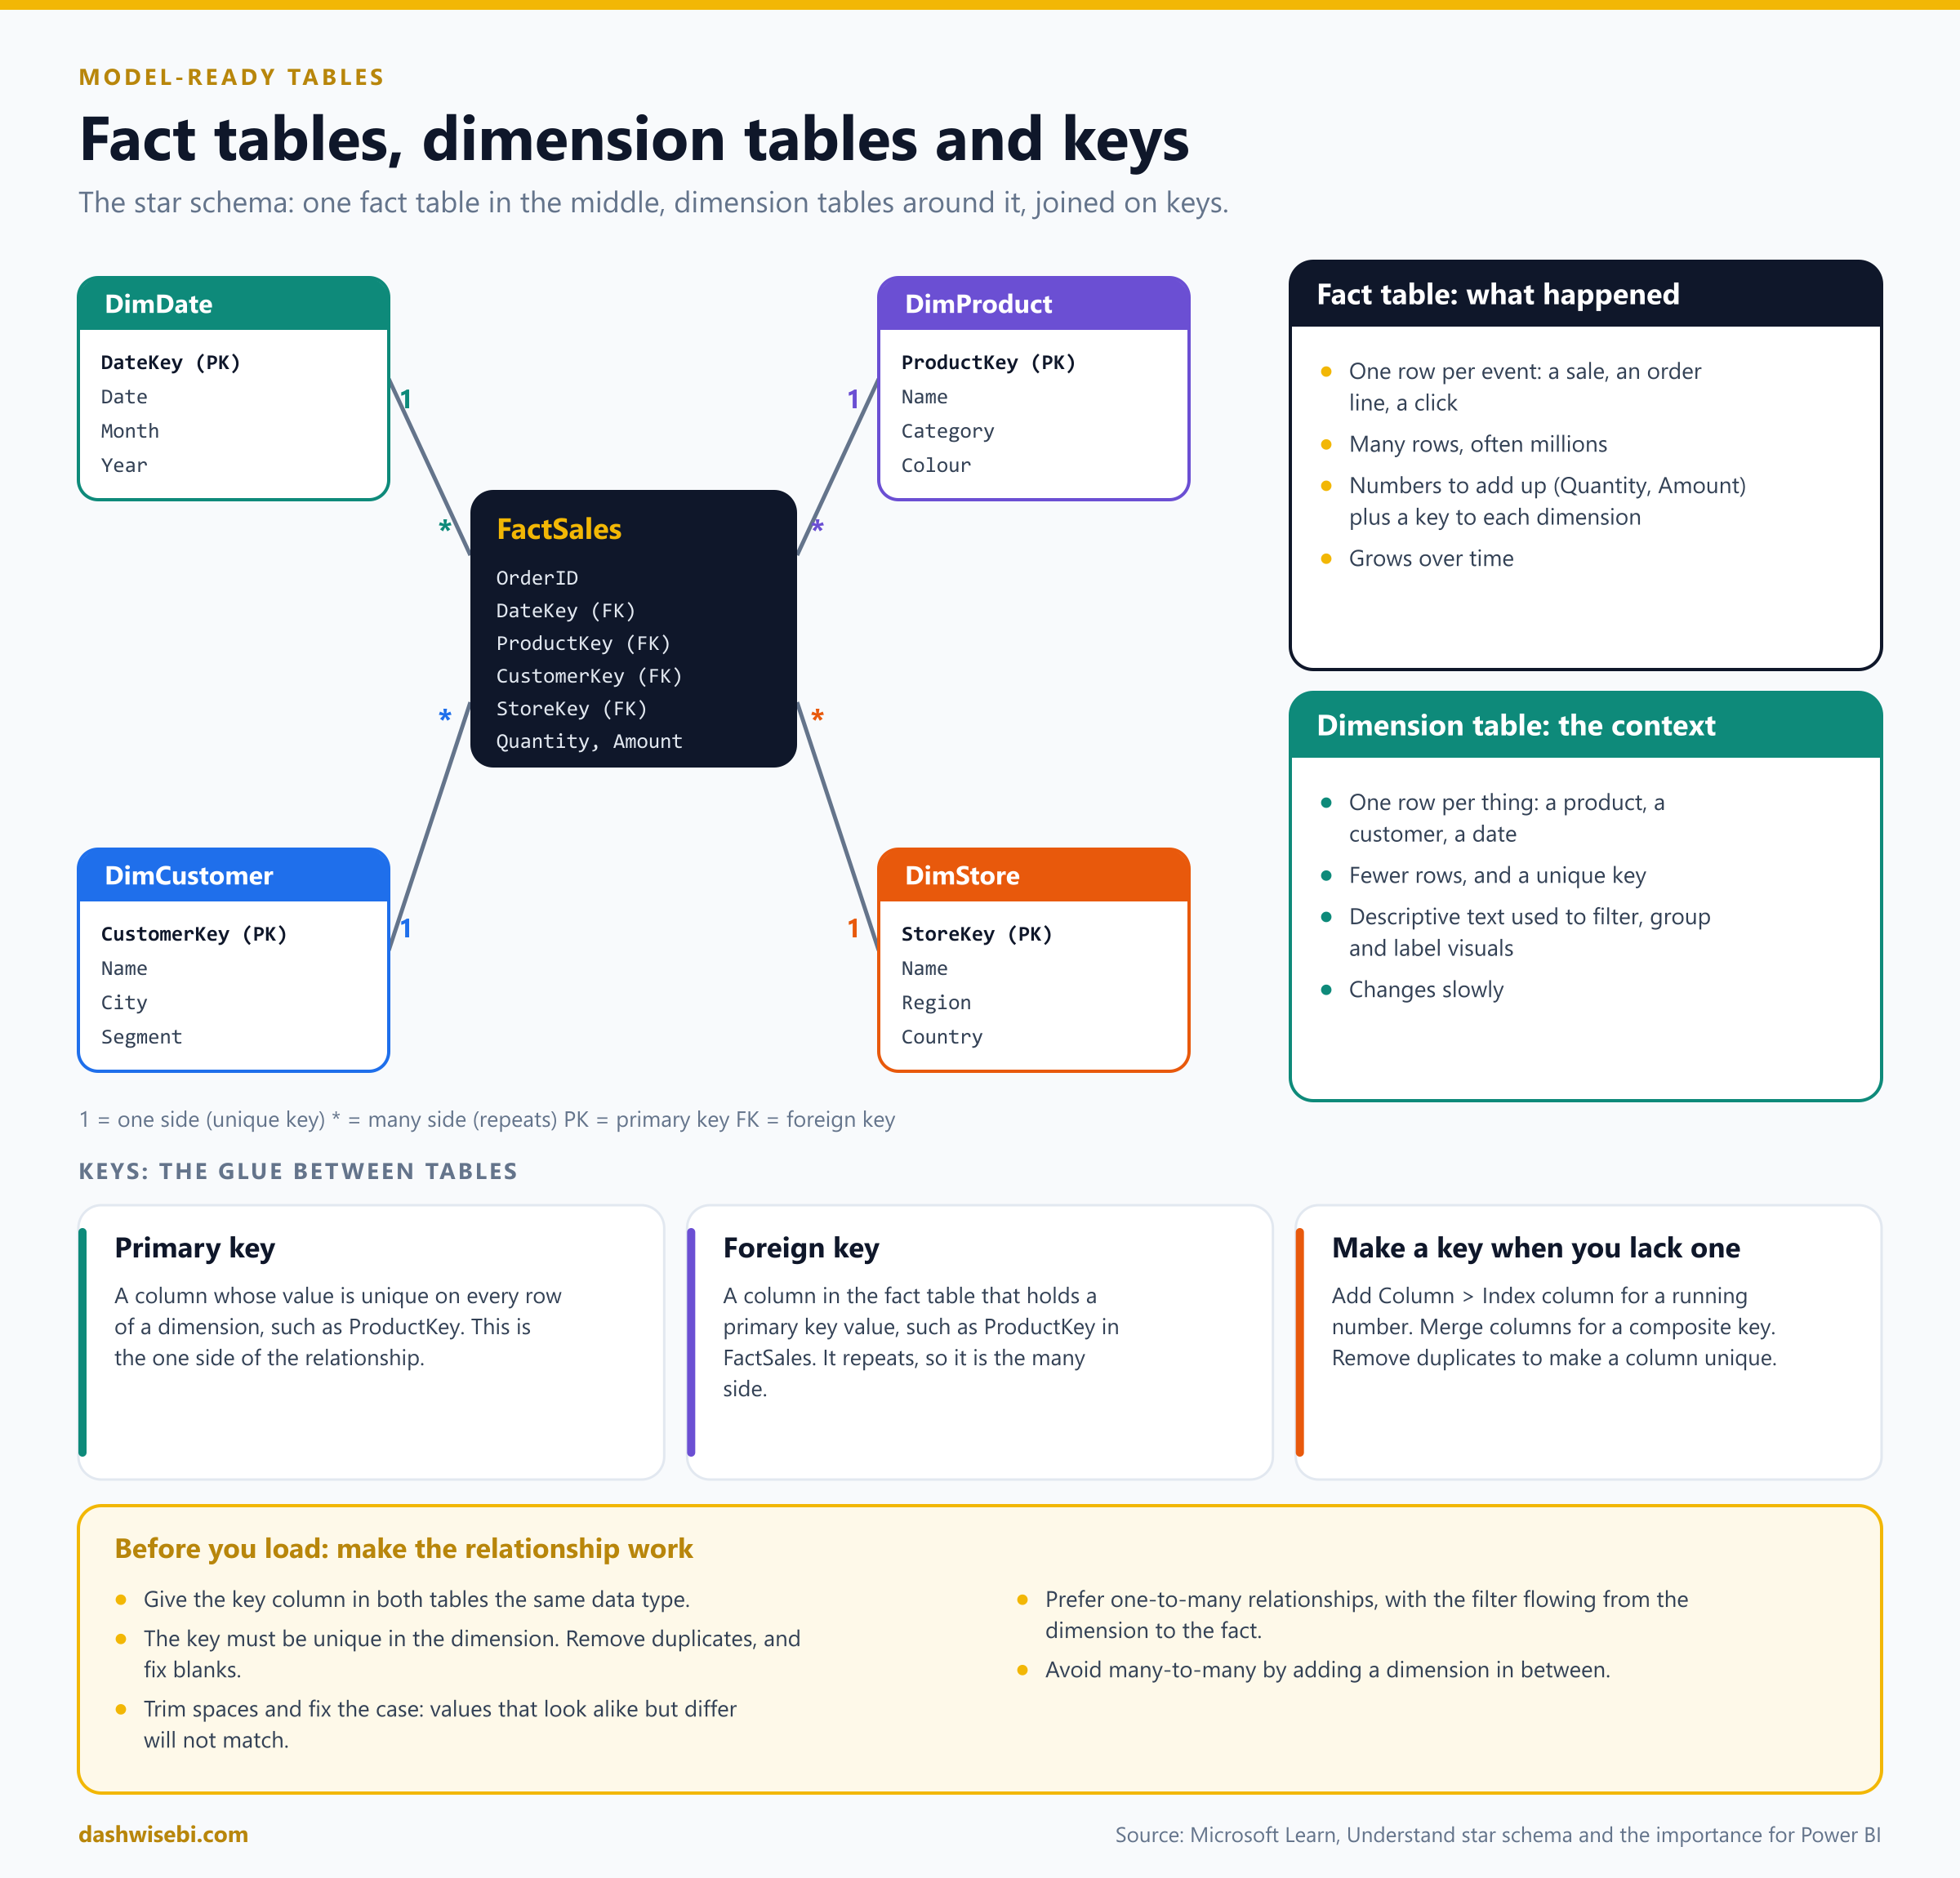
- A fact table records what happened: one row per sale, order line or click. It has many rows, a few numbers to add up (Quantity, Amount), and a key for each dimension.
- A dimension table describes the context: one row per product, customer or date. It has fewer rows, a unique key, and descriptive text used to filter, group and label visuals.
Source data is often one big flat table with everything together. Splitting it is a Power Query job. For example, from a flat Sales table you can create a DimProduct table by choosing the product columns, then Remove duplicates. The fact table keeps the numbers and the product key, and the descriptive product columns are removed from it.
Why bother? Smaller models, faster visuals, simpler DAX, and filters that behave. The Microsoft Learn star schema article is the one to read for the exam.
7. Identify and create keys for relationships
Tables are joined by keys. A primary key is unique on every row of a dimension, such as ProductKey. A foreign key is the column in the fact table that holds those values, and it repeats. That gives the standard one-to-many relationship, drawn from the dimension to the fact.
Before you load, check four things on each key:
- The column has the same data type in both tables.
- It is unique in the dimension. Remove duplicates and fix blanks.
- Values that look alike really are alike. Trim spaces and fix the case.
- You are not forcing a many-to-many relationship. If you have one, add a dimension table in between.
If the data has no usable key, you can create one: Add Column > Index column for a simple running number, Merge columns to build a composite key from two or more columns, or Remove duplicates on a column to make a list of unique values.
8. Reference or duplicate? Know the impact
Right-click a query in the Queries pane and you will find both options. They look similar and behave very differently.
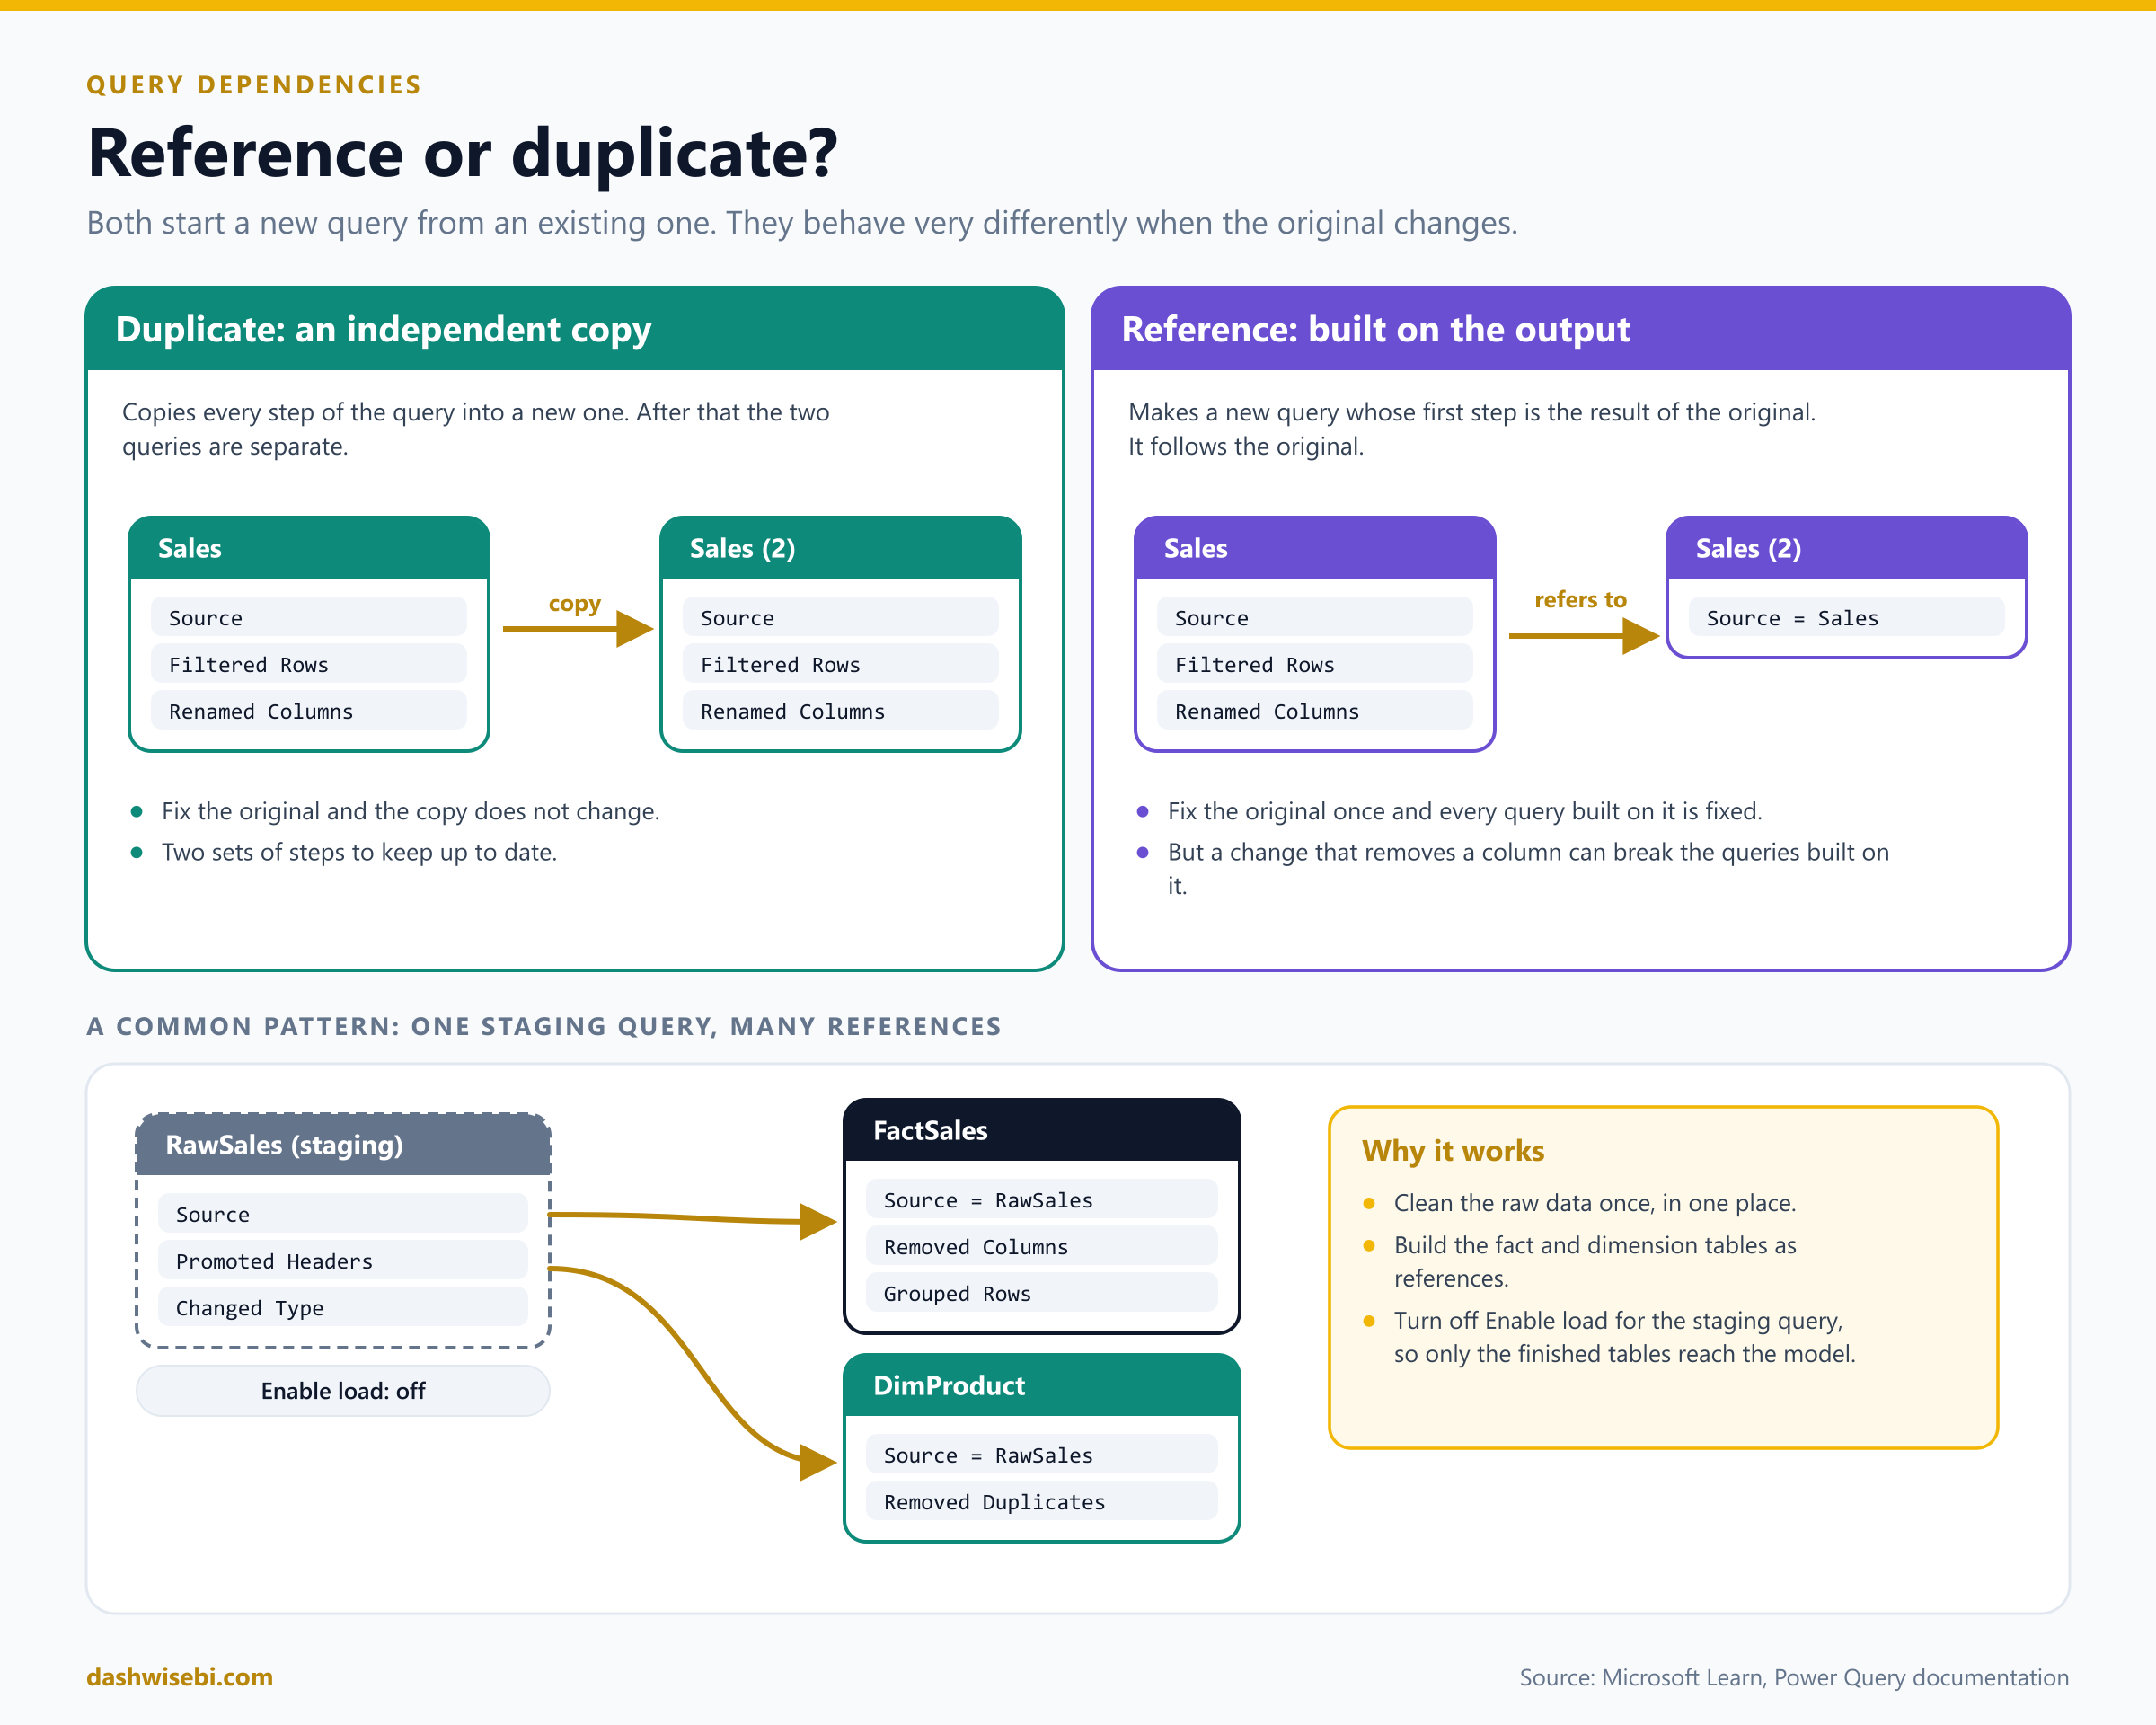
- Duplicate copies every step. The new query is independent. Fix the original and the copy does not change, so you now maintain two sets of steps.
- Reference creates a new query whose first step is the output of the original. Fix the original once and every query built on it follows. The risk is the reverse: if you remove a column from the original, queries that refer to it can break.
A tidy pattern is to import and clean the raw data once in a staging query, and then create the fact and dimension tables as references to it. Then switch off loading for the staging query (next section), so only the finished tables reach the model. Microsoft has a guidance article on referenced queries in Power Query, worth a read before the exam.
You can see these links on the View > Query Dependencies diagram.
9. Configure data loading for queries
When you choose Close & Apply, Power Query sends its queries to the data model. But not every query should become a table. Two options in the right-click menu of a query control this.
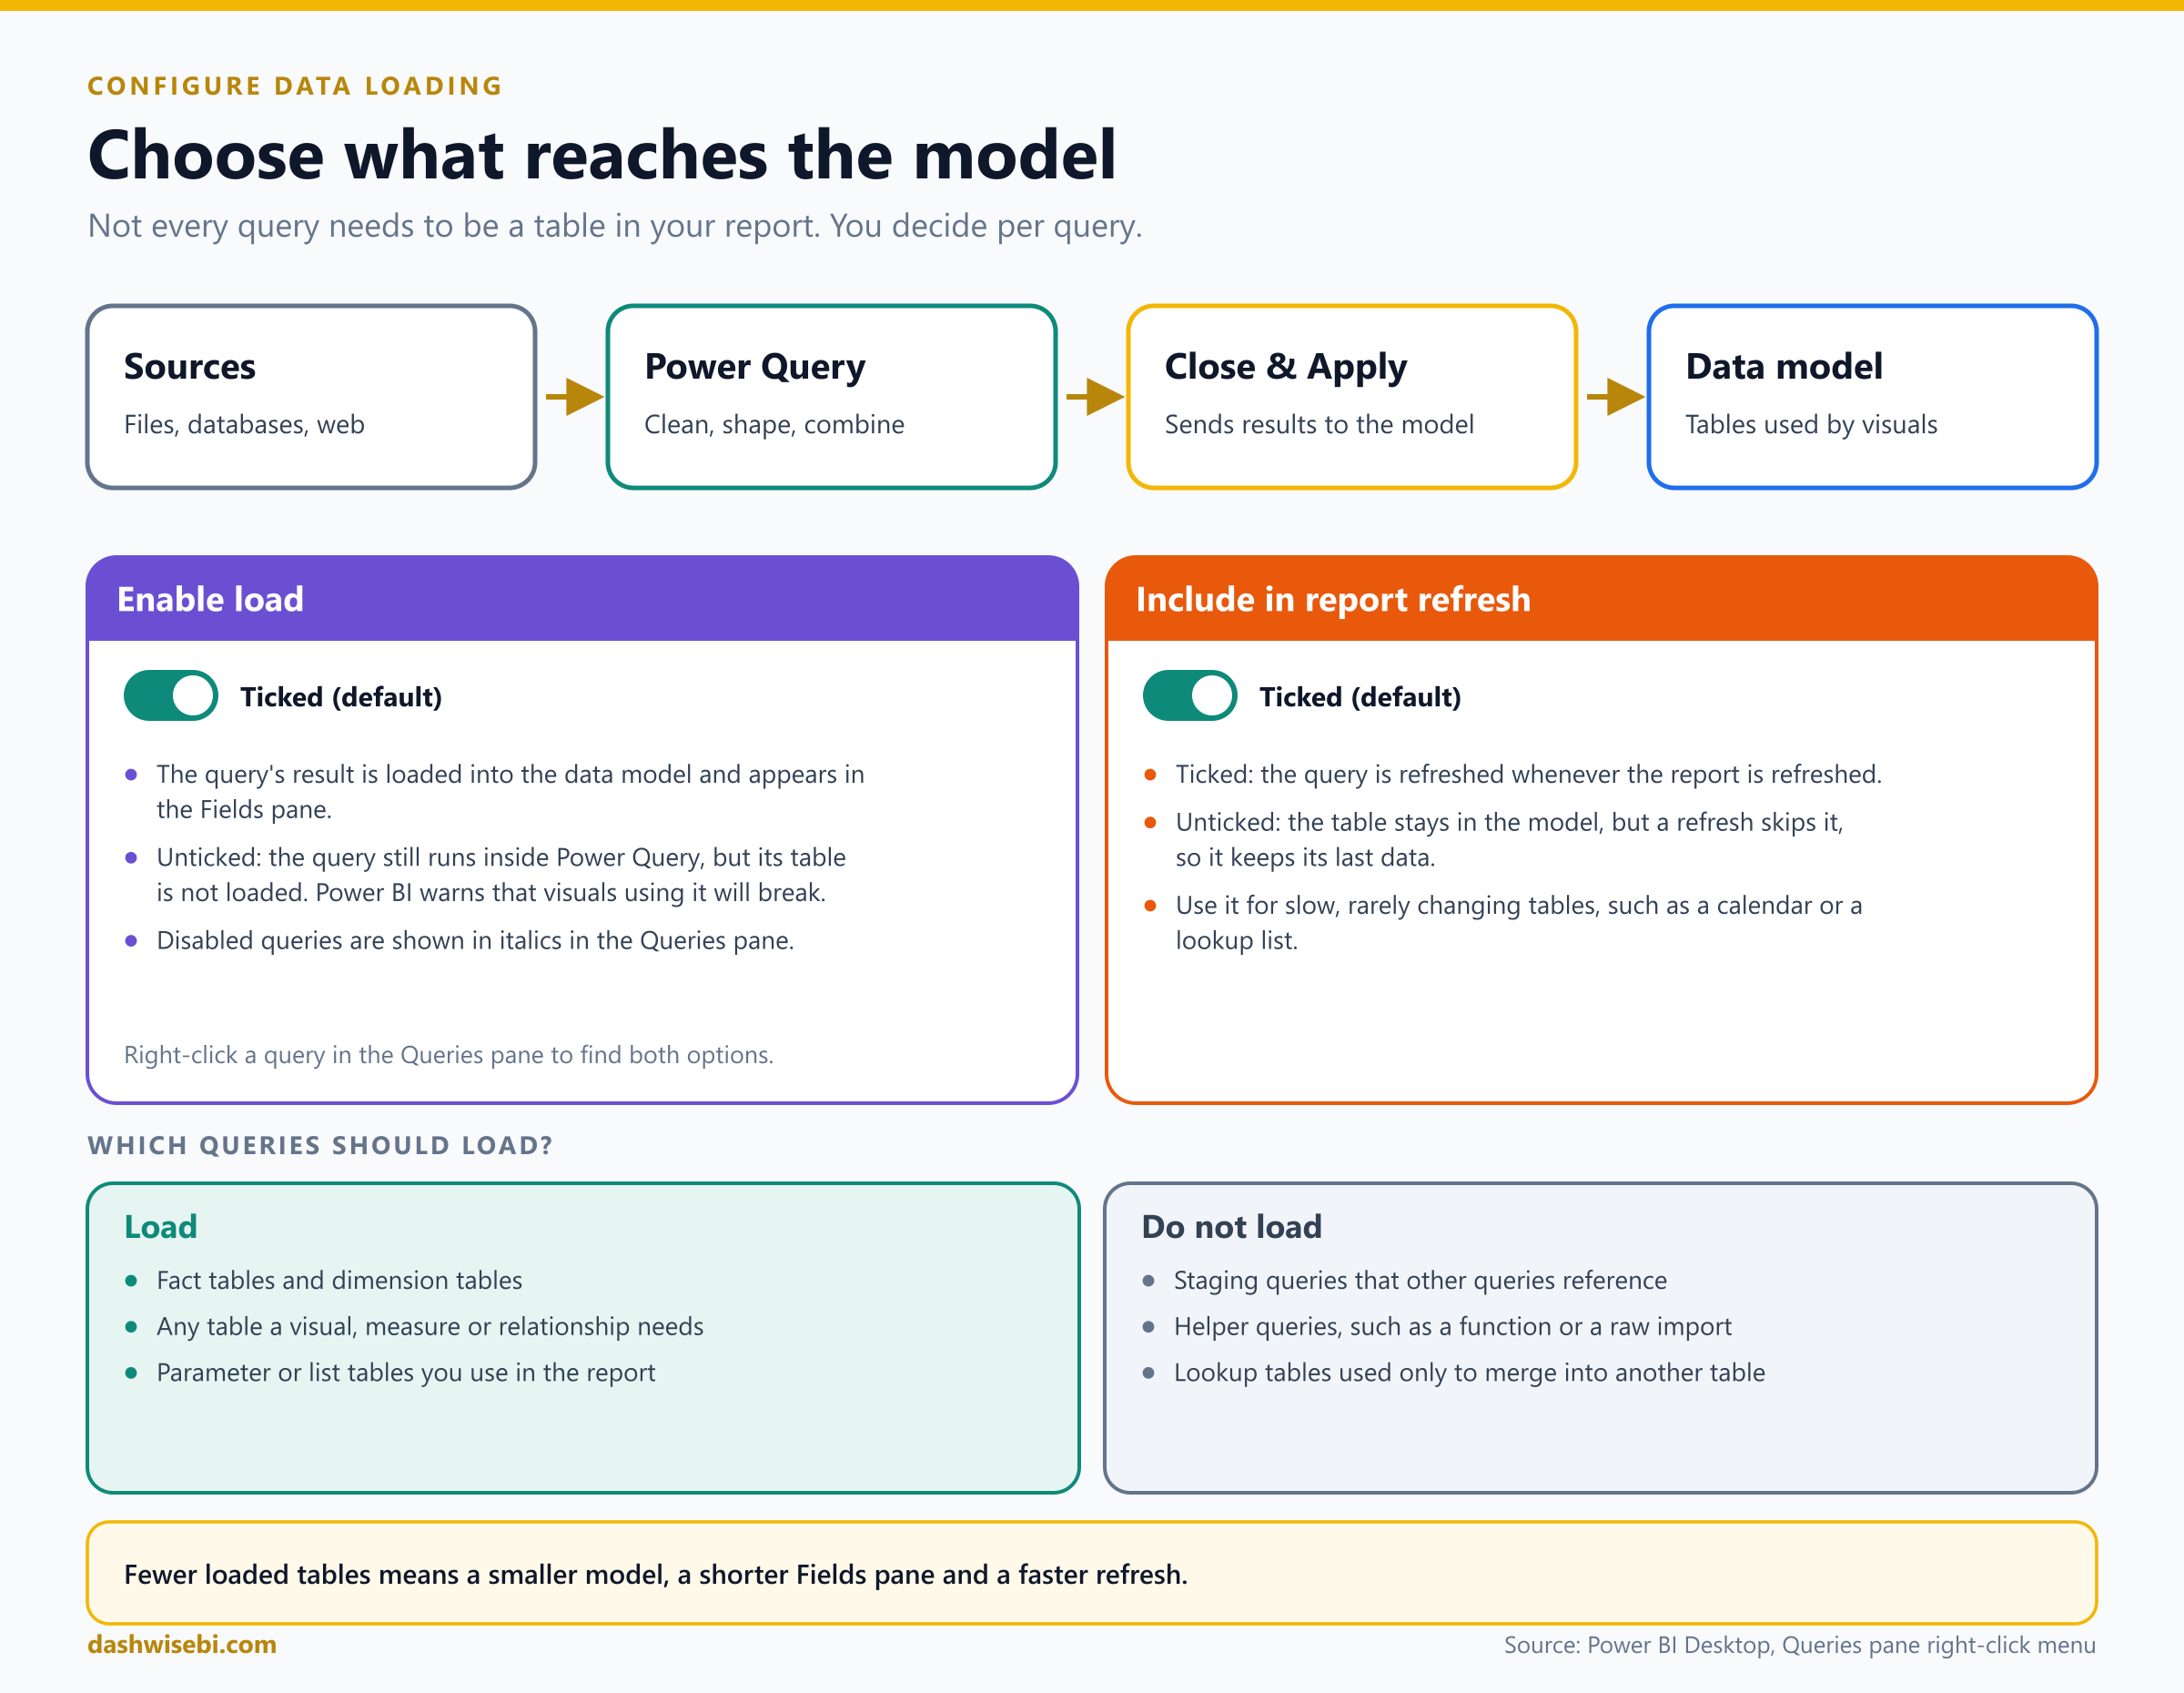
Enable load
This is ticked by default. Untick it, and Power BI warns you that the table will be removed from the report and that visuals using it will break. The query still exists in Power Query and other queries can use it, but it does not reach the model. Disabled queries are shown in italics in the Queries pane.
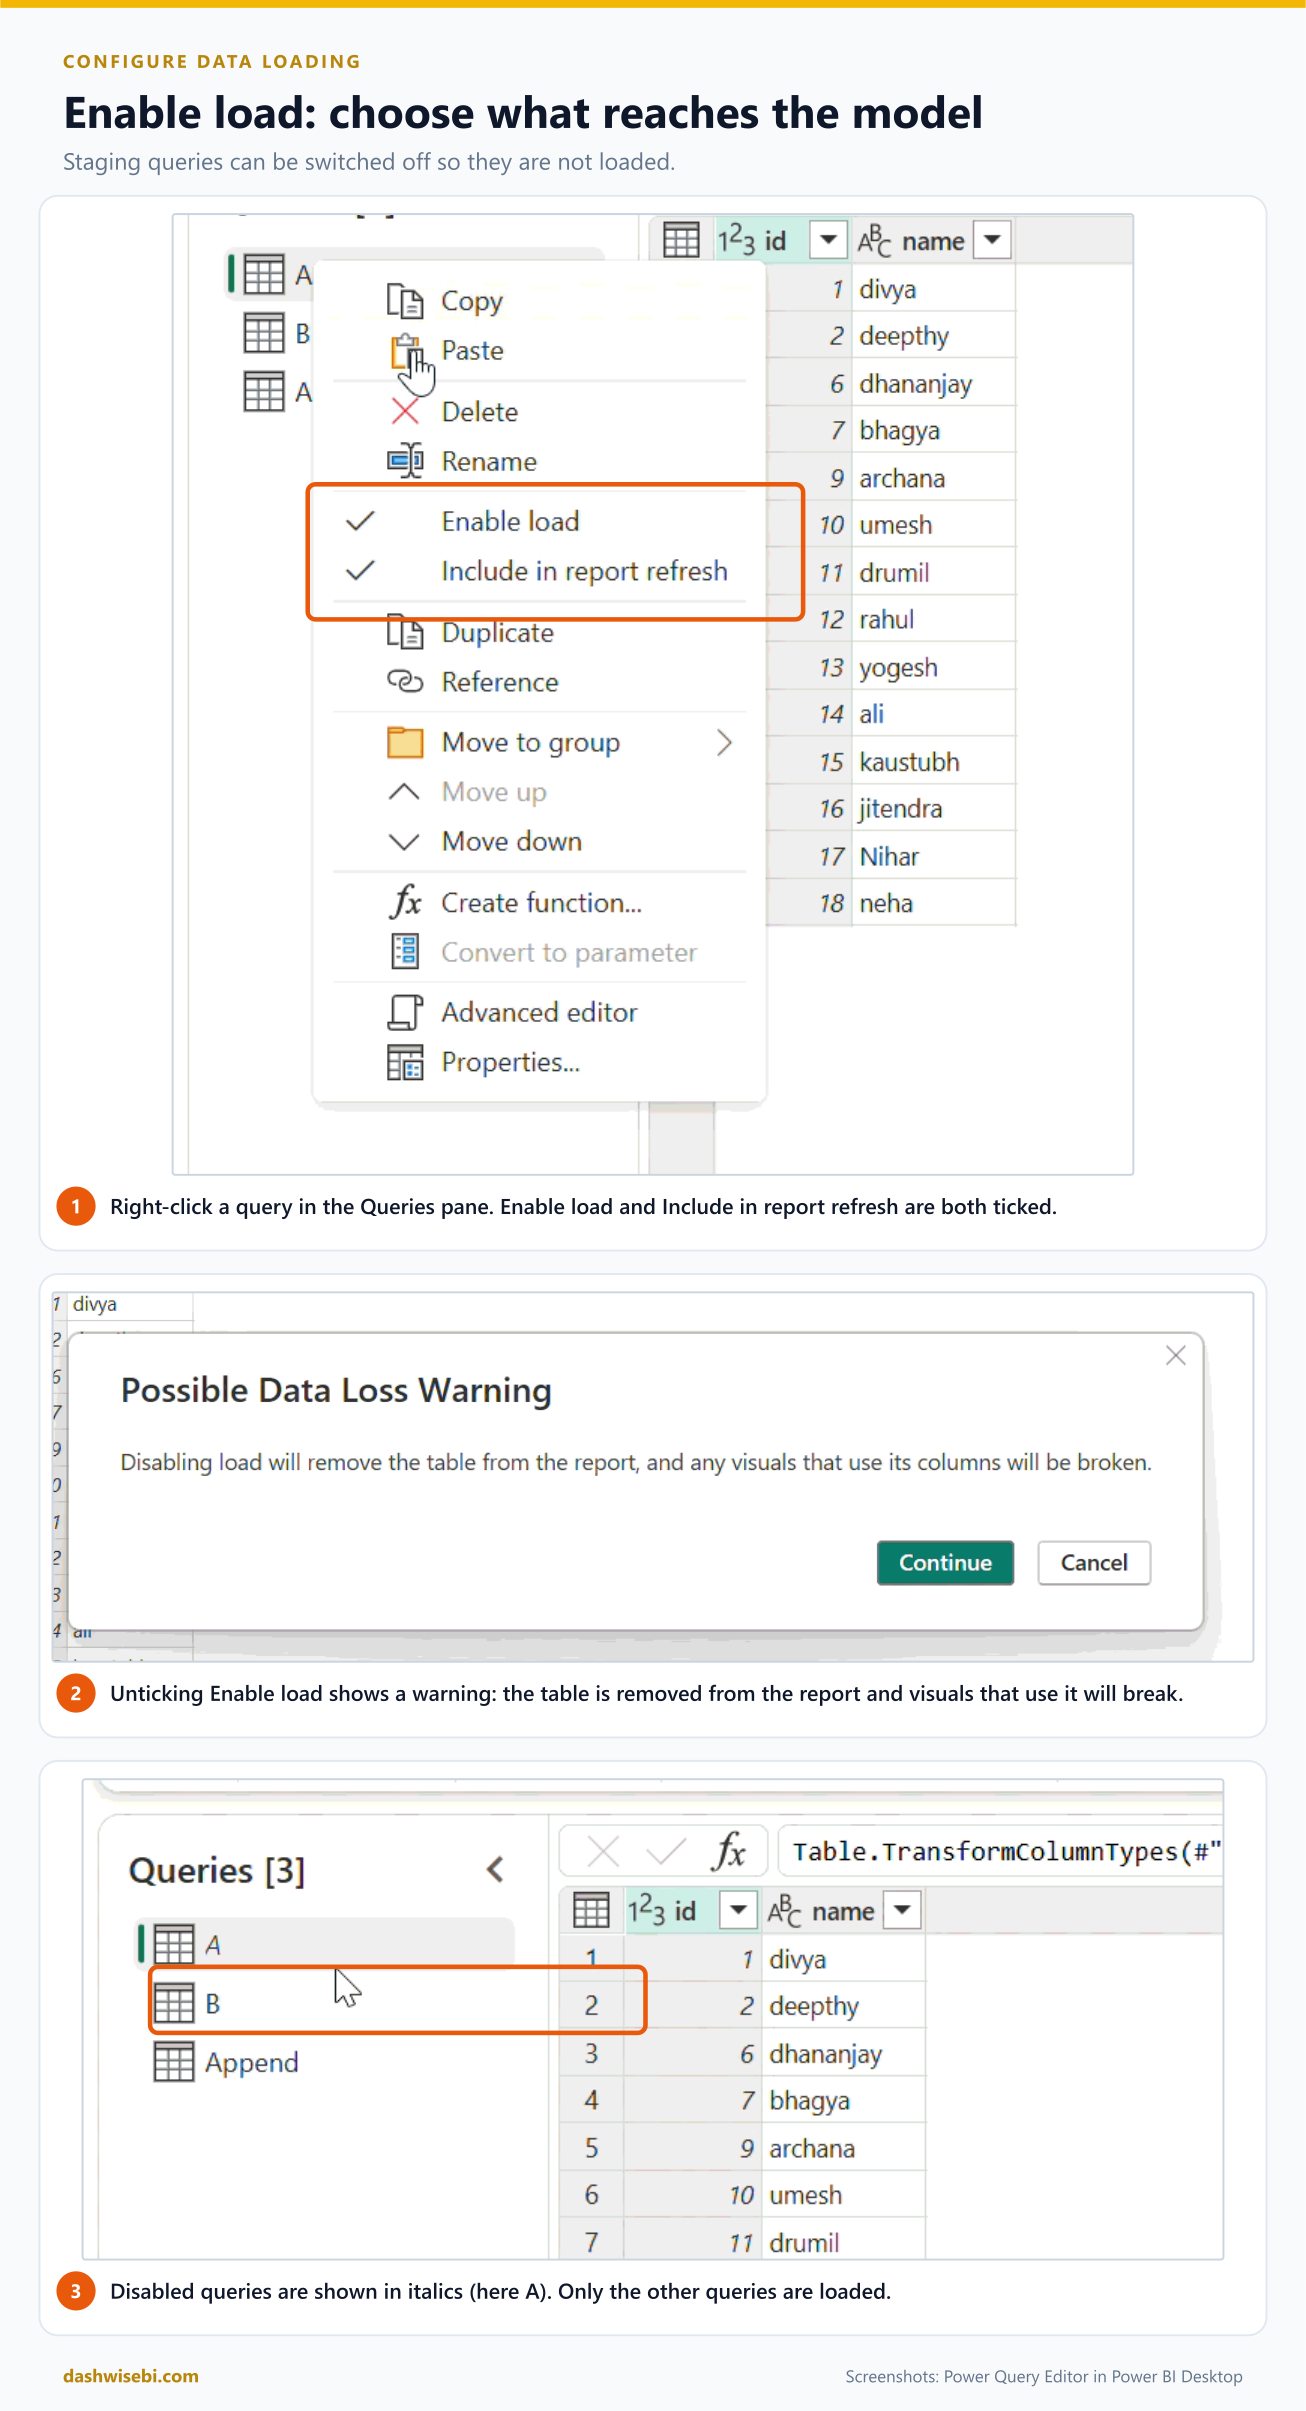
In the demo, query A is switched off and appears in italics. The other queries load as normal.
Include in report refresh
Also ticked by default. If you untick it, the table stays in the model but is skipped when you refresh the report, so it keeps the data it already has. That suits slow tables that rarely change, such as a lookup list. The exact wording of the menu can differ a little between versions of Power BI Desktop, so check the options on your own copy.
What to load
- Load the fact and dimension tables, and anything a visual, measure or relationship needs.
- Do not load staging queries, helper queries such as functions, and lookup tables you used only to merge into another table.
Fewer loaded tables means a smaller model, a shorter Fields pane and a faster refresh.
Cheat sheet
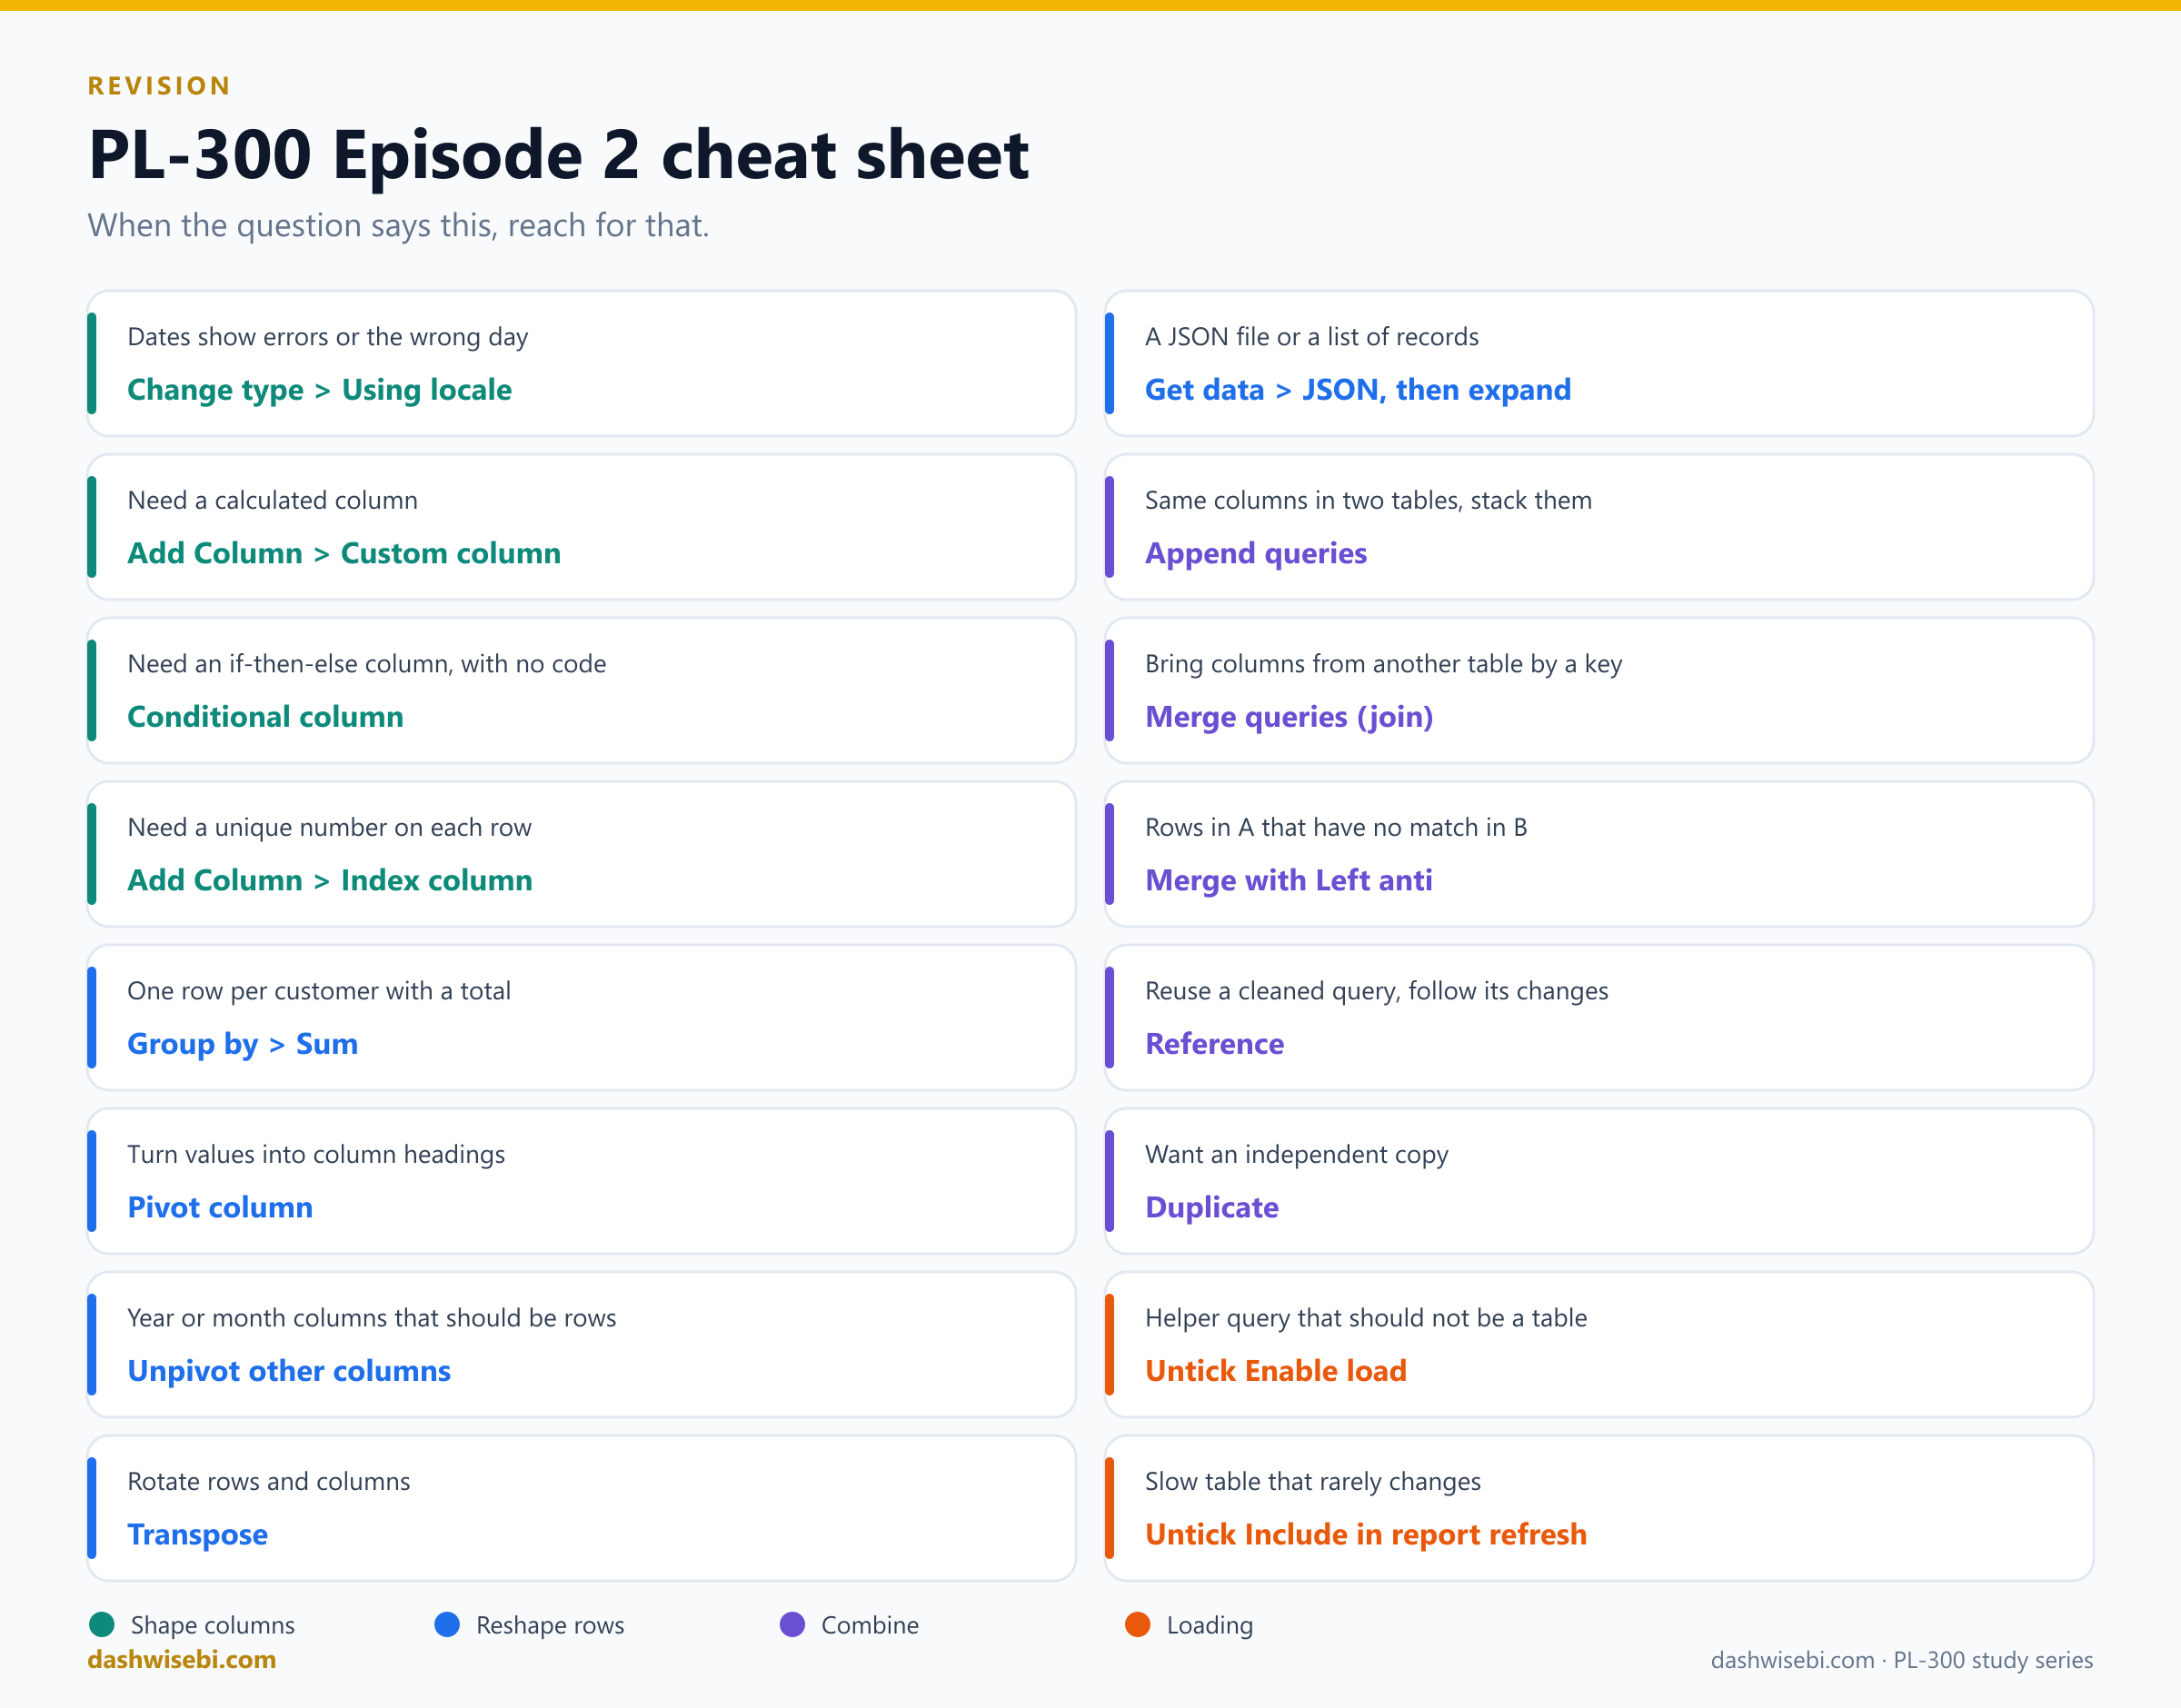
Save this one for revision. When a question describes a problem, find it on the left and pick the tool on the right.
Try it yourself: five exam-style questions
Question 1
A CSV file holds dates like 22/11/2026. Your Power BI Desktop uses English (United States). Converting the column to Date gives errors. What should you do?
Answer: Use Change type > Using locale, choose Date, and set the locale to English (United Kingdom).
Question 2
A sales sheet has one column for every month, and a new column is added each month. You want a Date column and a Sales column that keep working. What do you do?
Answer: Select the identifier columns and choose Unpivot other columns. Newly added month columns are then unpivoted automatically at the next refresh.
Question 3
You have one query per region, and all have the same columns. You want a single table without changing the regional queries. Which command?
Answer: Append queries as new, with three or more tables if there are more than two regions.
Question 4
Customer has every customer, and Orders has the orders. You need the customers who have never ordered. What do you use?
Answer: Merge queries with Customer as the first table, Orders as the second, joined on the customer key, with the join kind Left anti.
Question 5
You import a raw file once and build FactSales and DimProduct from it. The raw query must not appear in the report. What should you do?
Answer: Build FactSales and DimProduct as references to the raw query, and untick Enable load on the raw query.
Where to go next
Practise each skill on a small file of your own. Break it, fix it, and watch the Applied steps. That is the fastest way to remember it.
- Try our free practice quizzes
- Join the Data Days study group
- Read Part 1: Getting, connecting and profiling data
Microsoft Learn references
- PL-300 study guide
- Learning path: Prepare data for analysis
- Data types in Power Query
- Add a custom column, add a conditional column and add a column from an example
- Group by, pivot columns, unpivot columns and transpose a table
- JSON connector
- Append queries and merge queries overview
- Understand star schema and the importance for Power BI
- Model relationships in Power BI Desktop
- Referencing Power Query queries
- Query overview in Power BI Desktop
See you in Episode 3. Happy transforming.
Keep reading
From Connection to Confidence: Getting, Connecting & Profiling Data in Power BI
Microsoft Data Days 2026 | PL-300 Certification Series — Part 01
Fabric Overview, Domains, Workspaces & OneLake
Fabric in four ideas: the platform, domains for ownership, workspaces for access and OneLake for storage, explained with eight diagrams and a cheat sheet.